Review
. 2022 Apr;227(3):741-762.
doi: 10.1007/s00429-021-02435-0. Epub 2022 Feb 10.

A hands-on tutorial on network and topological neuroscience

Affiliations
Review

A hands-on tutorial on network and topological neuroscience

Eduarda Gervini Zampieri Centeno et al. Brain Struct Funct. 2022 Apr.

Abstract

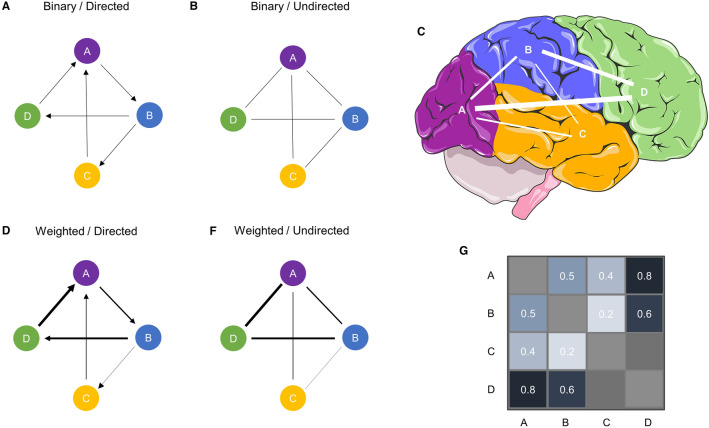
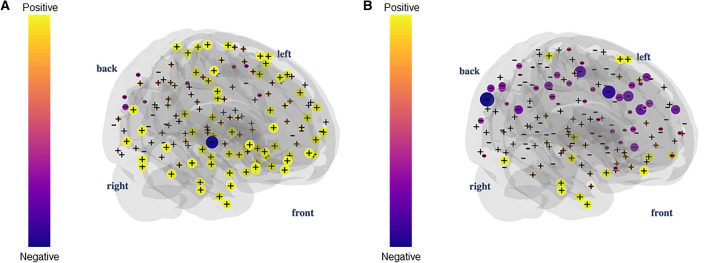
The brain is an extraordinarily complex system that facilitates the optimal integration of information from different regions to execute its functions. With the recent advances in technology, researchers can now collect enormous amounts of data from the brain using neuroimaging at different scales and from numerous modalities. With that comes the need for sophisticated tools for analysis. The field of network neuroscience has been trying to tackle these challenges, and graph theory has been one of its essential branches through the investigation of brain networks. Recently, topological data analysis has gained more attention as an alternative framework by providing a set of metrics that go beyond pairwise connections and offer improved robustness against noise. In this hands-on tutorial, our goal is to provide the computational tools to explore neuroimaging data using these frameworks and to facilitate their accessibility, data visualisation, and comprehension for newcomers to the field. We will start by giving a concise (and by no means complete) overview of the field to introduce the two frameworks and then explain how to compute both well-established and newer metrics on resting-state functional magnetic resonance imaging. We use an open-source language (Python) and provide an accompanying publicly available Jupyter Notebook that uses the 1000 Functional Connectomes Project dataset. Moreover, we would like to highlight one part of our notebook dedicated to the realistic visualisation of high order interactions in brain networks. This pipeline provides three-dimensional (3-D) plots of pairwise and higher-order interactions projected in a brain atlas, a new feature tailor-made for network neuroscience.

Keywords: Brain networks; Graph theory; Network analysis; Neuroscience; Python; Topological data analysis.


Conflict of interest statement

Not applicable.

Figures

Fig. 1
Fig. 1
Types of networks. a A binary directed graph. b Binary, undirected graph. In binary graphs, the presence of a connection is signified by a 1 or 0 otherwise. c A representation of graph f as a network of brain areas. d A weighted, directed graph. f A weighted, undirected graph. In a weighted graph, the absolute strength of the connections is often represented by a number w, where 0w1. g A connectivity matrix of c and f. Source: Part of the image was obtained from smart.servier.com
Fig. 2
Fig. 2
Graph theoretical metrics. a A representation of a graph indicating centralities. Highest degree centrality indicates the vertex with the most connections. Highest betweenness centrality refers to the vertex with most short paths passing through it. Highest closeness centrality denotes the vertex that needs the least edges to reach all the other nodes. The highest eigenvector centrality is achieved by the vertex best connected to the rest of the network, considering the number of neighbours and how well connected they are. b Representation of modularity and clustering coefficient. The latter indicates the tendency for any two neighbours of a vertex to be directly connected to each other. c The shortest path between vertices a and b. d The minimum spanning tree is a subset of a graph’s edges, which does not contain cycles, and that has the lowest sum of distances
Fig. 3
Fig. 3
Topological data analysis. a Illustration of simplexes. b Representation of simplexes/cliques of different order being formed in the brain across the filtration process. c Barcode respective to panel b, representing the filtration across distances (i.e., the inverse of weights in a correlation matrix). Line A represents cycle A in B. β0,β1, and β3 indicate the homology groups. (β0= connected components, β1 = one-dimensional holes, β2 = 2-dimensional holes). d Circular projection of how the brain would be connected. e Persistence diagram (or Birth/Death plot) obtained from real rsfMRI brain data. In this plot, it is also possible to identify a phase transition between β1 and β2
Fig. 4
Fig. 4
Simplicial complex. An example of a simplicial complex composed of eight vertices (0-simplexes), 11 edges (1-simplexes), five triangles (2-simplexes), one tetrahedron (3-simplexes)
Fig. 5
Fig. 5
Simplex 3-D visualisation. Here we visualise the rising number of 3-cliques (triangles) in a functional brain network as we increase the edge density d (0.01, 0.015, 0.02, and 0.025, from a to d). For higher densities, we have a more significant number of 3-cliques compared to smaller densities. The vertex colour indicates the clique participation rank
Fig. 6
Fig. 6
Euler characteristic in convex polyhedra. Note that there are no cavities in their shapes for convex polyhedra, and the Euler characteristic is always equal to two
Fig. 7
Fig. 7
The Euler characteristic in polyhedra with cavities. The Euler characteristic of a cube with a cavity is equal to zero, just as the torus. This value drops to minus two if we have two cavities in the cube, just like a bitorus
Fig. 8
Fig. 8
Betti numbers and examples of each k-dimensional hole. β0 is the number of connected components or zero-dimensional holes. β1 is the number of one-dimensional holes (loops). β2 is the number of two-dimensional holes (voids). β3 is the number of 3-D holes. For β1, β2, β3 only the left figure of each pair represents the k-dimensional hole. In the right figure, a connection is added, and so the k-hole is lost: the right figure of each pair no longer represent a β hole. For β0 the number of connected components is the number of separate clusters we have in the figure; therefore, we should consider the figure as a whole (in the case represented here, we have four connected components)
Fig. 9
Fig. 9
Betti number and Euler characteristic approximation. We create a random network for each probability of connection between vertices, and we compute the β and the absolute value of the Euler characteristic. We repeated the experiment 10 times and calculated the mean curves with errors. This plot only shows the mean (with errors) of the ten experiments for the Euler and Betti curves. We notice that the absolute value of the Euler characteristic is a good approximation of β
Fig. 10
Fig. 10
Curvature 3-D plot. Distribution of curvatures in a functional brain network for densities 0.01 (a) and 0.03 (b) after the first topological phase transition. The sum of curvature over all vertices is equal to the Euler characteristic

References

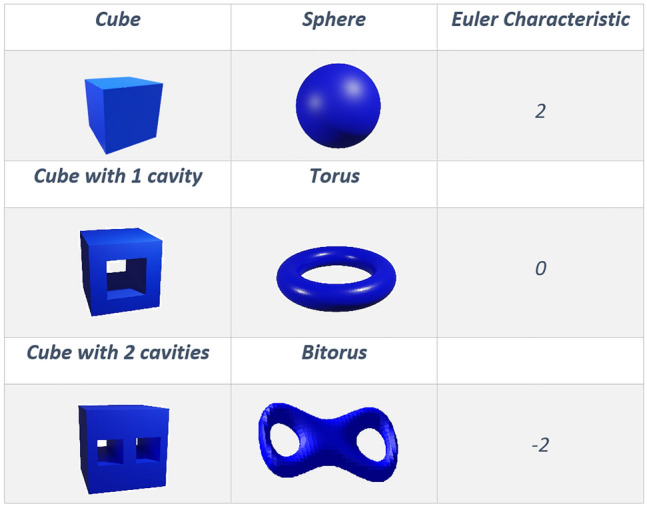
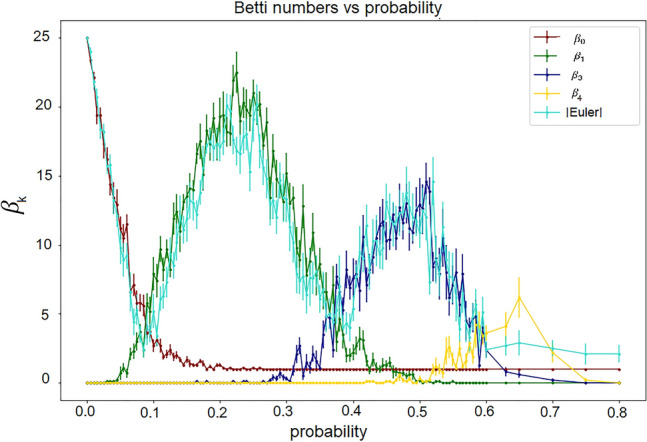
    1. Amorim E, Moreira RA, Santos FAN. The Euler characteristic and topological phase transitions in complex systems. BioRxiv. 2019 doi: 10.1101/871632. - DOI
    1. Anderson KL, Anderson JS, Palande S, Wang B. Topological data analysis of functional MRI connectivity in time and space domains. In: Wu G, Rekik I, Schirmer MD, Chung AW, Munsell B, editors. International workshop on connectomics in neuroimaging, Granada, Spain. Connectomics in neuroimaging. Cham: Springer; 2018. pp. 67–77. - PMC - PubMed
    1. Bakker R, Tiesinga P, Kötter R. The scalable brain atlas: instant web-based access to public brain atlases and related content. Neuroinformatics. 2015;13(3):353–366. doi: 10.1007/s12021-014-9258-x. - DOI - PMC - PubMed
    1. Barbarossa S, Sardellitti S. Topological signal processing over simplicial complexes. IEEE Trans Signal Process. 2020;68:2992–3007. doi: 10.1109/TSP.2020.2981920. - DOI
    1. Bassett DS, Bullmore ET. Small-world brain networks revisited. Neuroscientist. 2017;23(5):499–516. doi: 10.1177/1073858416667720. - DOI - PMC - PubMed

MeSH terms

LinkOut - more resources