. 2022 Feb 11;375(6581):671-677.
doi: 10.1126/science.abg7292. Epub 2022 Feb 10.

Caloric restriction in humans reveals immunometabolic regulators of health span

Affiliations

Caloric restriction in humans reveals immunometabolic regulators of health span

O Spadaro et al. Science. .

Abstract

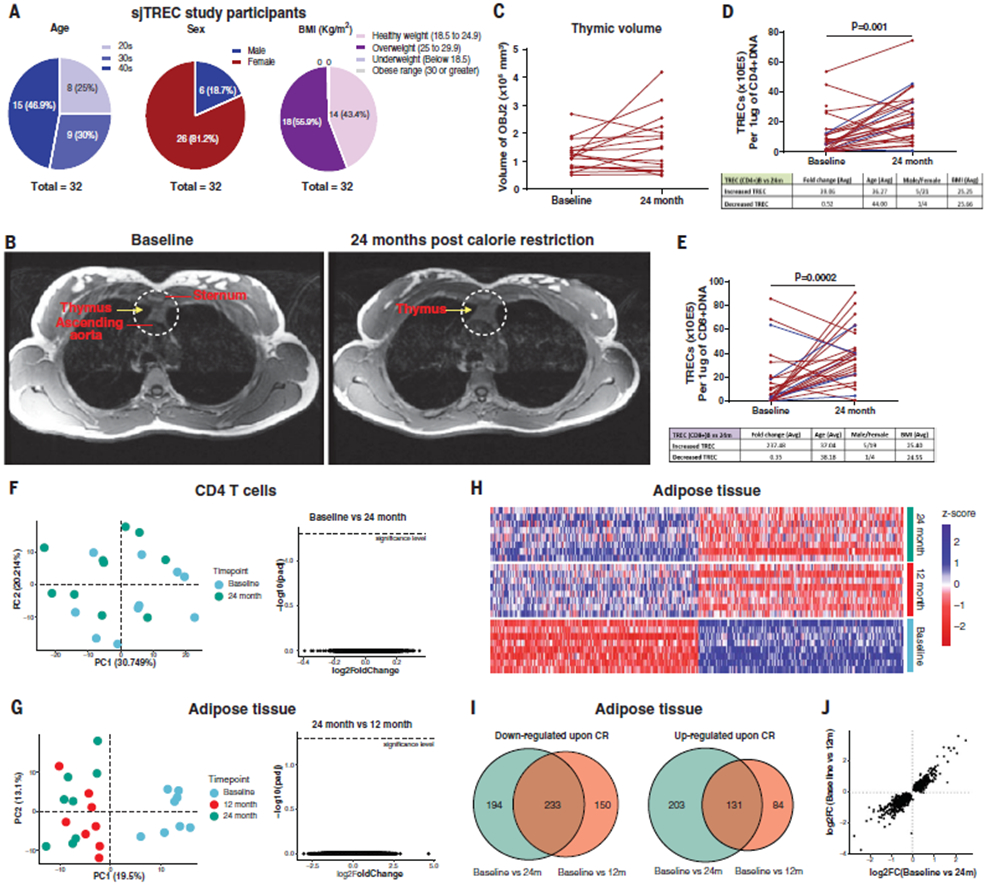
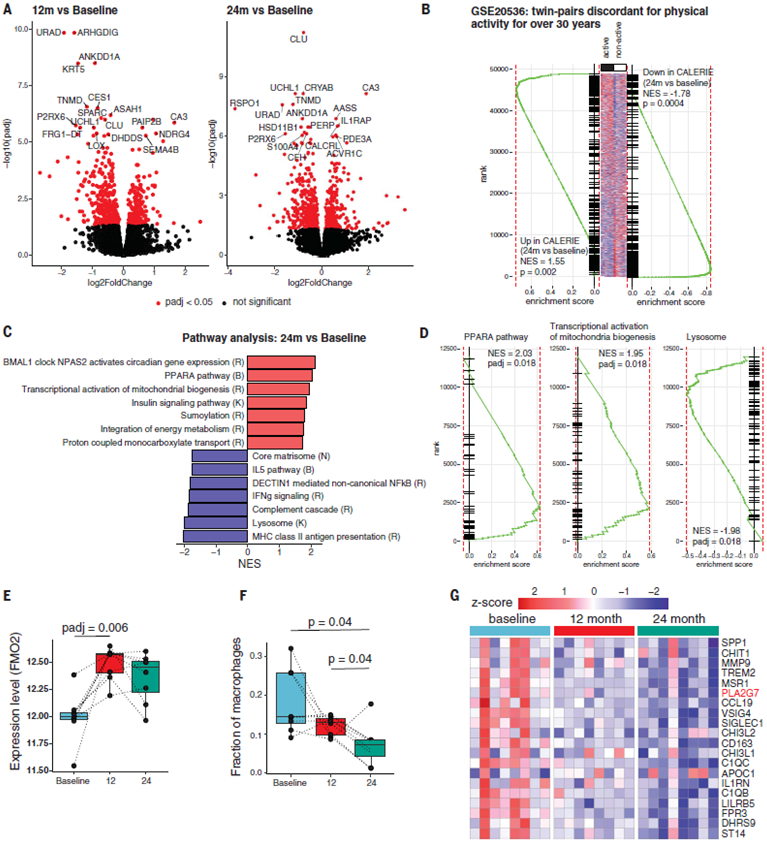
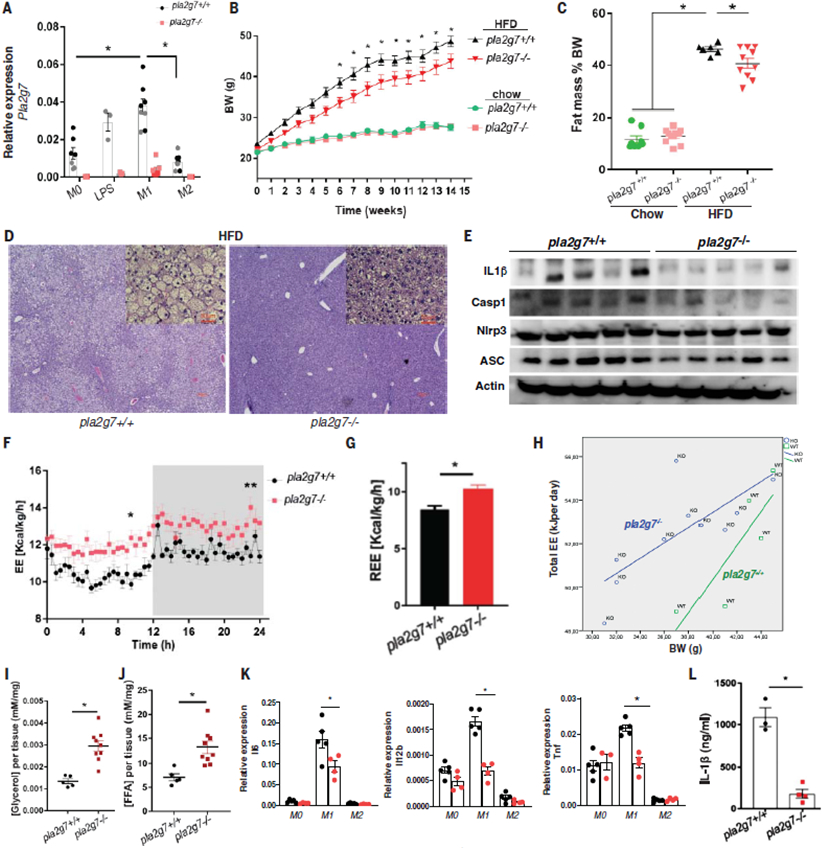
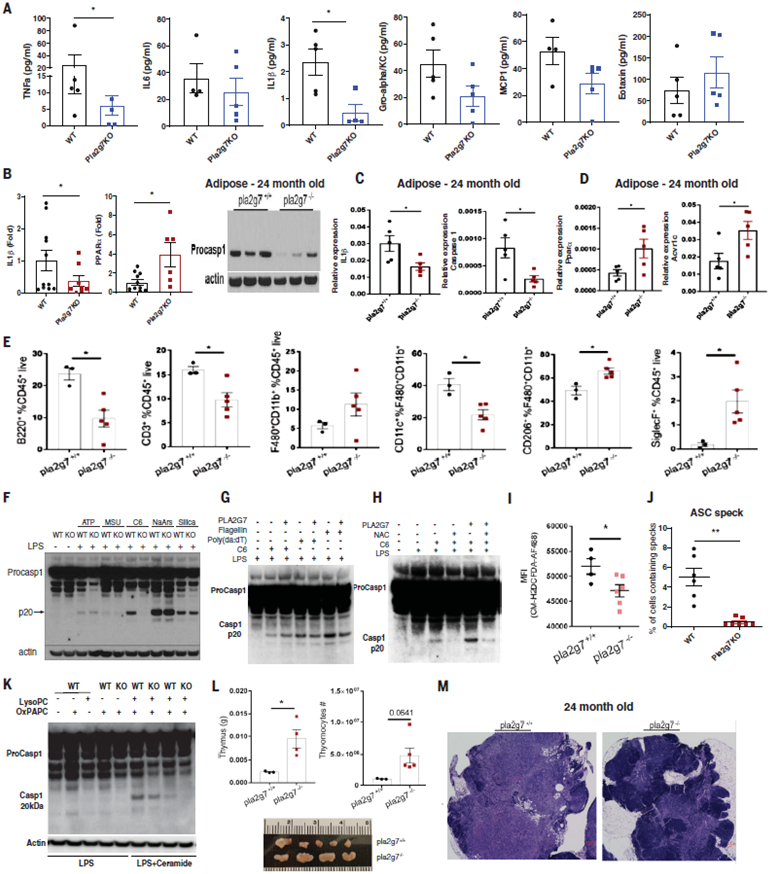
The extension of life span driven by 40% caloric restriction (CR) in rodents causes trade-offs in growth, reproduction, and immune defense that make it difficult to identify therapeutically relevant CR-mimetic targets. We report that about 14% CR for 2 years in healthy humans improved thymopoiesis and was correlated with mobilization of intrathymic ectopic lipid. CR-induced transcriptional reprogramming in adipose tissue implicated pathways regulating mitochondrial bioenergetics, anti-inflammatory responses, and longevity. Expression of the gene Pla2g7 encoding platelet activating factor acetyl hydrolase (PLA2G7) is inhibited in humans undergoing CR. Deletion of Pla2g7 in mice showed decreased thymic lipoatrophy, protection against age-related inflammation, lowered NLRP3 inflammasome activation, and improved metabolic health. Therefore, the reduction of PLA2G7 may mediate the immunometabolic effects of CR and could potentially be harnessed to lower inflammation and extend the health span.


Figures

Fig. 1.
Fig. 1.. CR in humans improves thymic function and remodels adipose transcriptome.
(A) Participant information for the sjTREC study (n = 32). (B) Representative MRI examination image of a female participant performed with the subject head first and supine in a 3 T full-body scanner at the baseline (left) and after 2 years of CR (right). The region of interest depicting the thymus is highlighted by yellow arrows in dotted circle after the fat saturation sequence was applied. (C) Thymic volume of female study participants analyzed by MRI at baseline and after 24 months of CR. (D and E) sjTREC analysis results of CD4 (D) and CD8 (E) T cells at baseline after 2 years of CR. Red line indicates TREC in females; blue line indicates TREC in males. (F), PCA of transcriptional profile of blood CD4 T cells at baseline and after 2 years of CR. Volcano plot depicts the results of differential gene expression analysis of CD4 T cells between baseline and after 2 years of CR. (G) PCA of RNA sequencing of adipose tissue at baseline and after 1 and 2 years of CR (n = 8). Volcano plot depicts the results of differential analysis of subcutaneous adipose tissue between 1 and 2 years of CR (right). Each dot represents a gene. (H) Heatmap of significant differentially expressed genes between baseline and either 1 or 2 years of CR in adipose tissue. (I) Venn diagram illustrating overlaps between genes found to be differential [false discovery rate (FDR), 5%] between baseline and either 1 or 2 years of CR. Overlapping area indicates the genes that are differentially expressed after both 1 and 2 years of CR. (J) Comparison of the log2-scaled fold change between baseline and 1 or 2 years of CR.
Fig. 2.
Fig. 2.. CR in humans reveals anti-aging immunometabolic checkpoints.
(A) Volcano plots depicting the results of differential gene expression analysis of adipose tissue. Each dot represents a gene. Top 18 significantly up- or down-regulated genes at 1 year (left) or 2 years (right) of CR compared with baseline (n =8). (B) Gene set enrichment analysis (GSEA) of genes up- and down-regulated after 2 years of CR in a signature describing differences between active and nonactive twins (GSE20536). (C) Selected pathways significantly (FDR, 5%) regulated by 2 years of CR based on GSEA. Red and blue bars indicate pathways up- and down-regulated by CR, respectively. Letters correspond to the source of pathway gene set. K, KEGG; R, Reactome; B, BioCarta. (D) Enrichment curves for selected significantly regulated pathways. y-axis denotes rank of the gene in list ordered by log2FC. (E) Changes in the expression level of FMO-2 after CR. Adjusted P values (padj) were calculated in the differential gene expression analysis. (F) Box plots showing estimated macrophage fractions after deconvolution of adipose transcriptome in adipose tissue at baseline and 1 and 2 years after CR. P values were calculated using the paired t test. (G) Expression of genes specific to adipose tissue–resident macrophages shown at baseline and 1 and 2 years after CR. NES corresponds to the normalized enrichment score.
Fig. 3.
Fig. 3.. Reduction of PLA2G7 serves as anti-adiposity CR mimic.
(A) Expression of Pla2g7 in nonpolarized (M0) (n = 7 and 7, respectively), LPS-treated (n = 3 and 3, respectively), M1-polarized (M1) (n = 8 and 7, respectively), and M2-polarized (M2) (n = 8 and 7, respectively) bone marrow–derived macrophages (BMDMs) generated from wild-type (WT) and PLA2G7-deficient mice. (B) Body weight change of WT and Pla2g7 KO mice provided with chow diet (n = 8 and 11, respectively) or HFD (n = 8 and 16, respectively) for 14 weeks. (C) Fat composition of WT and Pla2g7 KO mice (n = 8, 11, 6, and 10, respectively). (D) Representative images of livers from WT and Pla2g7 KO mice with H&E staining. Large images are 10×, small insets are 20×, and each scale bar indicates 50 mm. (E) Immunoblot analysis of inflammasome proteins (IL1B-p17, Caspase 1, NLRP3, and ASC) from livers in WT and Pla2g7-deficient mice fed with HFD. (F and G) Total daily energy expenditure (TDEE) (F) and resting energy expenditure (REE) (G) of pla2g7+/+ and pla2g7−/− mice fed with HFD (n = 6 and 10, respectively). (H) ANCOVA of body weight and EE of WT and Pla2g7 KO mice fed with HFD (n = 6 and 10, respectively). (I and J) Lipolysis assay of visceral adipose tissue from WT and Pla2g7 KO mice fed HFD to detect the release of glycerol (n = 5 and 9, respectively) (I) and free fatty acid (n = 5 and 9, respectively) (J). (K) Quantitative polymerase chain reaction (qPCR) showing the relative expression of the inflammatory genes Il-6, Il-12b, and Tnf to Gapdh in non-polarized (M0) (n = 5 and 4, respectively) and polarized (M1 and M2) BMDMs (n = 5 and 4, respectively) generated from WT and Pla2g7 KO mice. (L) Serum level of IL-1β in LPS-treated WT and Pla2g7 KO mice (12 months). Error bars represent the mean ± SEM. Statistical significance was calculated by a two-tailed unpaired Student’s t test [(G), (I), (J),and(L)] and two-way ANOVA and Holm-Sidak post hoc tests for multiple hypothesis [(A), (B),(C), and (K)]. *P <0.05; **P < 0.005; ***P < 0.001; ****P <0.0001.
Fig. 4.
Fig. 4.. Inhibition of PLA2G7 protects against inflammaging and thymic lipoatrophy
(A) Circulating proinflammatory cytokines (TNF-α, IL-6, IL-1b, Gro-alphaK/C, MCP-1, and Eotaxin) from serum in 24-month-old control and Pla2g7−/− mice (B) qPCR analysis of relative expression of Il-1b and Ppara compared with Gapdh in sorted F4/80+ cells from visceral adipose tissues in 24-month-old control and Pla2g7 KO mice and Caspase 1 protein expression in t he adipose tissue of 24-month-old control and Pla2g7−/− deficient mice (n = 3 and 3, respectively). (C and D) qPCR analysis of the proinflammatory genes Il-1b and Casp1 in the visceral adipose tissue of control and Pla2g7 KO mice. (C and D) The CR-regulated fatty acid oxidation inducers Ppara and Acvr1c in subcutaneous adipose tissue (SAT) of 24-month-old control (C) and Pla2g7 KO mice (n = 5, 5) (D). (E) FACS analysis of proportions of different immune cell populations in the adipose tissue of 24-month-old WT and Pla2g7 KO mice. (F) Representative immunoblot analysis of inflammasome activated by multiple NLRP3 activators in LPS-primed BMDMs from WT and Pla2g7-deficient mice. Inactive caspase-1 (48 kDa), enzymatically active caspase-1 (P20, 20kDa). (G) Western blot analysis of caspase-1 in BMDMs treated with recombinant PLA2G7 (1 mμ/ml) in the presence of flagellin and poly(dA:dT) to activate the NLRC4 and AIM2 inflammasomes. (H) Inflammasome activation measured by caspase-1 Western blot of BMDMs activated with LPS and ceramide and treated in the presence of recombinant PLA2G7 and N-acetyl-cysteine (NAC) (representative of three experiments). (I) Mean fluorescence intensity (MFI) depicting mitochondrial ROS after ceramide-induced NLRP3 inflammasome activation of control and Pla2g7-deficient BMDMs. (n = 4 and 6, respectively). (J) Quantification of ASC speck formation in BMDMs from WT and Pla2G7 mice activated by LPS and ceramide. (K) Caspase 1 expression from BMDM from control and Pla2g7-deficient mice activated by LPS and ceramide in the presence of OxPAPC and LysoPC. (L) Characterization of thymic involution of 24-month-old control WT and Pla2g7 KO mice. Shown are thymus weight (top left)(n = 5), cellularity (top right) (n = 5), and thymic size (bottom) (n =5,4). (M) H&E staining of representative thymi from 24-month-old control mice showing ectopic adipocytes and loss of corticomedullary junction in control mice and preservation of cellularity in Pla2g7 KO mice. Error bars represent the mean ± SEM. Two-tailed unpaired t tests were performed for statistical analysis. *P <0.05.

Comment in

References

    1. Anderson RM, Le Couteur DG, de Cabo R, Gerontol J. A Biol. Sci. Med. Sci 73,1–3 (2017). - PMC - PubMed
    1. Kristan DM, Aging Cell 6, 817–825 (2007). - PubMed
    1. Gardner EM, Gerontol J.ABiol.Sci.Med.Sci 60,688–694 (2005). - PubMed
    1. Sun D, Muthukumar AR, Lawrence RA, Fernandes G, Clin. Diagn. Lab. Immunol 8, 1003–1011 (2001). - PMC - PubMed
    1. Kirkwood TL, Kapahi P, Shanley DP, Anat J. 197, 587–590 (2000). - PMC - PubMed

Publication types

MeSH terms

Substances