. 2022 Feb 10;17(2):e0263328.
doi: 10.1371/journal.pone.0263328. eCollection 2022.

Poor neutralization and rapid decay of antibodies to SARS-CoV-2 variants in vaccinated dialysis patients

Affiliations

Poor neutralization and rapid decay of antibodies to SARS-CoV-2 variants in vaccinated dialysis patients

Jessica Bassi et al. PLoS One. .

Abstract

Patients on dialysis are at risk of severe course of SARS-CoV-2 infection. Understanding the neutralizing activity and coverage of SARS-CoV-2 variants of vaccine-elicited antibodies is required to guide prophylactic and therapeutic COVID-19 interventions in this frail population. By analyzing plasma samples from 130 hemodialysis and 13 peritoneal dialysis patients after two doses of BNT162b2 or mRNA-1273 vaccines, we found that 35% of the patients had low-level or undetectable IgG antibodies to SARS-CoV-2 Spike (S). Neutralizing antibodies against the vaccine-matched SARS-CoV-2 and Delta variant were low or undetectable in 49% and 77% of patients, respectively, and were further reduced against other emerging variants. The fraction of non-responding patients was higher in SARS-CoV-2-naïve hemodialysis patients immunized with BNT162b2 (66%) than those immunized with mRNA-1273 (23%). The reduced neutralizing activity correlated with low antibody avidity. Patients followed up to 7 months after vaccination showed a rapid decay of the antibody response with an average 21- and 10-fold reduction of neutralizing antibodies to vaccine-matched SARS-CoV-2 and Delta variant, which increased the fraction of non-responders to 84% and 90%, respectively. These data indicate that dialysis patients should be prioritized for additional vaccination boosts. Nevertheless, their antibody response to SARS-CoV-2 must be continuously monitored to adopt the best prophylactic and therapeutic strategy.


Conflict of interest statement

I have read the journal’s policy and the authors of this manuscript have the following competing interests: J.B., C.S.-F., F.M., C.S., M.Me., E.A.D.J., N.C., E.C., D.C. A.L., and L.Pi. are employees of Vir Biotechnology Inc. and may hold shares in Vir Biotechnology Inc. R.K.G. has received consulting fees from Johnson and Johnson and GlaxoSmithKline for educational activities. The other authors declare no competing interests. This does not alter our adherence to PLOS ONE policies on sharing data and materials.

Figures

Fig 1
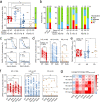
Fig 1. Comparison of mRNA vaccine-induced plasma antibody titers against SARS-CoV-2 between healthy controls and dialysis patients.
a) Plasma IgG titers (ED50) to SARS-CoV-2 S after two doses of Pfizer/BioNTech (P/B) or Moderna (M) vaccines in previously infected (square) and naïve (circle) healthy controls (HC, red), hemodialysis (HD, blue) and peritoneal dialysis (PD, orange) patients. Grey areas indicate non-specific IgG titers <50, a cut-off that was determined on non-specific binding to uncoated ELISA plates. An additional cut-off of 1’000, determined from the lowest titers in HC after two doses, was used to distinguish low (50–1’000) from high (>1’000) IgG titers. Statistical significance is set as P<0.05 and P-values are indicated with asterisks (* = 0.033; ** = 0.002; ***<0.001). b) Percentages of participants with high, low or no plasma SARS-CoV-2 S-specific IgG after two doses of mRNA-vaccine. Total number of participants within each cohort of HC and dialysis patients (DP) and within each subgroup is shown at the top of each bar. c) Kinetics of plasma IgG titers to SARS-CoV-2 S measured before vaccination (T0), after one (T1) or two (T2) vaccine doses. Each line connects samples from the same individual. White squares indicate HD patients who were not yet infected at T0 sampling. d) Correlation analysis between plasma IgG titers to SARS-CoV-2 S and RBD in all the plasma samples collected after the second vaccine dose. e) Plasma IgM titers to SARS-CoV-2 S after two vaccine doses in HC, HD and PD patients. Grey areas indicate non-specific IgM titers <50. f) Plasma IgA titers to SARS-CoV-2 S after two vaccine doses in HC, HD and PD patients. Grey areas indicate non-specific IgA titers <50. g) Correlation analysis between plasma IgG and IgA titers to SARS-CoV-2 S in all the plasma samples collected after the second vaccine dose.
Fig 2
Fig 2. Analysis of neutralizing activity of plasma antibodies against wild-type SARS-CoV-2, Delta and other variants.
a) Neutralizing antibody titers (ID50, 50% of inhibitory dilution) against pseudotyped VSV viruses harboring wild-type (D614) SARS-CoV-2 S determined using plasma from previously infected (square) and naïve (circle) healthy controls (HC), hemodialysis (HD) and peritoneal dialysis (PD) patients after two doses of Pfizer/BioNTech (P/B) or Moderna (M) vaccines. Grey areas indicate non-neutralizing titers (<50). A cut-off of 200, determined from the lowest neutralizing titers in HC, and a cut-off of 1’000, determined from the 25% percentile of titers in previously infected HC cohort, were used to distinguish low (50–200) from moderate (200–1’000) or high (>1’000) neutralizing titers. Statistical significance is set as P<0.05 and P-values are indicated with asterisks (* = 0.033; ** = 0.002; ***<0.001). Shown are data from n = 2 independent experiments. b) Percentages of participants with high, moderate, low or no plasma neutralizing antibodies to WT SARS-CoV-2 S after two doses of mRNA vaccine. Total number of participants within each cohort of HC and dialysis patients (DP) and within each subgroup is shown at the top of each bar. c) Neutralization of WT (black) and Delta (B.1.617.2, blue) SARS-CoV-2 pseudotyped VSV by four representative plasma samples showing high, moderate, low or no neutralization to WT SARS-CoV-2. d-e) Side-by-side comparison (d) and fold change analysis (e) of neutralizing titers against WT and Delta SARS-CoV-2 in 48 HC, 130 HD and 13 PD patients. Fold change is calculated as the ratio of ID50 value of WT and ID50 value of Delta variant. Shown are data from n = 2 independent experiments. f) Side-by-side comparison of neutralizing titers against WT and Alpha (B.1.1.7), Beta (B.1.351), Gamma (P.1), Epsilon (B.1.429) and Kappa (B.1.617.1) SARS-CoV-2 variants in 28 HC, 47 HD and 5 PD patients. g) Fold change analysis of neutralizing titers against different variants. Numbers in each cell of panel g indicate the average fold change values of WT ID50 to variant ID50 in all the cohorts analyzed including only participants with ID50 neutralizing titers against WT SARS-CoV-2 greater than 80. Shown are data from n = 2 independent experiments.
Fig 3
Fig 3. Role of avidity of plasma antibodies in the neutralization of wild-type SARS-CoV-2 and Delta variant.
a) Avidity index of plasma antibodies to WT SARS-CoV-2 S in previously infected (square) and naïve (circle) healthy controls (HC), hemodialysis (HD) and peritoneal dialysis (PD) patients after two doses of mRNA vaccine. Grey areas indicate no avidity measured of plasma antibodies with ED50 titers lower than 50. A cut-off of 23%, determined from the lowest avidity index in naïve HC, and a cut-off of 50%, determined from the lowest avidity index in previously infected HC cohort, were used to distinguish low (0–23%) from moderate (23–50%) or high (>50%) avidity. Statistical significance is set as P<0.05 and P-values are indicated with asterisks (* = 0.033; ** = 0.002; ***<0.001). Shown are data from n = 2 independent experiments. b) Correlation analysis between plasma IgG avidity index to WT SARS-CoV-2 S and neutralization of WT SARS-CoV-2 in all the plasma samples collected after the second vaccine dose. c) Percentages of participants having plasma antibodies with high, moderate, low or no avidity to WT SARS-CoV-2 S after two doses of mRNA vaccine. Participants are shown as a total (bold) or divided by level of neutralization of WT SARS-CoV-2 (no, low, moderate, high). Total number of participants within each group is shown at the top of each bar. d) Percentages of participants having plasma antibodies with high, moderate, low or no neutralization of Delta SARS-CoV-2 after two doses of mRNA vaccine. Participants are shown as a total (bold) or divided by level of avidity to WT SARS-CoV-2 S (no, low, moderate, high). Total number of participants within each group is shown at the top of each bar.
Fig 4
Fig 4. Follow-up analysis of SARS-CoV-2 S IgG, neutralizing titers and avidity index.
a) Plasma IgG titers (ED50) to SARS-CoV-2 S after two doses of Pfizer/BioNTech (P/B, red, light blue and light orange) or Moderna (M, dark blue and dark orange) vaccines in samples collected from previously infected (square) and naïve (circle) healthy controls (HC, red), hemodialysis (HD, blue) and peritoneal dialysis (PD, orange) patients 2 weeks and up to 7 months (indicated mean 5 months) after vaccination. Cut-offs are shown as explained in Fig 1. Statistical significance is set as P<0.05 and P-values are indicated with asterisks (* = 0.033; ** = 0.002; ***<0.001). b) Avidity index of plasma antibodies to WT SARS-CoV-2 S. Cut-offs are shown as explained in Fig 3C and 3D) Neutralizing antibody titers (ID50) against pseudotyped VSV viruses harboring wild-type (D614) SARS-CoV-2 S (c) or Delta variant (d). Cut-offs are shown as explained in Fig 2.

References

    1. Zoccali C, Vanholder R, Massy ZA, Ortiz A, Sarafidis P, Dekker FW, et al. The systemic nature of CKD. Nat Rev Nephrol. 2017;13(6):344–58. Epub 2017/04/25. doi: 10.1038/nrneph.2017.52 . - DOI - PubMed
    1. Dalrymple LS, Go AS. Epidemiology of acute infections among patients with chronic kidney disease. Clin J Am Soc Nephrol. 2008;3(5):1487–93. Epub 2008/07/25. doi: 10.2215/CJN.01290308 ; PubMed Central PMCID: PMC4571152. - DOI - PMC - PubMed
    1. Henry BM, Lippi G. Chronic kidney disease is associated with severe coronavirus disease 2019 (COVID-19) infection. Int Urol Nephrol. 2020;52(6):1193–4. Epub 2020/03/31. doi: 10.1007/s11255-020-02451-9 ; PubMed Central PMCID: PMC7103107. - DOI - PMC - PubMed
    1. Cippa PE, Cugnata F, Ferrari P, Brombin C, Ruinelli L, Bianchi G, et al. A data-driven approach to identify risk profiles and protective drugs in COVID-19. Proc Natl Acad Sci U S A. 2021;118(1). Epub 2020/12/12. doi: 10.1073/pnas.2016877118 ; PubMed Central PMCID: PMC7817222. - DOI - PMC - PubMed
    1. Anand S, Montez-Rath M, Han J, Bozeman J, Kerschmann R, Beyer P, et al. Prevalence of SARS-CoV-2 antibodies in a large nationwide sample of patients on dialysis in the USA: a cross-sectional study. Lancet. 2020;396(10259):1335–44. Epub 20200925. doi: 10.1016/S0140-6736(20)32009-2 ; PubMed Central PMCID: PMC7518804. - DOI - PMC - PubMed

Publication types

Supplementary concepts