. 2022 Feb 3;39(2):msac035.
doi: 10.1093/molbev/msac035.

Comparative Genomics Elucidates the Origin of a Supergene Controlling Floral Heteromorphism

Affiliations

Comparative Genomics Elucidates the Origin of a Supergene Controlling Floral Heteromorphism

Giacomo Potente et al. Mol Biol Evol. .

Abstract

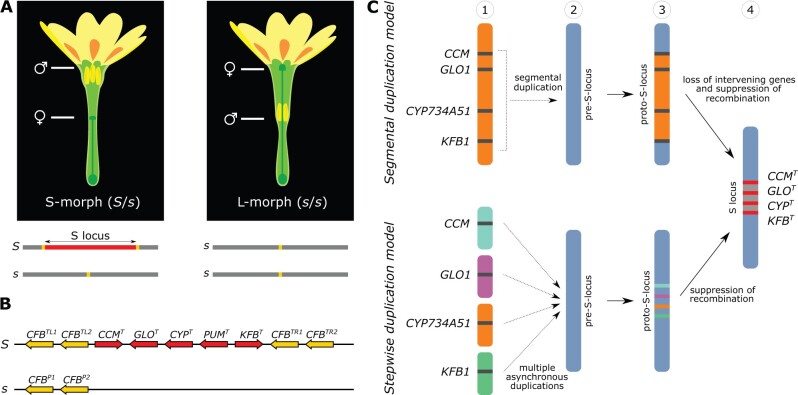
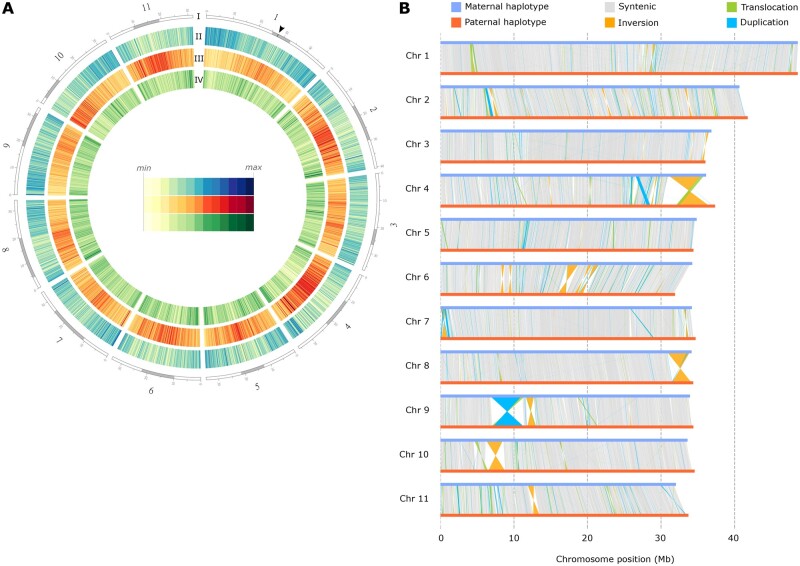
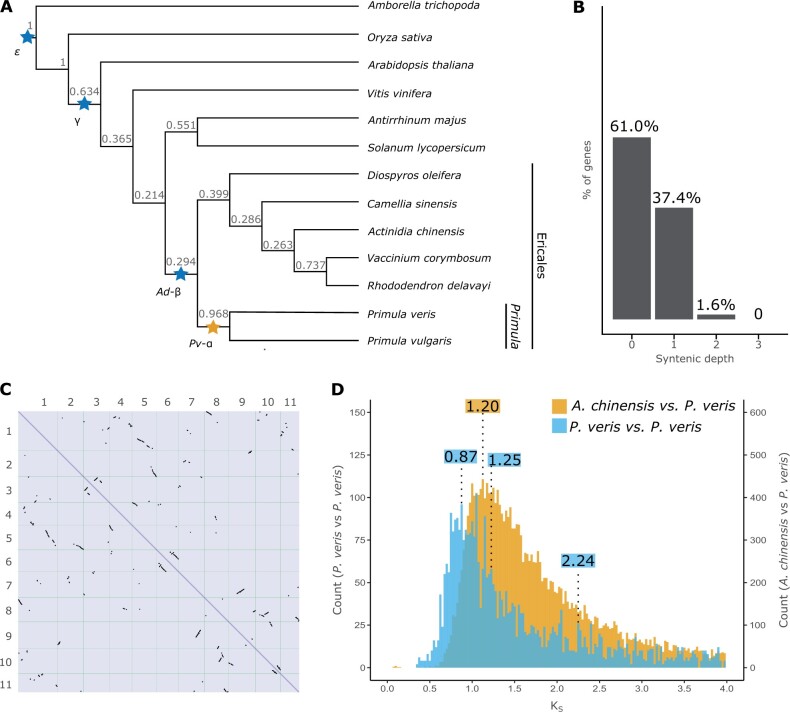
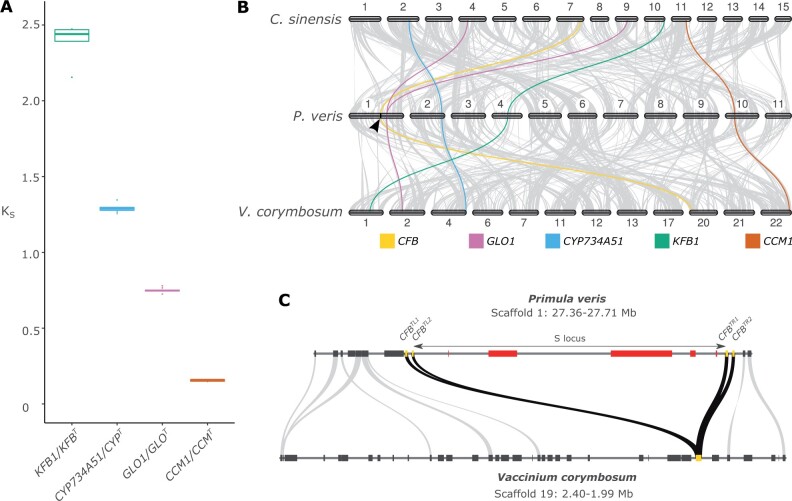
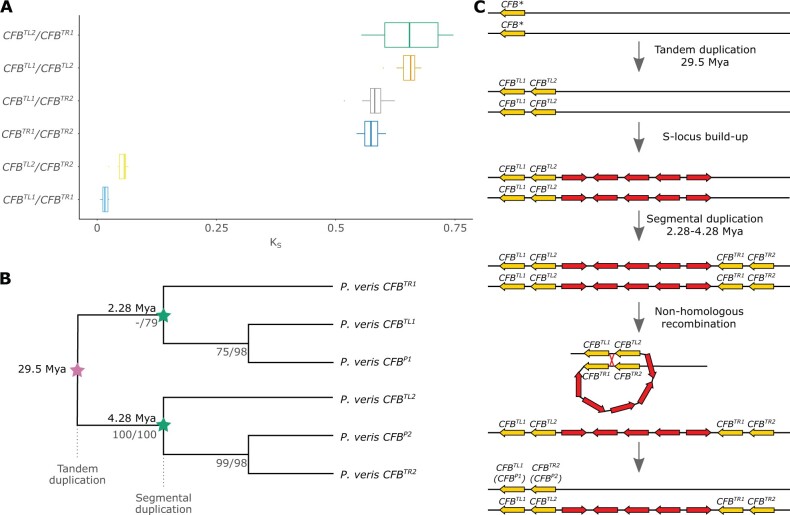
Supergenes are nonrecombining genomic regions ensuring the coinheritance of multiple, coadapted genes. Despite the importance of supergenes in adaptation, little is known on how they originate. A classic example of supergene is the S locus controlling heterostyly, a floral heteromorphism occurring in 28 angiosperm families. In Primula, heterostyly is characterized by the cooccurrence of two complementary, self-incompatible floral morphs and is controlled by five genes clustered in the hemizygous, ca. 300-kb S locus. Here, we present the first chromosome-scale genome assembly of any heterostylous species, that of Primula veris (cowslip). By leveraging the high contiguity of the P. veris assembly and comparative genomic analyses, we demonstrated that the S-locus evolved via multiple, asynchronous gene duplications and independent gene translocations. Furthermore, we discovered a new whole-genome duplication in Ericales that is specific to the Primula lineage. We also propose a mechanism for the origin of S-locus hemizygosity via nonhomologous recombination involving the newly discovered two pairs of CFB genes flanking the S locus. Finally, we detected only weak signatures of degeneration in the S locus, as predicted for hemizygous supergenes. The present study provides a useful resource for future research addressing key questions on the evolution of supergenes in general and the S locus in particular: How do supergenes arise? What is the role of genome architecture in the evolution of complex adaptations? Is the molecular architecture of heterostyly supergenes across angiosperms similar to that of Primula?

Keywords: chromosome-scale genome assembly; evolutionary genomics; genome architecture; heterostyly; primula; supergene.


Figures

Fig. 1.
Fig. 1.
Heterostyly in P. veris and models for the origin of the S locus. (A) Top: short-styled (S) and long-styled (L) morphs differ by having male (anthers) and female (stigma) sexual organs reciprocally positioned in their flowers. Bottom: The S locus (red) is hemizygous in S-morphs (S haplotype), absent in L-morphs (s haplotype); the location of CFB genes is indicated in yellow. (B) Structure of the S locus in the S-morph, with gene orientations indicated by pointed ends. Top: dominant S haplotype containing five genes (red) and two copies of CFB in each flanking region (yellow); bottom: recessive s haplotype with only two copies of CFB. Superscripts on genes stand for: T, thrum (S-morph); P, pin (L-morph); L, left; R, right; 1, gene copy 1; 2, gene copy 2. (C) Two models for the origin of the S locus involving its four duplicated genes. Segmental duplication model (top): the paralogs of S-locus genes were originally clustered (1), then duplicated as a single segment and inserted into a different genomic region, here called pre-S-locus region (blue) (2), forming a proto-S-locus (yellow) (3); intervening genes were then lost and recombination suppressed, forming the S locus (4). Stepwise duplication model (bottom): the paralogs of S-locus genes were originally unlinked (1), duplicated asynchronously and independently inserted into the pre-S-locus (blue) (2), forming the proto-S-locus (3; different colors indicate that the paralogs derived from different genomic locations); recombination among these genes was then suppressed, forming the S locus (4).
Fig. 2.
Fig. 2.
Overview of the P. veris genome and comparison between haplotypes. (A) Circle plot of the P. veris genome assembly (maternal haplotype). Tracks from outside to inside correspond to: (I) the 11 chromosome-scale scaffolds, with the putative centromeric and putative pericentromeric regions shown in gray; position of the S locus is marked by a black arrow in chromosome 1; (II) gene density (blue); (III) LTR retrotransposons (red); (IV) DNA transposons (green). Tracks II, III, and IV are calculated in 100-kb nonoverlapping windows. (B) Structural rearrangements are represented by colored lines (orange for inversions, green for translocations, blue for duplications) connecting regions of the maternal and paternal chromosomes (blue and red horizontal lines, respectively); syntenic regions are connected by gray lines.
Fig. 3.
Fig. 3.
Evidence of a WGD in the Primula lineage. (A) Phylogeny of 13 angiosperm species inferred by OrthoFinder using the STAG algorithm and rooted using STRIDE; numbers at each node represent STAG support values, that is, the fraction of orthogroup trees supporting each bipartition (see Materials and Methods for details); WDGs inferred in previous studies are marked by blue stars; the yellow star represents a WGD newly demonstrated here. (B) Proportion of genes with different syntenic depths in the P. veris genome. (C) Dotplot obtained by aligning the P. veris maternal haplotype against itself; self-syntenic (i.e., duplicated) regions containing >5 collinear genes are represented by black marks. (D) Density distribution of KS in paralogous gene pairs within P. veris (blue) and in orthologous gene pairs between P. veris and A. chinensis (yellow), representing the sister clade of Primula; to ease visualization, the columns of the blue histogram were increased four times in height. The three statistically significant peaks in the blue distribution and the peak representing the divergence between P. veris and A. chinensis are marked with the respective KS values (in blue and yellow, respectively).
Fig. 4.
Fig. 4.
The S locus originated in a stepwise manner. (A) Boxplot of KS distributions between each duplicated S-locus gene and its closest paralog calculated in 11 S-morph individuals of P. veris. (B) Synteny plot between C. sinensis, P. veris, and V. corymbosum. Regions containing >5 collinear genes are connected with gray lines, whereas the paralogs of S-locus genes in the three species are connected with color lines: GLO1 (pink), CYP734A51 (blue), KFB1 (green), CCM1 (orange), plus the flanking CFB (yellow). The S locus is marked by a black arrow on the P. veris chromosome 1. (C) Microsynteny plot between the region containing the S locus in P. veris and its collinear region in V. corymbosum: S-locus genes are represented as red boxes; CFB genes are represented as yellow boxes; genes outside the S locus are represented as gray boxes. Gray lines connect orthologous gene pairs; black lines connect the four CFB copies in P. veris with their orthologs in V. corymbosum.
Fig. 5.
Fig. 5.
The hemizygosity of the S locus originated via non-homologous recombination between CFB copies. (A) Boxplot of KS values distributions for all six pairwise comparisons of the four CFB copies in the P. veris S haplotype. (B) Gene tree topology of CFB sequences from P. veris (S and s haplotypes), representing a subset of the larger CFB phylogeny of supplementary figure S28, Supplementary Material online; branch labels represent ML/parsimony bootstrap support values, inferred with RAxML and PAUP, respectively (see supplementary methods, Supplementary Material online for details). CFB underwent two duplication rounds: a tandem duplication 29.5 Ma (pink star), then a segmental duplication 2.28–4.28 Ma (green stars). (C) Schematic model for the origin of hemizygosity of the P. veris S locus via nonhomologous recombination reflecting the inferred temporal sequence of the CFB tandem and segmental duplications; the ancestral copy of CFB prior to duplication is indicated by an asterisk.

References

    1. Barrett SCH. 2002. The evolution of plant sexual diversity. Nat Rev Genet. 3(4):274–284. - PubMed
    1. Barrett SCH. 2019. ‘A most complex marriage arrangement’: recent advances on heterostyly and unresolved questions. New Phytol. 224(3):1051–1067. - PubMed
    1. Becher H, Jackson BC, Charlesworth B.. 2020. Patterns of genetic variability in genomic regions with low rates of recombination. Curr Biol. 30(1):94–100.e3. - PubMed
    1. Belton J-M, McCord RP, Gibcus JH, Naumova N, Zhan Y, Dekker J.. 2012. Hi-C: a comprehensive technique to capture the conformation of genomes. Methods 58(3):268–276. - PMC - PubMed
    1. Borodovsky M, Lomsadze A.. 2011. Eukaryotic gene prediction using GeneMark.hmm-E and GeneMark-ES. Curr Protoc Bioinforma. 35:4.6.1–4.6.10. - PMC - PubMed

Publication types