. 2022 May;15(5):1167-1186.
doi: 10.1111/cts.13235. Epub 2022 Feb 24.

Hepatoprotective effects of semaglutide, lanifibranor and dietary intervention in the GAN diet-induced obese and biopsy-confirmed mouse model of NASH

Affiliations

Hepatoprotective effects of semaglutide, lanifibranor and dietary intervention in the GAN diet-induced obese and biopsy-confirmed mouse model of NASH

Mathias B Møllerhøj et al. Clin Transl Sci. 2022 May.

Abstract

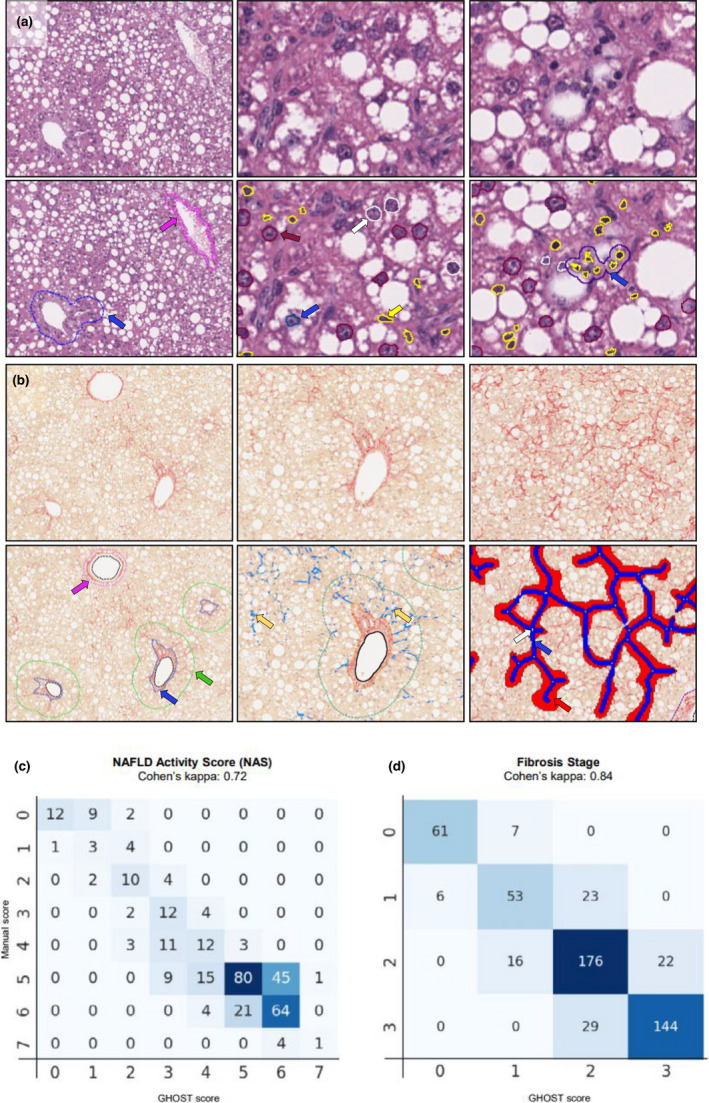
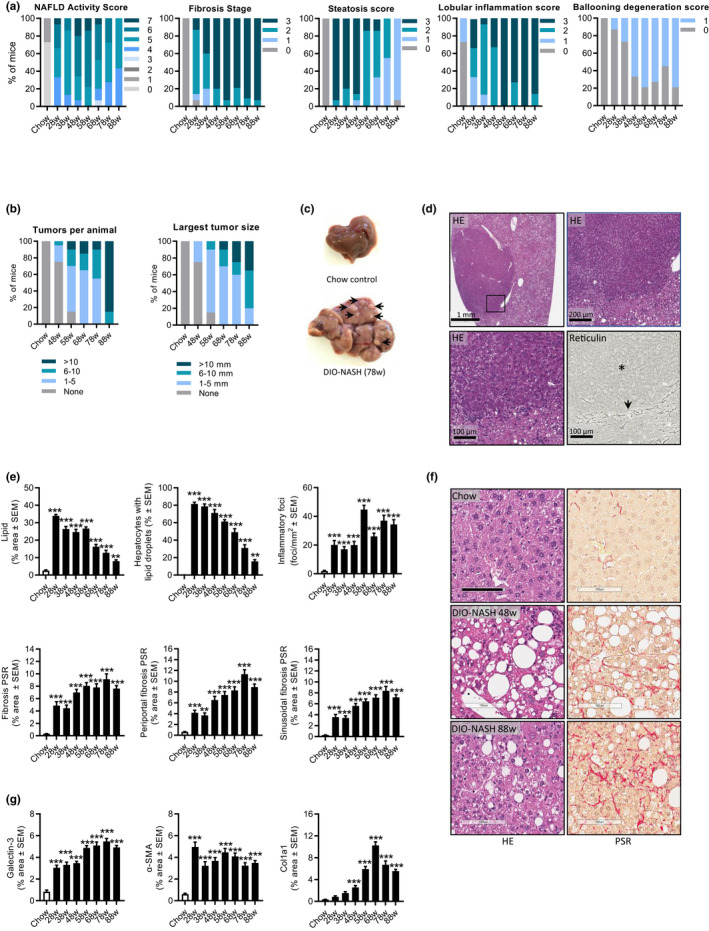
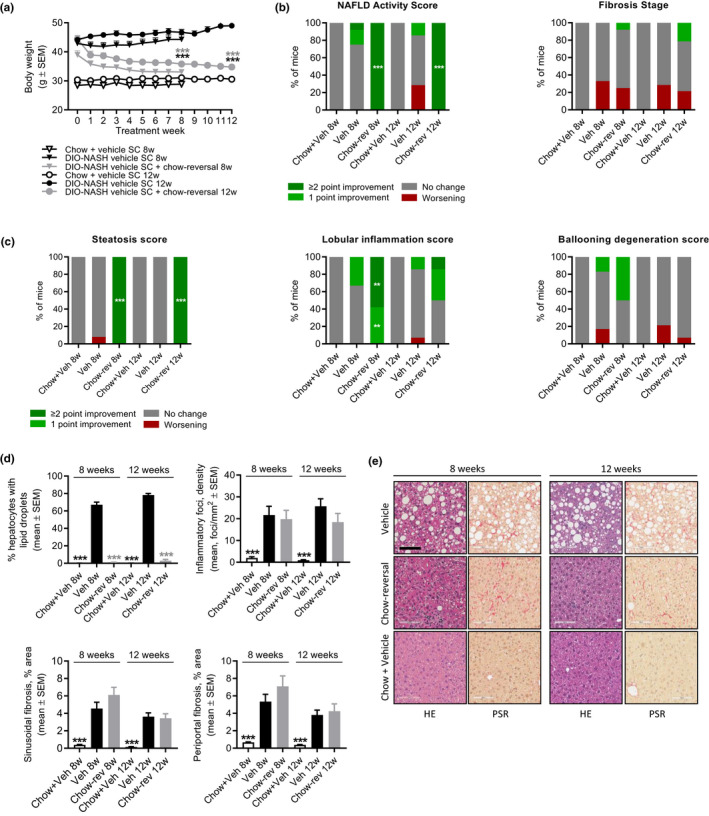
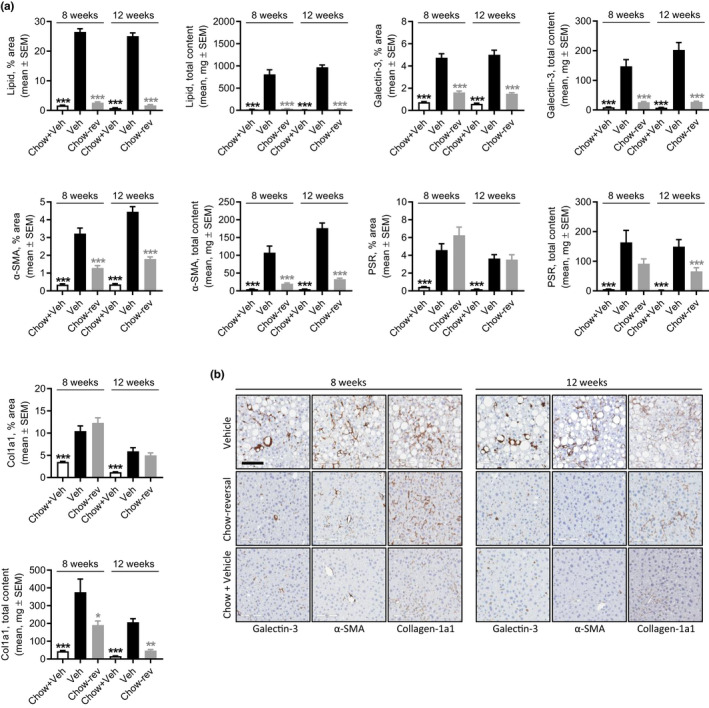
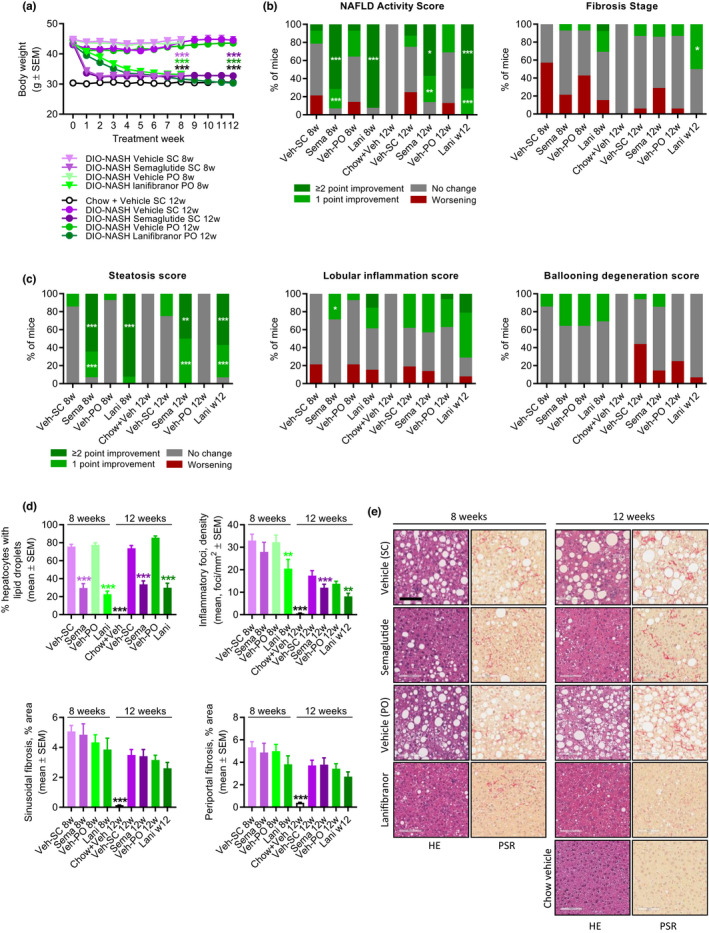
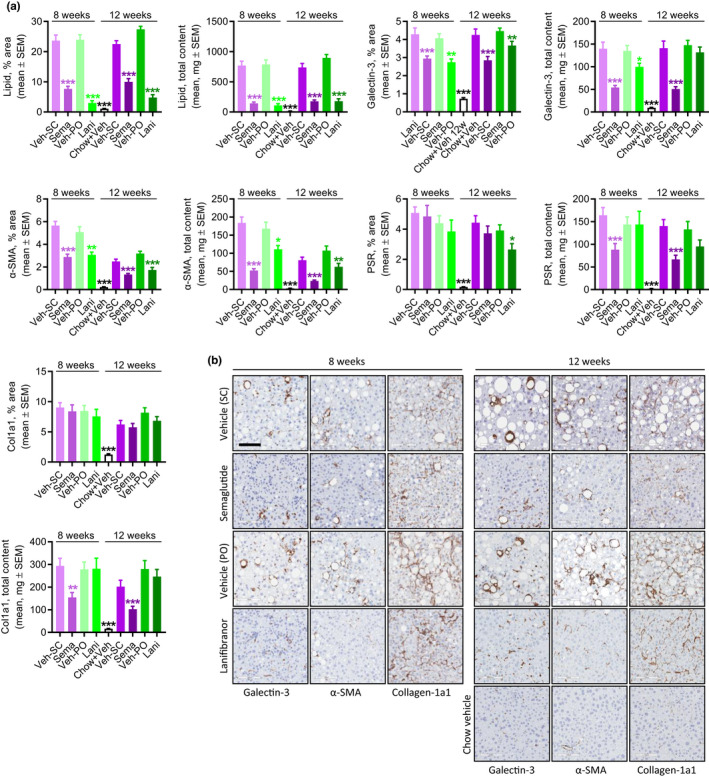
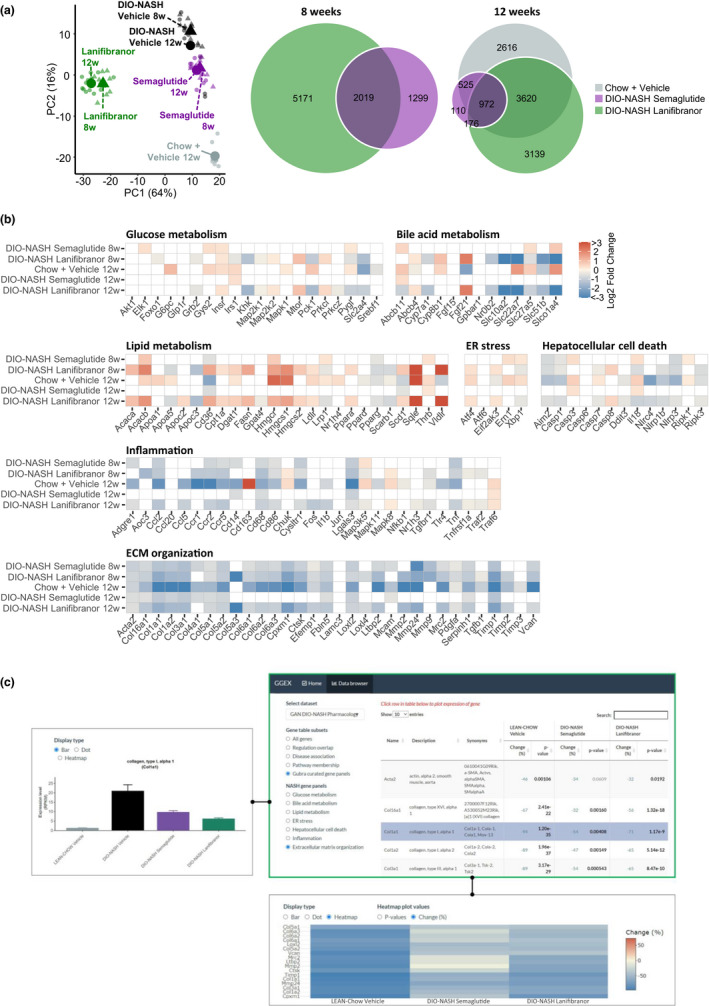
Non-alcoholic steatohepatitis (NASH) has emerged as a major challenge for public health because of high global prevalence and lack of evidence-based therapies. Most animal models of NASH lack sufficient validation regarding disease progression and pharmacological treatment. The Gubra-Amylin NASH (GAN) diet-induced obese (DIO) mouse demonstrate clinical translatability with respect to disease etiology and hallmarks of NASH. This study aimed to evaluate disease progression and responsiveness to clinically effective interventions in GAN DIO-NASH mice. Disease phenotyping was performed in male C57BL/6J mice fed the GAN diet high in fat, fructose, and cholesterol for 28-88 weeks. GAN DIO-NASH mice with biopsy-confirmed NASH and fibrosis received low-caloric dietary intervention, semaglutide (30 nmol/kg/day, s.c.) or lanifibranor (30 mg/kg/day, p.o.) for 8 and 12 weeks, respectively. Within-subject change in nonalcoholic fatty liver disease (NAFLD) Activity Score (NAS) and fibrosis stage was evaluated using automated deep learning-based image analysis. GAN DIO-NASH mice showed clear and reproducible progression in NASH, fibrosis stage, and tumor burden with high incidence of hepatocellular carcinoma. Consistent with clinical trial outcomes, semaglutide and lanifibranor improved NAS, whereas only lanifibranor induced regression in the fibrosis stage. Dietary intervention also demonstrated substantial benefits on metabolic outcomes and liver histology. Differential therapeutic efficacy of semaglutide, lanifibranor, and dietary intervention was supported by quantitative histology, RNA sequencing, and blood/liver biochemistry. In conclusion, the GAN DIO-NASH mouse model recapitulates various histological stages of NASH and faithfully reproduces histological efficacy profiles of compounds in advanced clinical development for NASH. Collectively, these features highlight the utility of GAN DIO-NASH mice in preclinical drug development.


Conflict of interest statement

M.B.M., K.T.T., D.O., A.O., C.G.S., M.R.M., M.F., and H.H.H. are employed by Gubra. S.S.V. was employed by Gubra and is presently employed by Novo Nordisk. L.P., E.S., and A.B. are employed by Boehringer Ingelheim Pharma GmbH & Co. KG. M.V. is employed by Aalborg University, Copenhagen, Denmark. N.V. and J.J. are owners of Gubra. This study was supported by Boehringer‐Ingelheim Pharma. No other potential conflicts of interest relevant to this article were reported.

Figures

FIGURE 1
FIGURE 1
Deep learning‐based assessment of NAFLD Activity Score (NAS) and fibrosis stage in GAN DIO‐NASH mice. (a) Steatosis, inflammation, and hepatocyte ballooning degeneration scores were evaluated on scanned hematoxylin‐eosin (HE) stained slides for annotation, scoring and histomorphometric analysis of histopathological hallmarks of NASH. Left panel: Deep learning‐based detection (GHOST application) of portal tract (blue arrow) and central vein (pink arrow) at 10× magnification. Middle panel: Detection of hepatocytes with lipid droplets (purple), hepatocytes without lipids (white), ballooning hepatocytes (blue), and inflammatory cells (yellow) at 20x magnification. Right panel: By post‐processing, inflammatory foci were defined as a cluster of >3 inflammatory cells (blue). (b) Fibrosis stage was evaluated on scanned PSR‐stained slides. Left panel: Deep learning‐based detection of portal tract (blue arrow) and central veins (pink arrow) at 10× magnification. The boundary of the periportal zone was defined as 100 µm from the portal tract (green). Middle panel: Detection of collagen fibers (yellow arrows) in the periportal and sinusoidal zones. Right panel: Detection of bridging fibrosis (blue color), bridging zones (red color) and branch points (white arrow). (c, d) Correlation of manual versus GHOST‐based assessment of NAS and fibrosis stage. DIO, diet‐induced obese; GAN, Gubra‐Amylin non‐alcoholic steatohepatitis (NASH) diet; GHOST, Gubra Histopathological Objective Scoring Technology; NAFLD, nonalcoholic fatty liver disease; PSR, picro‐Sirius Red.
FIGURE 2
FIGURE 2
GAN DIO‐NASH mice show progressive development of severe fibrosing NASH and hepatocellular carcinoma. Mice were fed the GAN diet for 28–88 weeks (n = 11–15 per group). (a) NAFLD Activity Score (NAS), fibrosis stage, steatosis score, lobular inflammation score, and ballooning degeneration score. (b) Total number of hepatic tumors and largest liver tumor size (diameter, mm) per animal. (c) Representative whole‐liver of chow‐fed control and GAN DIO‐NASH mouse (78 weeks of feeding), respectively. The latter showing multiple tumors (arrows). (d) Cytologic and architectural characteristics of liver neoplastic lesions in DIO‐NASH mice (≥58 weeks of GAN diet feeding). The tumor demonstrates increased hepatocyte nuclear/cytoplasmic ratio (condensed cytoplasm with normal or enlarged nuclei) and absent reticulin trabecular framework (asterisk), a morphological characteristic of HCC. The compression zone between neoplastic and normal liver parenchyma is indicated by an arrow. Representative photomicrophraphs of HE‐ and reticulin‐stained tumor sections. Insert in upper left panel (HE staining) is further magnified in upper right and lower left panel. (e) GHOST‐based histomorphometrics. Proportionate (%) area of lipids; hepatocytes with lipid droplets relative to total hepatocyte counts; number of inflammatory foci per mm2; percentage total sectional area of fibrosis¸ percentage area of periportal fibrosis; and percentage area of perisinusoidal fibrosis (picro‐Sirius Red [PSR]). (f) Representative photomicrographs of HE and PSR stainings illustrating the development of steatosis and perisinusoidal fibrosis in DIO‐NASH mice (scale bar, 100 µm). (g) Conventional histomorphometrics. Percentage area of galectin‐3; α‐SMA, and Col1a1. **< 0.01, ***< 0.001 (Dunnett’s test one‐factor linear model). There was a minor loss of mice related to increased aging and the extended high‐fat diet feeding periods applied. DIO, diet‐induced obese; GAN, Gubra‐Amylin non‐alcoholic steatohepatitis (NASH) diet; GHOST, Gubra Histopathological Objective Scoring Technology; HE, hematoxylin‐eosin; NAFLD, nonalcoholic fatty liver disease; PSR, picro‐Sirius Red.
FIGURE 3
FIGURE 3
Dietary intervention improves liver histopathological hallmarks in GAN DIO‐NASH mice. DIO‐NASH mice were administered vehicle (s.c., q.d.) with (Chow‐reversal [Chow‐rev]) or without (Vehicle [Veh]) dietary intervention. Dietary intervention was performed by switching from the GAN diet to chow for 8 or 12 weeks (n = 12–14 per group). Age‐matched vehicle‐dosed (s.c.) chow‐fed mice (Chow + Veh) served as normal controls (n = 10–15 per group). Histopathological scores and histomorphometric assessment of corresponding histological parameters, as determined by the GHOST application. (a) Body weight. ***< 0.001 (Dunnett’s test one‐factor linear model). (b) NAFLD Activity Score (NAS) and fibrosis stage. (c) Steatosis score, lobular inflammation score, and ballooning degeneration score. **< 0.01, ***< 0.001 (one‐sided Fisher’s exact test with Bonferroni correction). (d) Proportionate area (%) of hepatocytes with lipid droplets, number of inflammatory foci per mm2, sinusoidal fibrosis and periportal fibrosis. ***< 0.001 (Dunnett’s test one‐factor linear model). (e) Representative photomicrographs showing disappearance of steatosis after chow‐reversal, whereas perisinuoidal fibrosis appears unchanged (scale bar, 100 µm). DIO, diet‐induced obese; GAN, Gubra‐Amylin non‐alcoholic steatohepatitis (NASH) diet; GHOST, Gubra Histopathological Objective Scoring Technology; HE, hematoxylin‐eosin; NAFLD, nonalcoholic fatty liver disease; PSR, picro‐Sirius Red.
FIGURE 4
FIGURE 4
Dietary intervention improves quantitative histological markers of steatosis, inflammation and fibrosis in GAN DIO‐NASH mice. DIO‐NASH mice were administered vehicle (s.c. or q.d.) with (Chow‐reversal [Chow‐rev]) or without (Vehicle [Veh]) dietary intervention. Dietary intervention was performed by switching from the GAN diet to chow for 8 or 12 weeks (n = 12–14 per group). Age‐matched vehicle‐dosed (s.c.) chow‐fed mice (Chow + Veh) served as normal controls (n = 10–15 per group). (a) Histomorphometric assessment of the proportionate (%) area and estimated total liver content of lipids, galectin‐3, α‐SMA, PSR, and Col1a1 staining. (b) Representative photomicrographs showing decreased proportionate (%) area of galectin‐3, α‐SMA and Col1a1 after chow‐reversal (scale bar, 100 µm). DIO, diet‐induced obese; GAN, Gubra‐Amylin non‐alcoholic steatohepatitis (NASH) diet; PSR, picro‐Sirius Red.
FIGURE 5
FIGURE 5
Semaglutide and lanifibranor differentially improves liver histopathological hallmarks in GAN DIO‐NASH mice. GAN DIO‐NASH mice were administered (q.d.) semaglutide (Sema, 30 nmol/kg, s.c.), lanifibranor (Lani, 30 mg/kg, p.o.), or corresponding vehicle (Veh, s.c., or p.o.) for 8 and 12 weeks, respectively (n = 13–16 per group). Chow‐fed mice receiving (q.d.) saline vehicle for 12 weeks (Chow + Veh) served as normal controls (= 16). Histopathological scores and histomorphometric assessment of corresponding histological parameters as determined by the GHOST application. (a) Body weight. ***< 0.001 (Dunnett’s test one‐factor linear model). (b) NAFLD Activity Score (NAS) and fibrosis stage. (c) Steatosis score, lobular inflammation score, and ballooning degeneration score. *p < 0.05, **p < 0.01, ***p < 0.001 (one‐sided Fisher’s exact test with Bonferroni correction). (d) Proportionate area (%) of hepatocytes with lipid droplets, number of inflammatory foci per mm2; sinusoidal fibrosis, and periportal fibrosis. **p < 0.01, ***p < 0.001 (Dunnett’s test one‐factor linear model). (e) Representative photomicrographs showing decreased proportionate (%) area of steatosis after semaglutide and lanifibranor treatment. Only lanifibranor improved fibrosis stage after 12 weeks of treatment (scale bar, 100 µm). DIO, diet‐induced obese; GAN, Gubra‐Amylin non‐alcoholic steatohepatitis (NASH) diet; GHOST, Gubra Histopathological Objective Scoring Technology; HE, hematoxylin‐eosin; NAFLD, nonalcoholic fatty liver disease; PSR, picro‐Sirius Red.
FIGURE 6
FIGURE 6
Semaglutide and lanifibranor differentially improves quantitative histological markers of steatosis, inflammation, and fibrosis in GAN DIO‐NASH mice. GAN DIO‐NASH mice were administered (q.d.) semaglutide (Sema, 30 nmol/kg, s.c.), lanifibranor (Lani, 30 mg/kg, p.o.), or corresponding vehicle (Veh, s.c., or p.o.) for 8 or 12 weeks (n = 13–16 per group). Chow‐fed mice receiving (q.d.) saline vehicle for 12 weeks (Chow + Veh) served as normal controls (n = 16). (a) Histomorphometric assessment of the proportionate (%) area and estimated total liver content of lipids, galectin‐3, α‐SMA, PSR, and Col1a1. *p < 0.05, **p < 0.01, ***p < 0.001 (Dunnett’s test one‐factor linear model). (b) Representative photomicrographs showing decreased proportionate (%) area of of galectin‐3, α‐SMA and Col1a1 after semaglutide and lanifibranor treatment. Only lanifibranor improved the percentage of the area of PSR staining after 12 weeks of treatment. Both treatments had no effect on the percentage of the area of Col1a1 staining (scale bar, 100 µm). DIO, diet‐induced obese; GAN, Gubra‐Amylin non‐alcoholic steatohepatitis (NASH) diet; PSR, picro‐Sirius Red
FIGURE 7
FIGURE 7
Changes in NASH‐linked hepatic gene expression signatures following drug treatment intervention in GAN DIO‐NASH mice. GAN DIO‐NASH mice were administered (q.d.) semaglutide (30 nmol/kg, s.c.), lanifibranor (30 mg/kg, p.o.), or corresponding vehicle (s.c. or p.o.) for 8 and 12 weeks, respectively. Chow‐fed mice receiving (q.d.) saline vehicle for 12 weeks (Chow + Vehicle) served as normal controls. (a) Left panel: Principal component analysis (PCA) of samples based on top 500 most variable gene expression levels. Right panel: Venn diagram of differentially expressed genes compared to corresponding vehicle‐dosed GAN DIO‐NASH mice. (b) Heatmaps illustrating changes in NASH and fibrosis‐associated candidate gene expression compared to corresponding vehicle‐dosed GAN DIO‐NASH mice. Color gradients in heatmaps indicate significantly upregulated (red color) or downregulated (blue color) gene expression (log2‐fold change, false discovery rate < 0.05). (c) Web‐based RNA sequencing data viewer. User interface of online gene expression data base system (Gubra Gene Expression Experience [GGEX], https://rnaseq.gubra.dk/) enabling browsing of complete RNA sequencing data from all mice included in pharmacological intervention studies in GAN DIO‐NASH mice. The RNA sequencing data are also accessible at the NCBI GEO database under accession no. GSE196908. Upper right panel: Gene panels filtered to show disease‐associated gene expression markers of extracellular matrix (ECM) organization (curated list). Table summarizing gene regulations (FDR adjusted p values, DEseq2 analysis). Relative (%) change in ECM gene expression in age‐matched chow‐fed controls (LEAN‐Chow Vehicle) and GAN DIO‐NASH mice administered semaglutide or lanifibranor for 12 weeks (values expressed as mean of n = 8–13 + S.E.M.). Statistical analysis as compared to vehicle‐dosed DIO‐NASH mice (DIO‐NASH Vehicle). The p values in bold indicates statistically significant regulation (p < 0.05). Red and blue numbers in the Change (%) column denote significant up‐ and downregulation of gene expression, respectively. Selected (highlighted in purple) of candidate gene of interest (collagen type 1 alpha‐1 [Col1a1]). Upper left panel: Graphical representation of Col1a1 gene expression levels. Col1a1 mRNA expression level as group average (mean RPKM value ± SEM). Lower panel: Heatmap plot depicting changes in ECM gene expression levels relative to vehicle control. DIO, diet‐induced obese; FDR, false discovery rate; GAN, Gubra‐Amylin non‐alcoholic steatohepatitis (NASH) diet.

References

    1. Younossi ZM, Henry L. Epidemiology of non‐alcoholic fatty liver disease and hepatocellular carcinoma. JHEP Rep. 2021;3:100305. - PMC - PubMed
    1. Brown GT, Kleiner DE. Histopathology of nonalcoholic fatty liver disease and nonalcoholic steatohepatitis. Metabolism. 2016;65:1080‐1086. - PMC - PubMed
    1. Yki‐Järvinen H. Non‐alcoholic fatty liver disease as a cause and a consequence of metabolic syndrome. Lancet Diabetes Endocrinol. 2014;2:901‐910. - PubMed
    1. Younossi ZM. Non‐alcoholic fatty liver disease – a global public health perspective. J Hepatol. 2019;70:531‐544. - PubMed
    1. Loomba R, Friedman SL, Shulman GI. Mechanisms and disease consequences of nonalcoholic fatty liver disease. Cell. 2021;184:2537‐2564. - PubMed

Publication types