

Identification of recurrent genetic patterns from targeted sequencing panels with advanced data science: a case-study on sporadic and genetic neurodegenerative diseases
- PMID: 35144616
- PMCID: PMC8830183
- DOI: 10.1186/s12920-022-01173-4
Identification of recurrent genetic patterns from targeted sequencing panels with advanced data science: a case-study on sporadic and genetic neurodegenerative diseases
Abstract
Background: Targeted Next Generation Sequencing is a common and powerful approach used in both clinical and research settings. However, at present, a large fraction of the acquired genetic information is not used since pathogenicity cannot be assessed for most variants. Further complicating this scenario is the increasingly frequent description of a poli/oligogenic pattern of inheritance showing the contribution of multiple variants in increasing disease risk. We present an approach in which the entire genetic information provided by target sequencing is transformed into binary data on which we performed statistical, machine learning, and network analyses to extract all valuable information from the entire genetic profile. To test this approach and unbiasedly explore the presence of recurrent genetic patterns, we studied a cohort of 112 patients affected either by genetic Creutzfeldt-Jakob (CJD) disease caused by two mutations in the PRNP gene (p.E200K and p.V210I) with different penetrance or by sporadic Alzheimer disease (sAD).
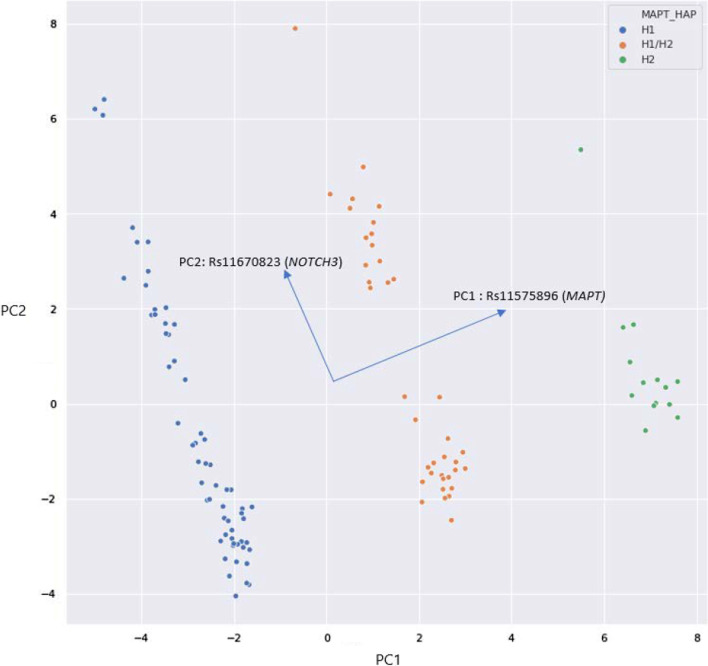
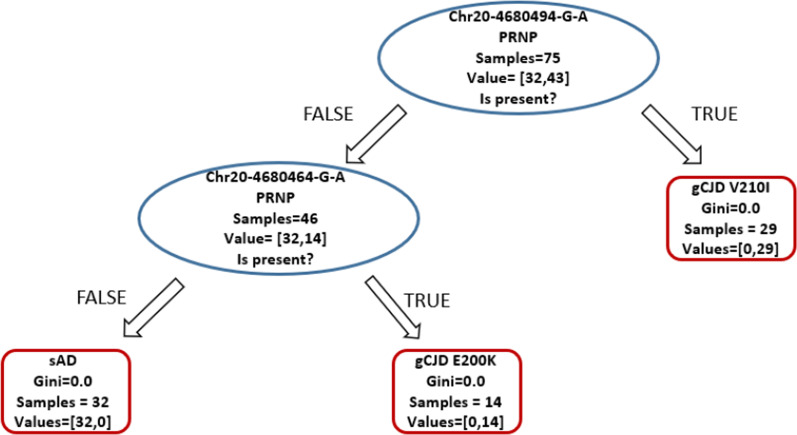
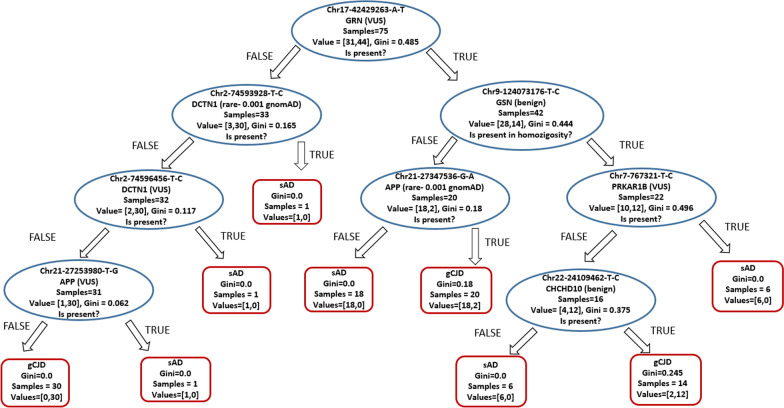
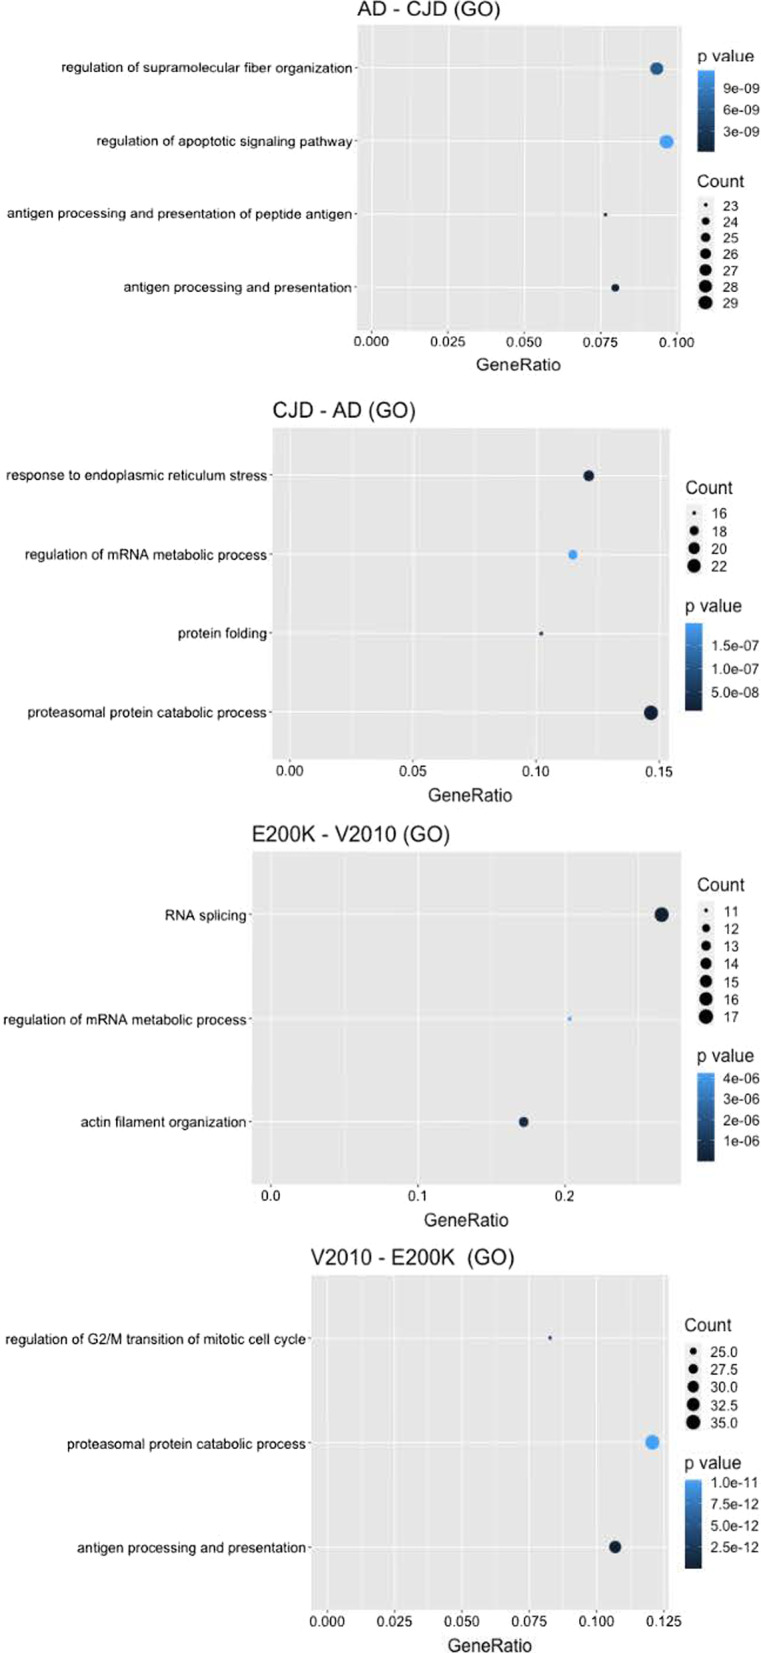
Results: Unsupervised methods can identify functionally relevant sources of variation in the data, like haplogroups and polymorphisms that do not follow Hardy-Weinberg equilibrium, such as the NOTCH3 rs11670823 (c.3837 + 21 T > A). Supervised classifiers can recognize clinical phenotypes with high accuracy based on the mutational profile of patients. In addition, we found a similar alteration of allele frequencies compared the European population in sporadic patients and in V210I-CJD, a poorly penetrant PRNP mutation, and sAD, suggesting shared oligogenic patterns in different types of dementia. Pathway enrichment and protein-protein interaction network revealed different altered pathways between the two PRNP mutations.
Conclusions: We propose this workflow as a possible approach to gain deeper insights into the genetic information derived from target sequencing, to identify recurrent genetic patterns and improve the understanding of complex diseases. This work could also represent a possible starting point of a predictive tool for personalized medicine and advanced diagnostic applications.
Keywords: Alzheimer’s Disease; CJD; Complex diseases; Gene panels; Genetic modifiers; Machine learning; NGS; Neurodegeneration; Polygenic score.
© 2022. The Author(s).
Conflict of interest statement
The authors have no competing interests to declare.
Figures
Similar articles
-
Age at onset of genetic (E200K) and sporadic Creutzfeldt-Jakob diseases is modulated by the CYP4X1 gene.J Neurol Neurosurg Psychiatry. 2018 Dec;89(12):1243-1249. doi: 10.1136/jnnp-2018-318756. Epub 2018 Jul 21. J Neurol Neurosurg Psychiatry. 2018. PMID: 30032116
-
Genetic cross-interaction between APOE and PRNP in sporadic Alzheimer's and Creutzfeldt-Jakob diseases.PLoS One. 2011;6(7):e22090. doi: 10.1371/journal.pone.0022090. Epub 2011 Jul 20. PLoS One. 2011. PMID: 21799773 Free PMC article.
-
PRNP variation in UK sporadic and variant Creutzfeldt Jakob disease highlights genetic risk factors and a novel non-synonymous polymorphism.BMC Med Genet. 2009 Dec 26;10:146. doi: 10.1186/1471-2350-10-146. BMC Med Genet. 2009. PMID: 20035629 Free PMC article.
-
[Genetic background of human prion diseases].Ideggyogy Sz. 2007 Nov 30;60(11-12):438-46. Ideggyogy Sz. 2007. PMID: 18198790 Review. Hungarian.
-
Familial Creutzfeldt-Jakob disease. Codon 200 prion disease in Libyan Jews.Medicine (Baltimore). 1997 Jul;76(4):227-37. doi: 10.1097/00005792-199707000-00001. Medicine (Baltimore). 1997. PMID: 9279329 Review.
Cited by
-
Genomic, transcriptomic and RNA editing analysis of human MM1 and VV2 sporadic Creutzfeldt-Jakob disease.Acta Neuropathol Commun. 2022 Dec 14;10(1):181. doi: 10.1186/s40478-022-01483-9. Acta Neuropathol Commun. 2022. PMID: 36517866 Free PMC article.
-
Database and AI Diagnostic Tools Improve Understanding of Lung Damage, Correlation of Pulmonary Disease and Brain Damage in COVID-19.Sensors (Basel). 2022 Aug 22;22(16):6312. doi: 10.3390/s22166312. Sensors (Basel). 2022. PMID: 36016071 Free PMC article.
-
Dementia-related genetic variants in an Italian population of early-onset Alzheimer's disease.Front Aging Neurosci. 2022 Sep 5;14:969817. doi: 10.3389/fnagi.2022.969817. eCollection 2022. Front Aging Neurosci. 2022. PMID: 36133075 Free PMC article.
-
Syndrome Pattern Recognition Method Using Sensed Patient Data for Neurodegenerative Disease Progression Identification.Diagnostics (Basel). 2023 Feb 26;13(5):887. doi: 10.3390/diagnostics13050887. Diagnostics (Basel). 2023. PMID: 36900031 Free PMC article.
References
Publication types
MeSH terms
LinkOut - more resources
Full Text Sources
Medical
Miscellaneous
