Immune cell gene expression signatures in diffuse glioma are associated with IDH mutation status, patient outcome and malignant cell state, and highlight the importance of specific cell subsets in glioma biology
- PMID: 35144680
- PMCID: PMC8830123
- DOI: 10.1186/s40478-022-01323-w
Immune cell gene expression signatures in diffuse glioma are associated with IDH mutation status, patient outcome and malignant cell state, and highlight the importance of specific cell subsets in glioma biology
Abstract
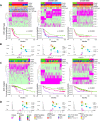
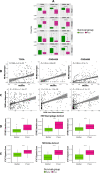
The tumor micro-environment (TME) plays an important role in various cancers, including gliomas. We estimated immune cell type-specific gene expression profiles in 3 large clinically annotated glioma datasets using CIBERSORTx and LM22/LM10 blood-based immune signatures and found that the proportions and estimated gene expression patterns of specific immune cells significantly varied according to IDH mutation status. When IDH-WT and IDH-MUT tumors were considered separately, cluster-of-cluster analyses of immune cell gene expression identified groups with distinct survival outcomes. We confirmed and extended these findings by applying a signature matrix derived from single-cell RNA-sequencing data derived from 19 glioma tumor samples to the bulk profiling data, validating findings from the LM22/LM10 results. To link immune cell signatures with outcomes in checkpoint therapy, we then showed a significant association of monocytic lineage cell gene expression clusters with patient survival and with mesenchymal gene expression scores. Integrating immune cell-based gene expression with previously described malignant cell states in glioma demonstrated that macrophage M0 abundance significantly correlated with mesenchymal state in IDH-WT gliomas, with evidence of a previously implicated role of the Oncostatin-M receptor and macrophages in the mesenchymal state. Among IDH-WT tumors that were enriched for the mesenchymal cell state, the estimated M0 macrophage expression signature coordinately also trended to a mesenchymal signature. We also examined IDH-MUT tumors stratified by 1p/19q status, showing that a mesenchymal gene expression signature the M0 macrophage fraction was enriched in IDH-MUT, non-codeleted tumors. Overall, these results highlight the biological and clinical significance of the immune cell environment related to IDH mutation status, patient prognosis and the mesenchymal state in diffuse gliomas.
Keywords: CIBERSORTx; Deconvolution; Glioma; Malignant cell-state; Prognosis; Tumor microenvironment.
© 2022. The Author(s).
Conflict of interest statement
The authors declare no competing interests.
Figures


Similar articles
-
Correlation of immune phenotype with IDH mutation in diffuse glioma.Neuro Oncol. 2017 Oct 19;19(11):1460-1468. doi: 10.1093/neuonc/nox054. Neuro Oncol. 2017. PMID: 28531337 Free PMC article.
-
Use of telomerase promoter mutations to mark specific molecular subsets with reciprocal clinical behavior in IDH mutant and IDH wild-type diffuse gliomas.J Neurosurg. 2018 Apr;128(4):1102-1114. doi: 10.3171/2016.11.JNS16973. Epub 2017 Jun 16. J Neurosurg. 2018. PMID: 28621624
-
A nuclear transport-related gene signature combined with IDH mutation and 1p/19q codeletion better predicts the prognosis of glioma patients.BMC Cancer. 2020 Nov 9;20(1):1072. doi: 10.1186/s12885-020-07552-3. BMC Cancer. 2020. PMID: 33167941 Free PMC article.
-
Impending Impact of Molecular Pathology on Classifying Adult Diffuse Gliomas.Cancer Control. 2015 Apr;22(2):200-5. doi: 10.1177/107327481502200211. Cancer Control. 2015. PMID: 26068765 Review.
-
TERT promoter mutation and its interaction with IDH mutations in glioma: Combined TERT promoter and IDH mutations stratifies lower-grade glioma into distinct survival subgroups-A meta-analysis of aggregate data.Crit Rev Oncol Hematol. 2017 Dec;120:1-9. doi: 10.1016/j.critrevonc.2017.09.013. Epub 2017 Oct 3. Crit Rev Oncol Hematol. 2017. PMID: 29198322 Review.
Cited by
-
Immuno-oncologic profiling of pediatric brain tumors reveals major clinical significance of the tumor immune microenvironment.Nat Commun. 2024 Jul 10;15(1):5790. doi: 10.1038/s41467-024-49595-1. Nat Commun. 2024. PMID: 38987542 Free PMC article.
-
Single-cell sequencing systematically analyzed the mechanism of Emdogain on the restoration of delayed replantation periodontal membrane.Int J Oral Sci. 2025 Apr 17;17(1):33. doi: 10.1038/s41368-024-00345-5. Int J Oral Sci. 2025. PMID: 40246878 Free PMC article.
-
Peripheral blood-derived immune cell counts as prognostic indicators and their relationship with DNA methylation subclasses in glioblastoma patients.Brain Pathol. 2025 Jul;35(4):e13334. doi: 10.1111/bpa.13334. Epub 2025 Feb 3. Brain Pathol. 2025. PMID: 39901324 Free PMC article.
-
Branched-chain amino acid transaminase 1 regulates glioblastoma cell plasticity and contributes to immunosuppression.Neuro Oncol. 2024 Feb 2;26(2):251-265. doi: 10.1093/neuonc/noad190. Neuro Oncol. 2024. PMID: 37769206 Free PMC article.
-
Isocitrate dehydrogenase mutations in gliomas: A review of current understanding and trials.Neurooncol Adv. 2023 May 10;5(1):vdad053. doi: 10.1093/noajnl/vdad053. eCollection 2023 Jan-Dec. Neurooncol Adv. 2023. PMID: 37287696 Free PMC article. Review.
References
-
- Ascierto ML, Kmieciak M, Idowu MO, Manjili R, Zhao Y, Grimes M, Dumur C, Wang E, Ramakrishnan V, Wang XY, et al. A signature of immune function genes associated with recurrence-free survival in breast cancer patients. Breast Cancer Res Treat. 2012;131:871–880. doi: 10.1007/s10549-011-1470-x. - DOI - PMC - PubMed
Publication types
MeSH terms
Substances
LinkOut - more resources
Full Text Sources
Other Literature Sources
Medical

