

Global status of essential medicine selection: a systematic comparison of national essential medicine lists with recommendations by WHO
- PMID: 35144950
- PMCID: PMC8845216
- DOI: 10.1136/bmjopen-2021-053349
Global status of essential medicine selection: a systematic comparison of national essential medicine lists with recommendations by WHO
Abstract
Objectives: Examining the availability of essential medicines is a necessary step to monitor country-level progress towards universal health coverage. We compared the 2017 essential medicine lists (EML) of 137 countries to the WHO Model List to assess differences by drug class and country setting.
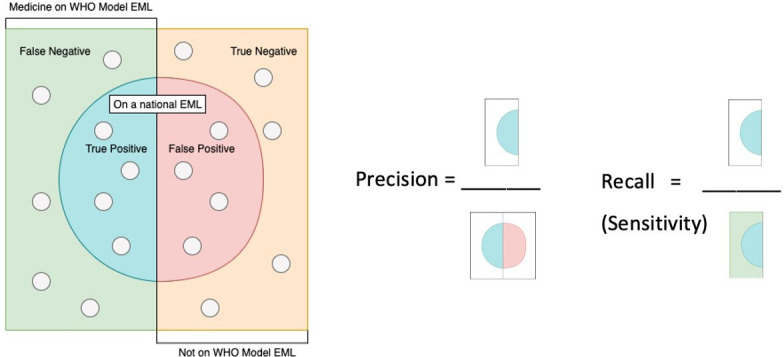
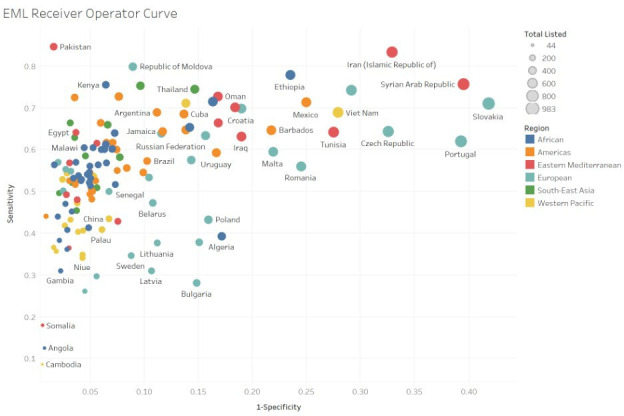
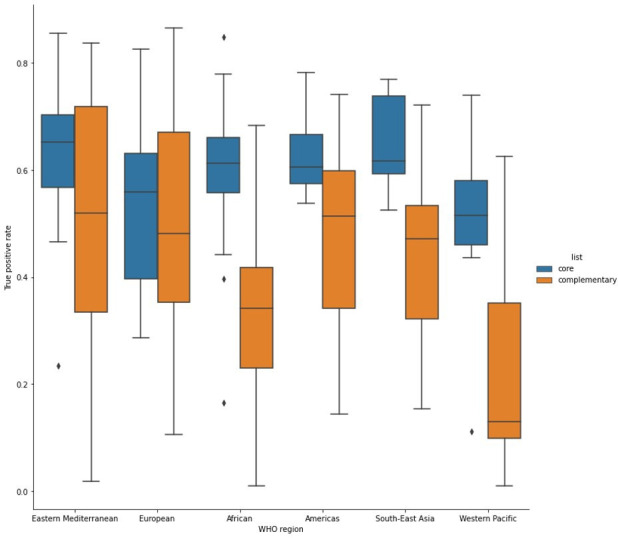
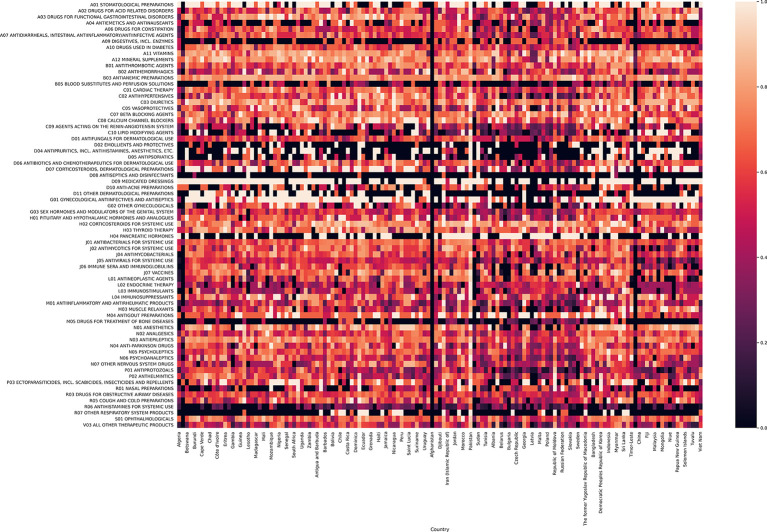
Methods: We extracted all medicines prioritised at country level from most recently available national EMLs and compared each national EML with the 2017 WHO Model List of Essential Medicines (MLEM) as the reference standard. We assess EMLs by WHO region and for different types of medicine subgroups (eg, cancer, anti-infectives, cardiac, psychiatric and anaesthesia medicines) using within second-level anatomical therapeutic class (ATC) drug classes of the ATC Index.
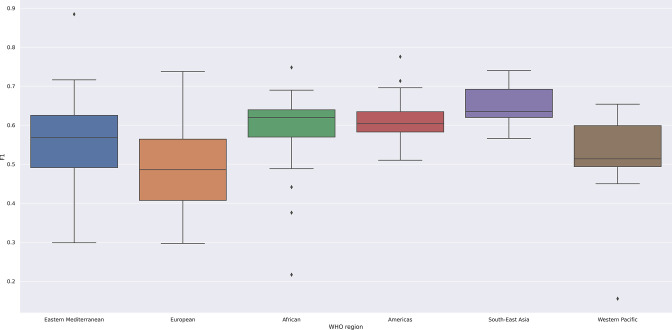
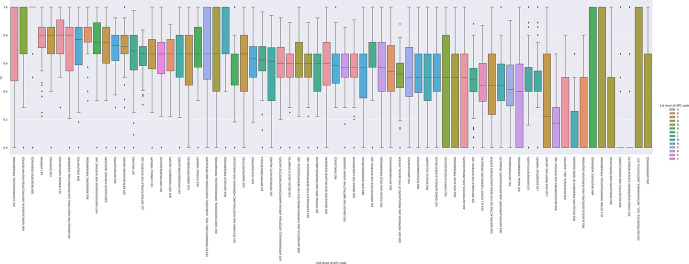
Results: We included 406 medicines from WHO's 2017 MLEM to compare to 137 concurrent national EMLs. We found a median of 315 (range from 44 to 983) medicines listed on national EMLs. The global median F1 score was 0.59 (IQR 0.47-0.70, maximum possible score indicating alignment with MLEM is 1). The F1 score was the highest (ie, most similar to MLEM) in the South-East Asia region and the lowest in the European region (ie, most dissimilar to MLEM). The F1 score was highest for stomatological preparations (median: 1.00), gynaecological-anti-infectives and antiseptics (median: 1.00), and medicated dressings (median: 1.00), and lowest for 9 anatomical or pharmacological groups (median: 0.00, eg, treatments for bone diseases, digestive enzymes).
Conclusions: Most countries are expected to improve their national health coverage by 2030 offering access to essential medicines, but our results revealed substantial gaps in selection of medicines at the national level compared with those recommended by WHO. It is crucial that governments consider investing in those effective medicines that are now neglected and continue monitoring progress towards essential medicine access as part of universal health coverage.
Keywords: health economics; health policy; public health.
© Author(s) (or their employer(s)) 2022. Re-use permitted under CC BY-NC. No commercial re-use. See rights and permissions. Published by BMJ.
Conflict of interest statement
Competing interests: None declared.
Figures
References
-
- World Health Organization . Essential Meds. Available: https://global.essentialmeds.org/dashboard/countries [Accessed 15 July 2020].
-
- WHO . Model Lists of essential medicines Geneva, Switzerland: World Health organization, 2020. Available: https://www.who.int/groups/expert-committee-on-selection-and-use-of-esse... [Accessed 9 Nov 2020].
-
- WHO . WHO model list of essential medicines: Wikipedia, 2020. Available: https://en.wikipedia.org/wiki/WHO_Model_List_of_Essential_Medicines
-
- Selection of essential . Medicines at country level: using the who model list of essential medicines to update a national essential medicines list. Geneva, Switzerland: World Health Organization, 2020.
Publication types
MeSH terms
Substances
Grants and funding
LinkOut - more resources
Full Text Sources
Medical
Research Materials