. 2022 Feb 15;119(7):e2119720119.
doi: 10.1073/pnas.2119720119.

Mutation bias shapes the spectrum of adaptive substitutions

Affiliations

Mutation bias shapes the spectrum of adaptive substitutions

Alejandro V Cano et al. Proc Natl Acad Sci U S A. .

Abstract

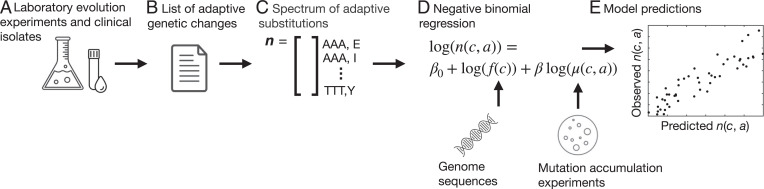
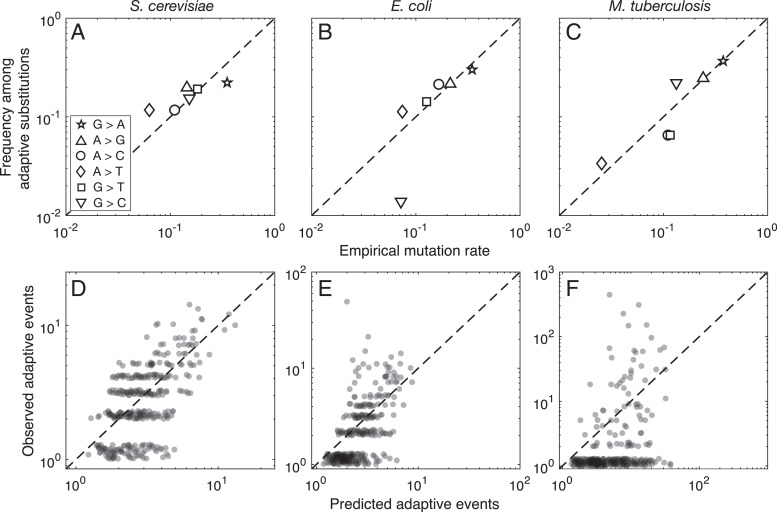
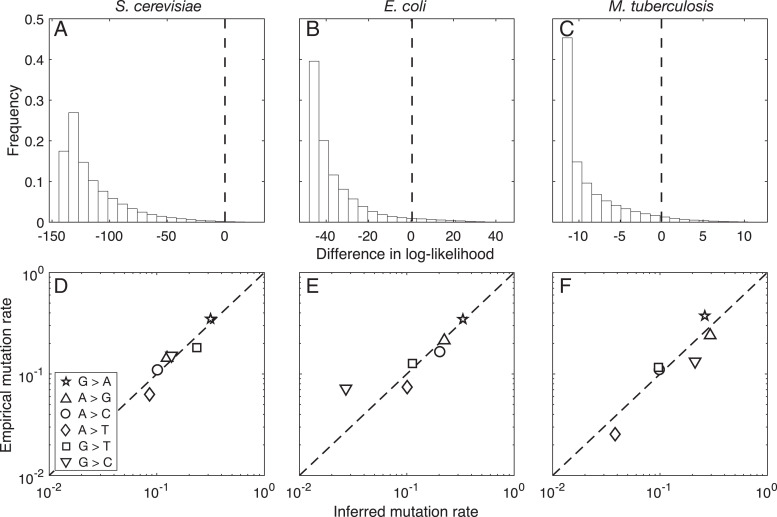
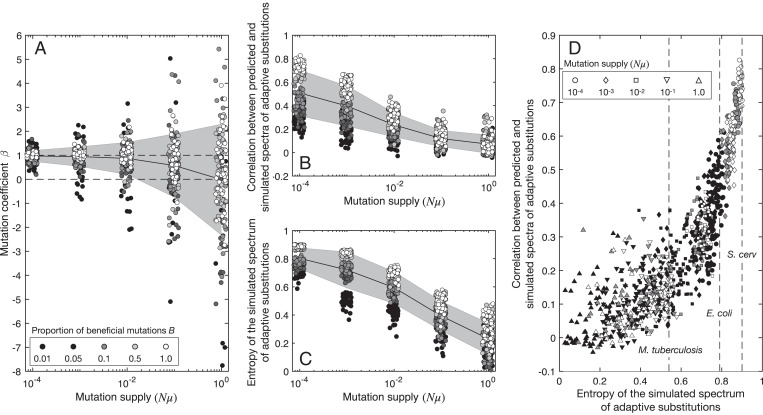
Evolutionary adaptation often occurs by the fixation of beneficial mutations. This mode of adaptation can be characterized quantitatively by a spectrum of adaptive substitutions, i.e., a distribution for types of changes fixed in adaptation. Recent work establishes that the changes involved in adaptation reflect common types of mutations, raising the question of how strongly the mutation spectrum shapes the spectrum of adaptive substitutions. We address this question with a codon-based model for the spectrum of adaptive amino acid substitutions, applied to three large datasets covering thousands of amino acid changes identified in natural and experimental adaptation in Saccharomyces cerevisiae, Escherichia coli, and Mycobacterium tuberculosis Using species-specific mutation spectra based on prior knowledge, we find that the mutation spectrum has a proportional influence on the spectrum of adaptive substitutions in all three species. Indeed, we find that by inferring the mutation rates that best explain the spectrum of adaptive substitutions, we can accurately recover the species-specific mutation spectra. However, we also find that the predictive power of the model differs substantially between the three species. To better understand these differences, we use population simulations to explore the factors that influence how closely the spectrum of adaptive substitutions mirrors the mutation spectrum. The results show that the influence of the mutation spectrum decreases with increasing mutational supply ([Formula: see text]) and that predictive power is strongly affected by the number and diversity of beneficial mutations.

Keywords: adaptation; molecular evolution; mutation bias; population genetics; proteins.


Conflict of interest statement

The authors declare no competing interest.

Figures

Fig. 1.
Fig. 1.
Workflow. (A and B) We use data from laboratory evolution experiments (E. coli and S. cerevisiae) and clinical isolates (M. tuberculosis) (A) to curate a list of genetic changes associated with adaptation for each species (B). (C) From each list of adaptive changes, we construct the spectrum of adaptive substitutions n. Each element in this spectrum n(c,a) corresponds to one of the 354 distinct changes from codon c to amino acid a that can be produced by a single-nucleotide mutation under the standard genetic code, and tallies the number of adaptive events for a specific codon-to-amino-acid change. (D) We perform negative binomial regression to model the influence of mutation bias on the spectrum of adaptive events, using codon frequencies derived from genome sequences and experimentally characterized mutation spectra. (E) We use the fitted model to predict the spectrum of adaptive substitutions.
Fig. 2.
Fig. 2.
Predicted and observed substitutions at the nucleotide and codon-to-amino-acid levels. (AC) The frequency of nucleotide changes among adaptive substitutions is plotted as a function of the empirical mutation rate for (A) S. cerevisiae, (B) E. coli, and (C) M. tuberculosis. The symbols correspond to the six different types of point mutations (A, Inset). (DF) The predicted spectra of adaptive substitutions are shown in relation to the observed spectra of adaptive substitutions for (D) S. cerevisiae, (E) E. coli, and (F) M. tuberculosis. See SI Appendix, Table S3 for model predictions using codon frequencies alone. For visualization purposes, a pseudocount of one event and a jitter of range [0,0.3] were added to both the observed and predicted numbers of events in DF. The dashed diagonal lines indicate y = x.
Fig. 3.
Fig. 3.
Empirical mutation rates explain the spectrum of adaptive substitutions better than randomized rates. In A–C, the white bars show the distribution of log-likelihood differences for randomized vs. empirical mutation rates for (A) S. cerevisiae, (B) E. coli, and (C) M. tuberculosis. A value of 0 (dashed vertical line) means that a randomized rate performs as well as the empirical mutation rate. The fraction of randomized rates providing a better model fit than the empirical rates (i.e., right of 0) is 0.2%, 3.7%, and 4.2% for A, B and C, respectively. Data are based on 106 randomized rates. Note that A–C have different limits on their horizontal axes. In D–F, the empirical mutation rate is shown in relation to the inferred mutation rate on a double-logarithmic scale for (D) S. cerevisiae, (E) E. coli, and (F) M. tuberculosis. Symbol types correspond to D, Inset. The dashed diagonal line indicates y = x.
Fig. 4.
Fig. 4.
Evolutionary simulations show mutation supply and mutational target size jointly modulate the predictive power of our model. (A) The inferred mutation coefficient β as a function of Nμ for five different values of B, the fraction of beneficial mutations (the same color scheme for B is used in all panels). Dashed horizontal lines are drawn at β  =  0 and β  =  1 to indicate no influence and proportional influence of the mutation spectrum on the spectrum of adaptive substitutions, respectively. (B and C) Pearson’s correlation coefficient between predicted and simulated spectra of adaptive substitutions as a function of Nμ for five different values of B (B) and entropy of simulated spectra of adaptive substitutions as a function of Nμ for five different values of B (C). In AC, the black lines show the mean and the gray areas show the SD. (D) Pearson’s correlation coefficient between predicted and simulated spectra of adaptive substitutions is shown in relation to the entropy of the simulated spectra of adaptive substitutions for different levels of mutation supply. The dashed vertical lines show the entropy of the spectrum of adaptive substitutions for each of our three study species.

References

    1. Yokoyama S., Radlwimmer F. B., The molecular genetics and evolution of red and green color vision in vertebrates. Genetics 158, 1697–1710 (2001). - PMC - PubMed
    1. Ujvari B., et al., Widespread convergence in toxin resistance by predictable molecular evolution. Proc. Natl. Acad. Sci. U.S.A. 112, 11911–11916 (2015). - PMC - PubMed
    1. Natarajan C., et al., Convergent evolution of hemoglobin function in high-altitude Andean waterfowl involves limited parallelism at the molecular sequence level. PLoS Genet. 11, e1005681 (2015). - PMC - PubMed
    1. Manson A. L., et al., TBResist Global Genome Consortium, Genomic analysis of globally diverse Mycobacterium tuberculosis strains provides insights into the emergence and spread of multidrug resistance. Nat. Genet. 49, 395–402 (2017). - PMC - PubMed
    1. Payne J. L., et al., Transition bias influences the evolution of antibiotic resistance in Mycobacterium tuberculosis. PLoS Biol. 17, e3000265 (2019). - PMC - PubMed

MeSH terms

LinkOut - more resources