. 2022 Feb 10;13(1):805.
doi: 10.1038/s41467-022-28378-6.

In vivo CRISPR screens reveal a HIF-1α-mTOR-network regulates T follicular helper versus Th1 cells

Affiliations

In vivo CRISPR screens reveal a HIF-1α-mTOR-network regulates T follicular helper versus Th1 cells

Bonnie Huang et al. Nat Commun. .

Abstract

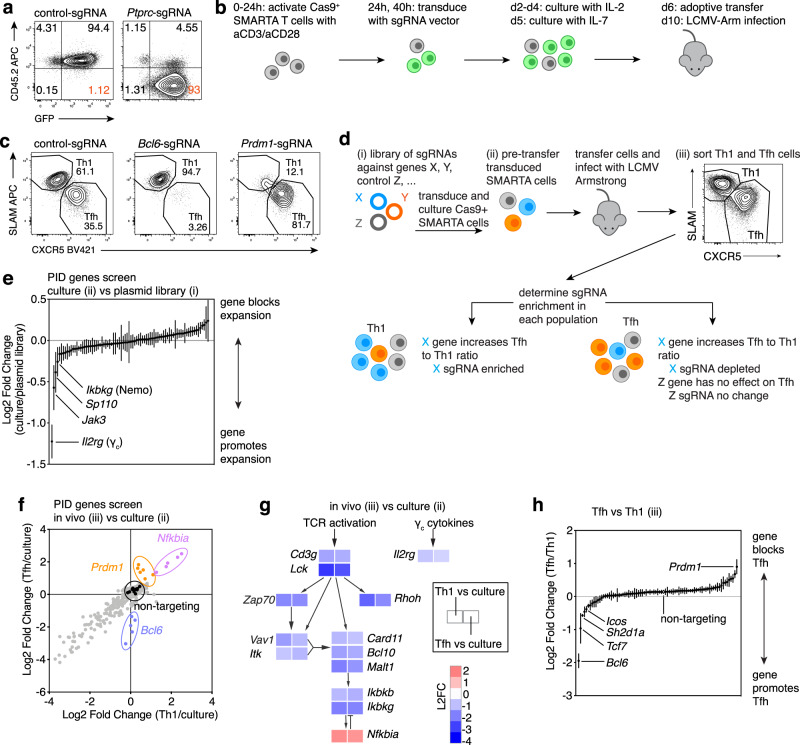
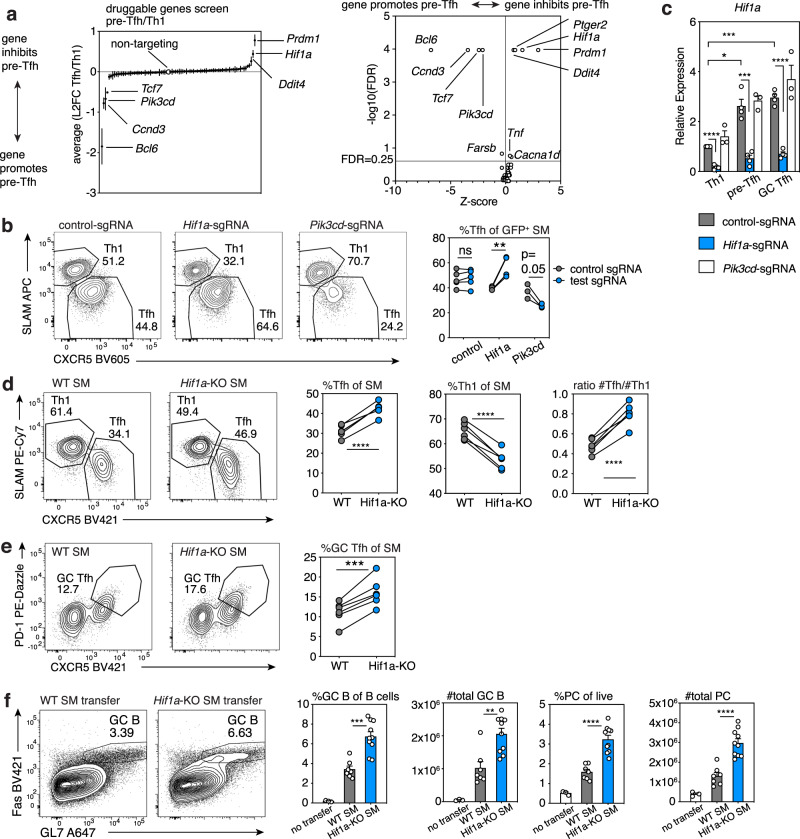
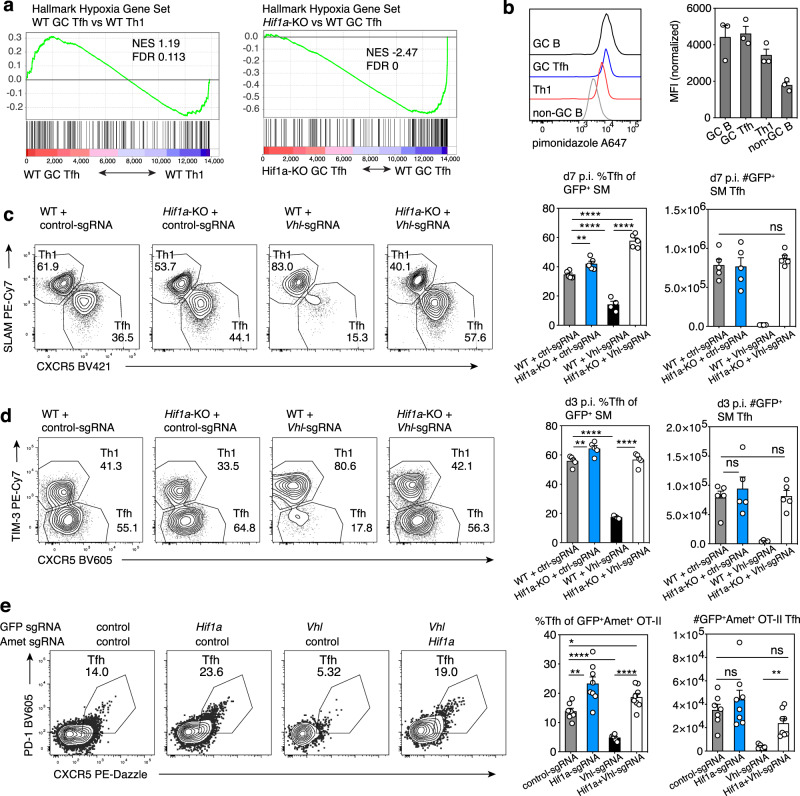
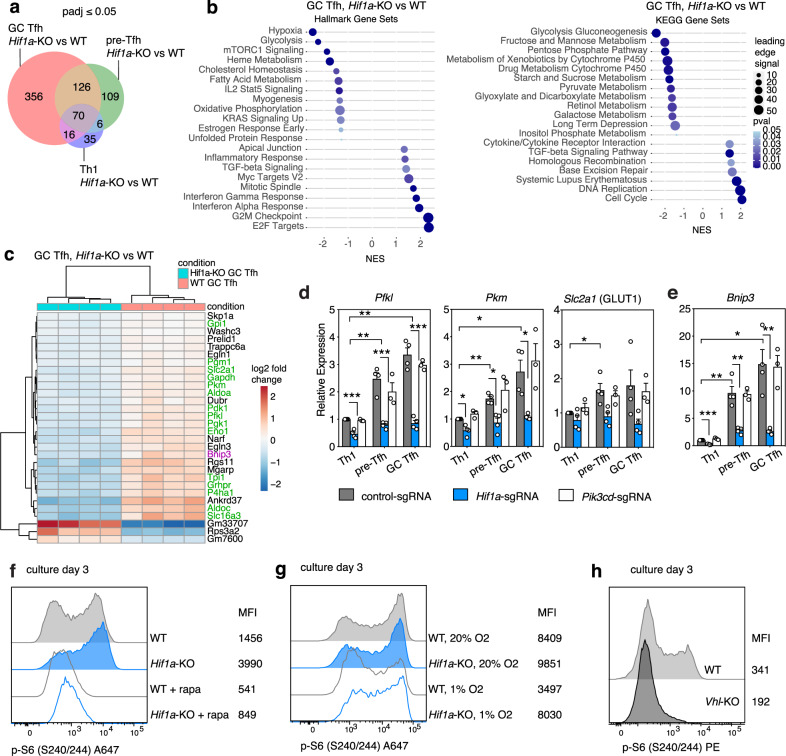
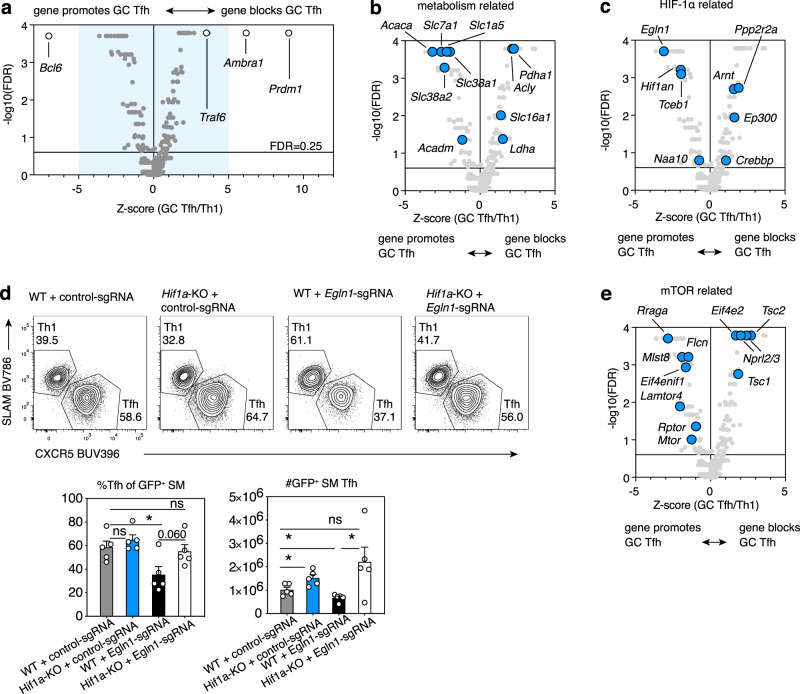
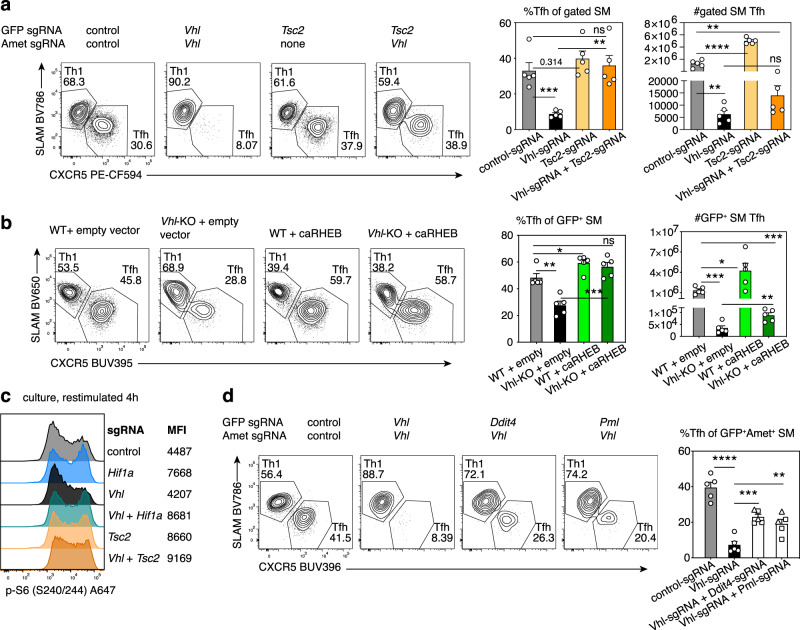
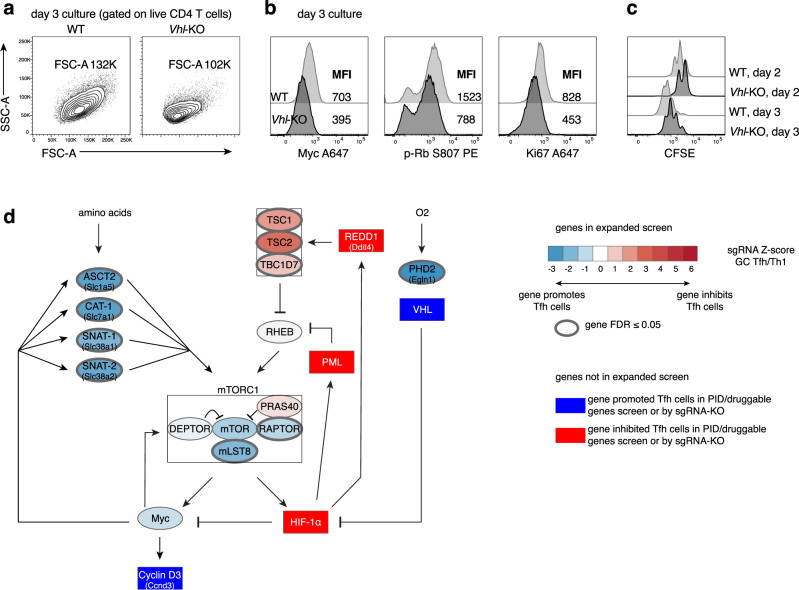
T follicular helper (Tfh) cells provide signals to initiate and maintain the germinal center (GC) reaction and are crucial for the generation of robust, long-lived antibody responses, but how the GC microenvironment affects Tfh cells is not well understood. Here we develop an in vivo T cell-intrinsic CRISPR-knockout screen to evaluate Tfh and Th1 cells in an acute viral infection model to identify regulators of Tfh cells in their physiological setting. Using a screen of druggable-targets, alongside genetic, transcriptomic and cellular analyses, we identify a function of HIF-1α in suppressing mTORC1-mediated and Myc-related pathways, and provide evidence that VHL-mediated degradation of HIF-1α is required for Tfh development; an expanded in vivo CRISPR screen reveals multiple components of these pathways that regulate Tfh versus Th1 cells, including signaling molecules, cell-cycle regulators, nutrient transporters, metabolic enzymes and autophagy mediators. Collectively, our data serve as a resource for studying Tfh versus Th1 decisions, and implicate the VHL-HIF-1α axis in fine-tuning Tfh generation.


Conflict of interest statement

B.H. is currently an employee of Bristol Myers Squibb. S.P. and A.L.S. are currently employees of AstraZeneca and may own stock or stock options. J.G.R. is currently an employee of TCR2. All remaining authors declare no competing interests.

Figures

Fig. 1
Fig. 1. CRISPR-mediate gene knockout in primary mouse T cells and screen of PID genes.
a CD45 on Cas9+ CD4 T cells transduced with MRIG-control or -Ptprc-sgRNA at d6 in culture. b Schematic of Cas9+ SMARTA cells transduction, adoptive transfer into WT hosts, and LCMV Armstrong infection. Green:transduced cells. c Representative flow plots of Tfh:Th1 differentiation of Cas9+ SMARTA cells transduced with control-, Bcl6-, or Prdm1-sgRNA, d6 post-LCMV. d In vivo screening schematic, indicating samples collected for DNA and quantification of sgRNA-sequences by deep sequencing from: (i) pooled sgRNA library, (ii) cultured transduced Cas9+ SMARTA T cells, and (iii) isolated Th1 and Tfh populations after adoptive transfer and infection with LCMV Armstrong. Blue:gene required for Tfh; Orange:gene required for Th1 cells; Grey:no effect on Tfh cells e Log2 fold change (L2FC) of sgRNA relative abundance, comparing Cas9+ SMARTA cells at d6 culture (prior to adoptive transfer) to PID sgRNA plasmid library. Each symbol represents mean of all sgRNAs for one gene + /-SEM. fh Cas9+ SMARTA cells transduced with PID library were sorted into Th1 and Tfh populations on d6 post-LCMV infection. f L2FC of sgRNA relative abundance, comparing Tfh/culture versus Th1/culture. Each symbol represents an individual sgRNA. Colors as in (d) plus black:controls; purple:gene inhibits cell-expansion; grey:gene required for cell-expansion. g L2FC of Tfh/culture and Th1/culture for sgRNAs targeting select genes involved in TCR and NF-κB signaling. L2FC are means of all sgRNAs for each gene. h L2FC of sgRNA relative abundance comparing Tfh versus Th1. Each symbol represents the mean of all sgRNAs for one gene + /-SEM. eh Data pooled from 2 independent experiments. n = 9 mice total (first experiment n = 4, second experiment n = 5). Cells from each mouse were sorted individually. Ratio and L2FC values were calculated as the mean for each mouse for each experiment, then averaged across experiments. Source data provided in Source Data file and Supplementary Data 3.
Fig. 2
Fig. 2. Druggable-target CRISPR screen reveals disparate roles for PI3K p110δ and HIF-1α.
a Druggable targets sgRNA screen (single experiment, sorted as in Supplementary Fig. 2a post-LCMV, n = 17 mice (d6 n = 8; d7 n = 9). Left: L2FC of sgRNA pre-Tfh versus Th1 relative abundance. Each symbol represents mean of all sgRNAs for one gene + /-SEM. Right: Screen results analyzed by Mageck for FDR and L2FC to generate Z-scores. Genes with FDR < 0.25 are indicated. b Representative flow plots of Tfh:Th1 differentiation in WT hosts receiving co-transferred CD45.2/.2 Cas9+ control-sgRNA-transduced SMARTA cells and CD45.1/.2 Cas9+ SMARTA cells transduced with indicated sgRNA vectors, analyzed d6 post-LCMV. Control-sgRNA n = 5, Hif1a-sgRNA n = 4, Pik3cd-sgRNA n = 3. c qRT-PCR of Hif1a mRNA in Cas9+ SMARTA cells transduced with indicated MRIG sgRNA vectors, transferred into WT hosts, and sorted d6 p.i. Data are pooled from N = 3–4 independent experiments (control-sgRNA and Hif1a-sgRNA N = 4; Pik3cd-sgRNA N = 3) using 3–8 mice/genotype/experiment. Within each experiment, relative expression was normalized to control-sgRNA Th1 cells. d Tfh:Th1 representative flow plots in CD45.1/.2 hosts receiving co-transferred naïve CD45.1/.1 WT and CD45.2/.2 Hif1a-KO-SMARTA cells, on d8 post-LCMV, n = 6 mice/group. e GC Tfh representative flow plots and percentages for experiment in (d). f Representative flow plots and frequencies and total numbers of GC (Fas+GL-7+) B cells among CD19+B220+ B cells, plasma cell (B220medCD138+) (PC) among live cells, in Bcl6fl/flCd4-Cre+ hosts that received no T cells, naïve WT or naïve Hif1a-KO SMARTA cells, analyzed d8 post-LCMV infection. WT SMARTA recipients n = 7, Hif1a-KO SMARTA recipients n = 10, controls n = 3. Data in (c) and (f) represent mean +SEM. Representative data (b), (df) shown from 1 of at least 2 independent experiments. *p < 0.05; **p < 0.01, ***p < 0.001, ****p < 0.0001, evaluated by two-tailed unpaired (c, f) or paired (b, d, e) Student’s t test. Source data provided in Source Data file and Supplementary Data 5.
Fig. 3
Fig. 3. Hypoxia and loss of VHL repress Tfh differentiation.
a GSEA analysis of “Hallmark Hypoxia” gene set in bulk RNA-seq data from WT or Hif1a-KO SMARTA cells transferred into WT hosts and sorted for Th1, pre-Tfh, and GC Tfh cell populations on d8 post-LCMV infection. NES, normalized enrichment score. b Pimonidazole staining of host B cells and WT SMARTA cells after transfer into WT hosts, on d8 post-LCMV infection. MFIs were normalized to cells from control hosts receiving WT SMARTA cells and saline injections, infected and processed in parallel. n = 3 pimonidazole-injected mice. c, d Representative flow plots, Tfh percentages and total Tfh cells from WT or Hif1a-KO Cas9+ GFP+ SMARTA cells transduced with control- or Vhl-sgRNA vector and transferred into WT hosts, on d6 (c) and d3 (d) post-LCMV infection, Vhl-sgRNA n = 4 mice, all other groups n = 5. e Representative flow plots, Tfh percentages and total Tfh cells from GFP+Ametrine+ Cas9+ OT-II cells after transduction with the indicated sgRNA vectors and transferred into WT hosts, on d6 post-immunization with NP-ovalbumin/alum, control-sgRNA n = 7, Hif1a-sgRNA n = 8, Vhl-sgRNA n = 5, Hif1a-sgRNA + Vhl-sgRNA n = 8. Data in (be) are presented as mean values +SEM. Representative data for (be) shown from 1 of at least 2 independent experiments. *p < 0.05; **p < 0.01, ***p < 0.001, ****p < 0.0001 as evaluated by two-tailed unpaired Student’s t test (ce). Source data provided in Source Data file and Supplementary Data 6.
Fig. 4
Fig. 4. HIF-1α-mediated gene expression changes reveal negative regulation of mTORC1.
a Venn diagram of differentially expressed genes from comparisons of Hif1a-KO and WT SMARTA Th1, pre-Tfh, and GC Tfh cell populations by bulk RNA-seq, on d8 post-LCMV. b GSEA analysis and c heatmap of differentially expressed genes from comparison of WT and Hif1a-KO SMARTA GC Tfh cells, on d8 post-LCMV. In (c), metabolic genes are highlighted in green, Bnip3 is highlighted in purple. d, e qRT-PCR of select glycolytic genes (d) and Bnip3 (e) mRNA in sorted p.i. SMARTA cells, as described in Fig. 2c. Data are pooled from N = 3–4 independent infection and sort experiments (control-sgRNA and Hif1a-sgRNA N = 4 experiments, Pik3cd-sgRNA N = 3). Data in (d, e) are presented as mean values +SEM. f Phospho-S6 (p-S6) staining in WT or Hif1a-KO SMARTA cells cultured under Tfh-like conditions, with or without rapamycin, on d3. g Phospho-S6 staining in WT or Hif1a-KO SMARTA cells cultured under Tfh-like conditions, under 20% or 1% O2, on d3. h Phospho-S6 staining in WT or Vhl-KO SMARTA cells cultured under Tfh-like conditions, on d3. Representative data for (fh) shown from 1 of at least 2 independent experiments. Experimental details for (d, e) as described for Fig, 2c. *p < 0.05; **p < 0.01, ***p < 0.001 as evaluated by two-tailed unpaired Student’s t test (d-e). Source data provided in Source Data file and Supplementary Data 6.
Fig. 5
Fig. 5. Opposing HIF-1α and mTORC1 signaling components affect Tfh differentiation.
ac, e An sgRNA library targeting a curated library of genes related to mTOR, HIF-1α, and autophagy signaling (Supplementary Data 7, 8) was screened from two separate cultures and sorts for d6 and 7 post-LCMV infection, n = 15 mice/day. Screen results were analyzed by Mageck for FDR and for L2FC to generate Z-scores. Shown are comparisons of GC Tfh to Th1 cells. Gene hits related to metabolism (b), HIF-1α (c), and mTOR (e) are highlighted in volcano plots comparing GC Tfh and Th1 cells. Blue area in (a) represents inset shown in (b, c, e). Each symbol represents the mean of all sgRNAs for one gene. d Representative flow plots, percentages, and numbers of GFP+ Tfh cells from WT or Hif1a-KO Cas9+ SMARTA cells transduced with the indicated sgRNAs, d6 post-LCMV infection., n = 5 mice/group. Data are presented as mean values +SEM. Representative data for (d) shown from 1 of 2 independent experiments. *p < 0.05 as evaluated by two-tailed unpaired Student’s t test (d). Source data provided in Source Data file and in Supplementary Data 8.
Fig. 6
Fig. 6. Increased mTORC1 activity rescues Tfh differentiation in Vhl-deficient T cells.
a Representative flow plots, percentages of Tfh cells and total gated Tfh cells from Cas9+ SMARTA cells transduced with the indicated sgRNA vector(s), on d6 post-LCMV, n = 5 mice/group. SMARTA cells were gated on GFP+Ametrine+, except for the Tsc2-sgRNA group, which was gated on GFP+. b Representative flow plots, percentages of Tfh cells and total GFP+ Tfh cells from WT or Vhl-KO SMARTA cells transduced with empty or caRHEB-expressing vector, on d6 post-LCMV infection, n = 5 mice/group. c Phospho-S6 staining in Cas9+ SMARTA cells transduced with the indicated sgRNA vector(s) and restimulated in vitro with anti-CD3 plus anti-CD28 for 4 h on d5 postactivation. d Representative flow plots, percentages of Tfh cells from Cas9+ SMARTA cells transduced with the indicated sgRNA vector(s), d6 post-LCMV, n = 5 mice/group. For Ddit4 and Pml sgRNAs, squares and triangles represent sgRNAs #1 and 2, respectively. Data in (a), (b), and (d) are presented as mean values + SEM. Representative data for (a-d) shown from 1 of at least 2 independent experiments. *p < 0.05; **p < 0.01, ***p < 0.001, ****p < 0.0001 as evaluated by two-tailed unpaired Student’s t test (a, b, d). Source data are provided in Source Data file.
Fig. 7
Fig. 7. Vhl is required for optimal Myc expression and cell proliferation.
ac WT or Vhl-KO SMARTA cells were stained with CFSE, cultured under Tfh-like conditions, and stained and analyzed on d2 or 3 as indicated. d Schematic of HIF-1α-centered negative feedback loops with mTORC1 and Myc, which are also part of a positive feedback loop with each other. Blue: genes promoting Tfh cells; Red: genes inhibiting Tfh cells. Scale represented in legend in the figure. Representative data for (a–c) shown from 1 of at least 2 independent experiments.

References

    1. Crotty S. T Follicular Helper Cell Biology: A Decade of Discovery and Diseases. Immunity. 2019;50:1132–1148. - PMC - PubMed
    1. Qi H. T follicular helper cells in space-time. Nat. Rev. Immunol. 2016;16:612–625. - PubMed
    1. Zeng H, et al. mTORC1 and mTORC2 Kinase Signaling and Glucose Metabolism Drive Follicular Helper T Cell Differentiation. Immunity. 2016;45:540–554. - PMC - PubMed
    1. Choi S-C, et al. Inhibition of glucose metabolism selectively targets autoreactive follicular helper T cells. Nat. Commun. 2018;9:4369. - PMC - PubMed
    1. Son, Y. M., Cheon, I. S., Goplen, N. P., Dent, A. L. & Sun, J. Inhibition of Stearoyl‐CoA desaturases suppresses follicular help T and germinal center B cell responses. Eur. J. Immunol. eji.201948257 (2020). - PMC - PubMed

Publication types

MeSH terms

Substances