. 2022 Feb 10;13(1):816.
doi: 10.1038/s41467-022-28421-6.

Machine learning-based integration develops an immune-derived lncRNA signature for improving outcomes in colorectal cancer

Affiliations

Machine learning-based integration develops an immune-derived lncRNA signature for improving outcomes in colorectal cancer

Zaoqu Liu et al. Nat Commun. .

Abstract

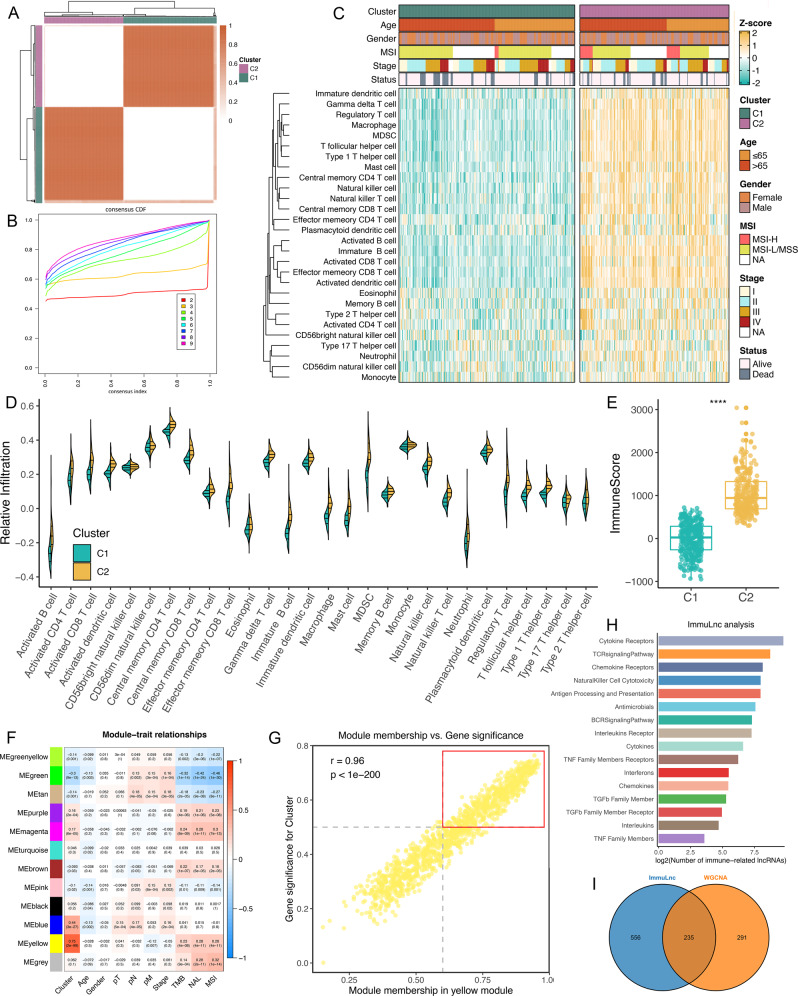
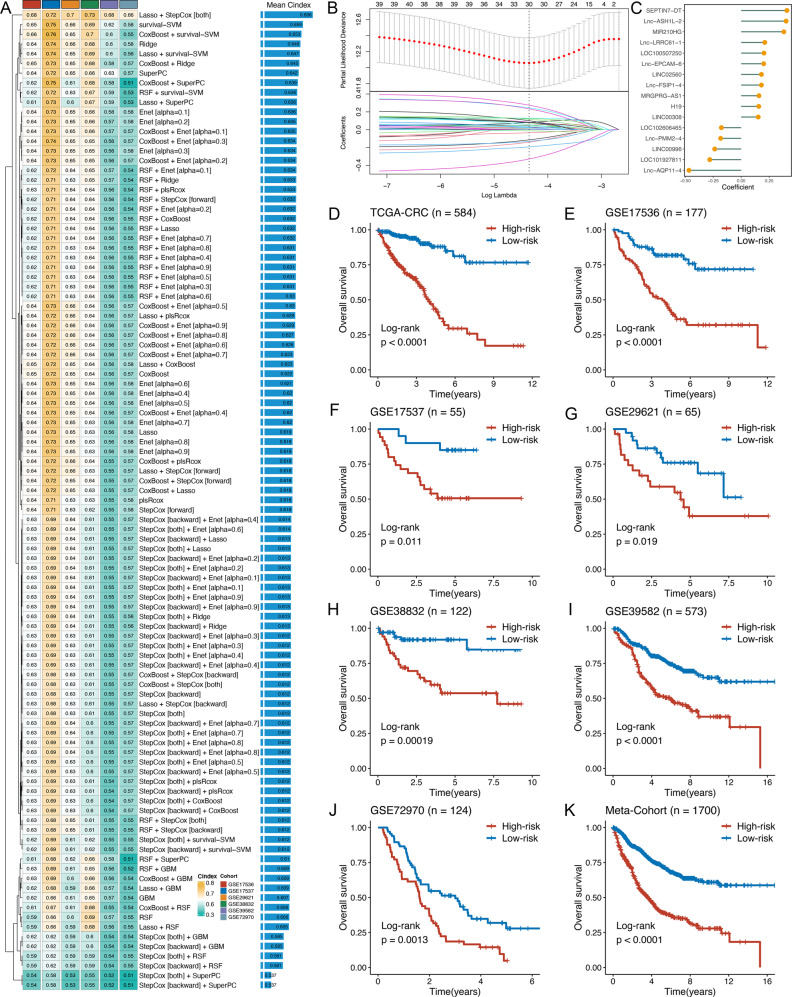
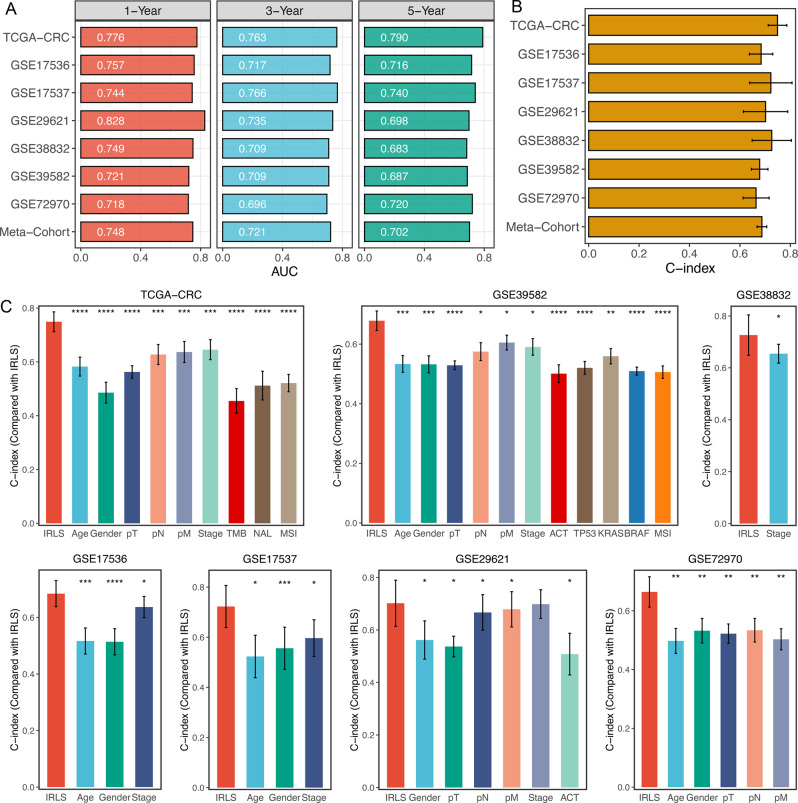
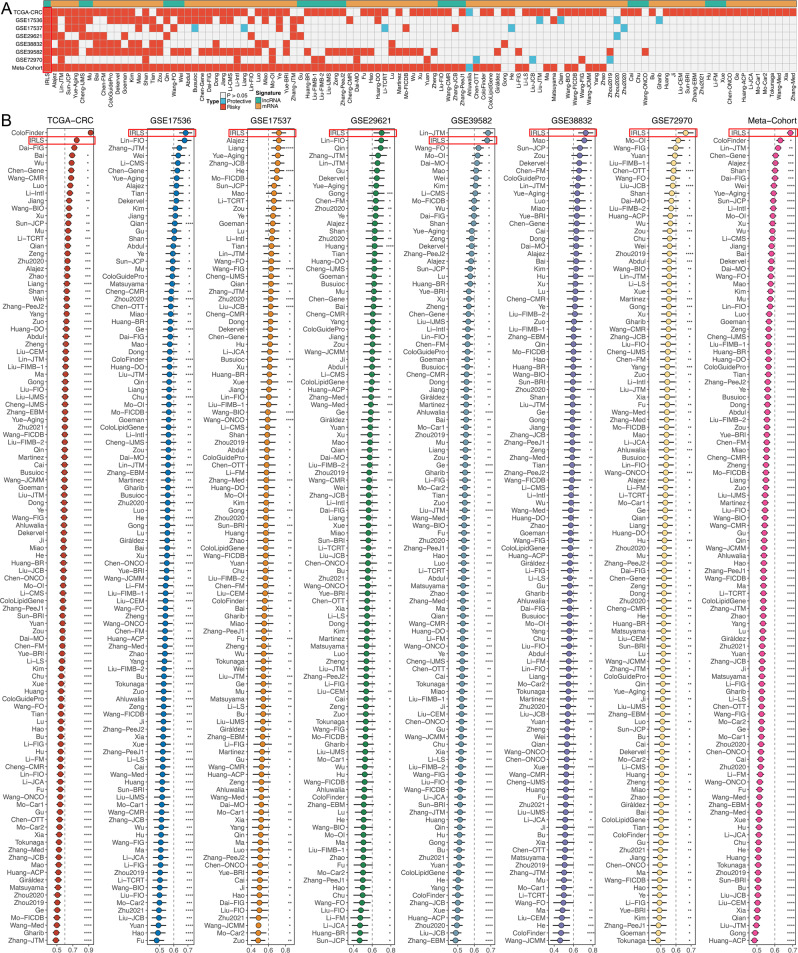
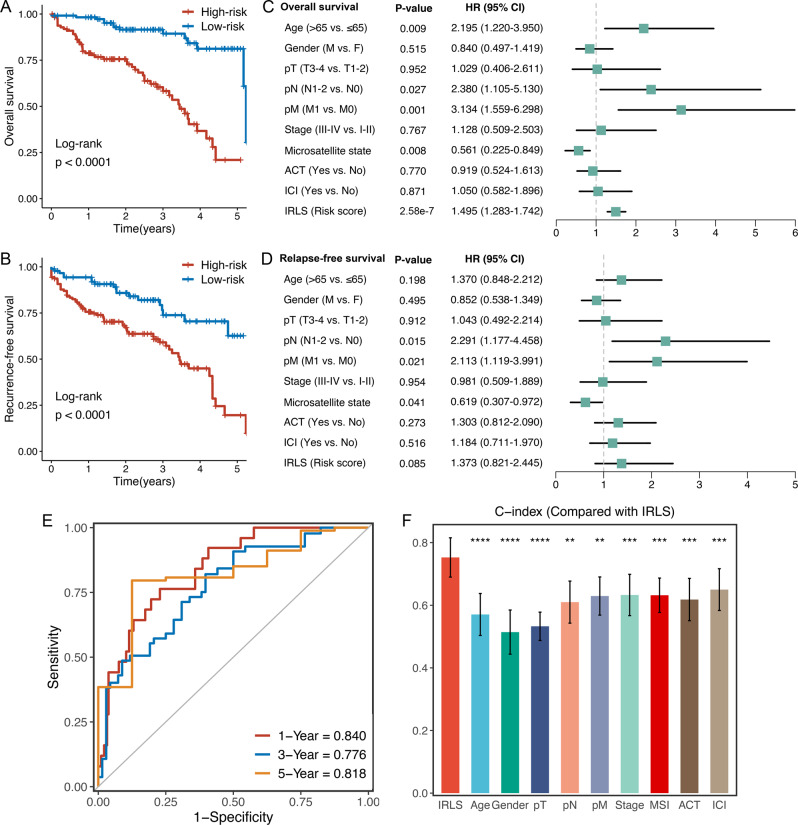
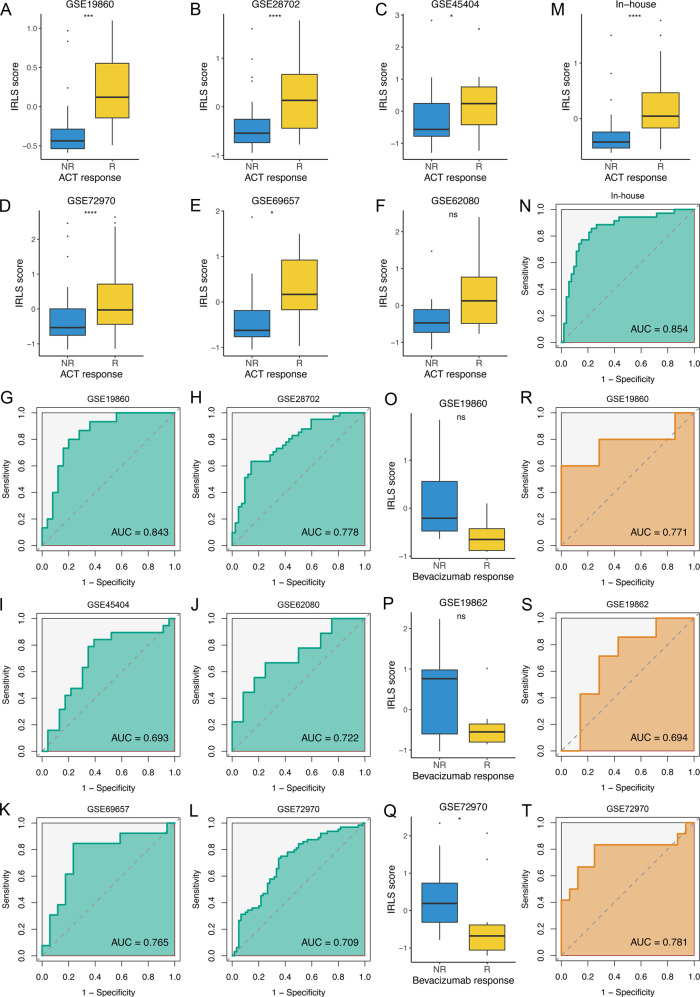
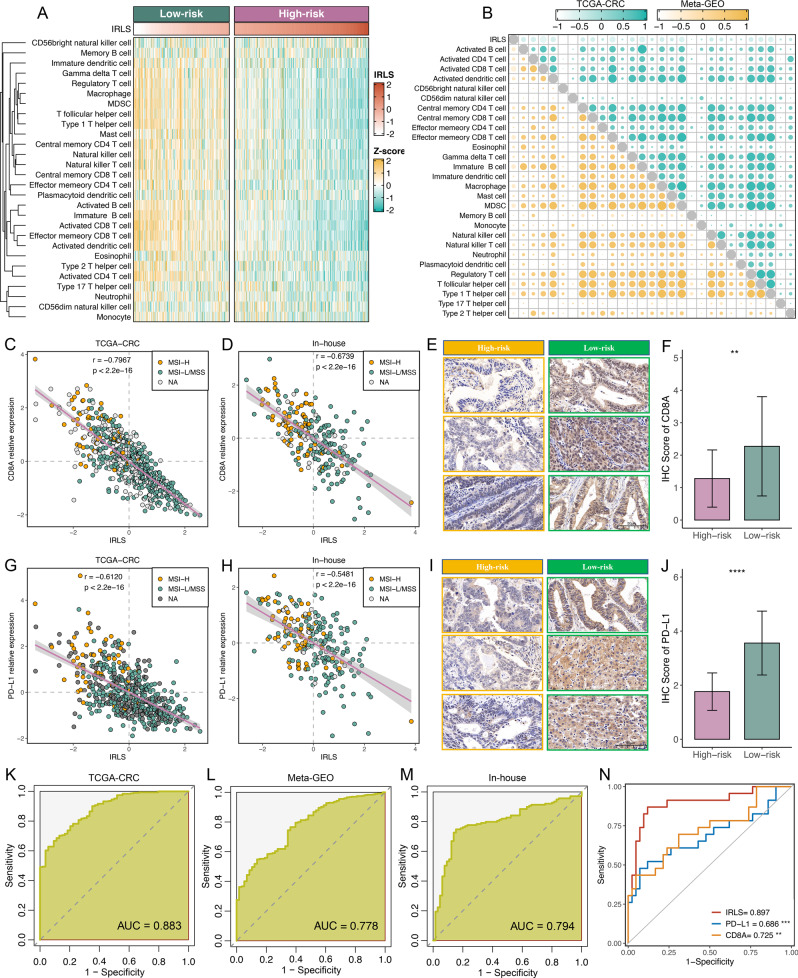
Long noncoding RNAs (lncRNAs) are recently implicated in modifying immunology in colorectal cancer (CRC). Nevertheless, the clinical significance of immune-related lncRNAs remains largely unexplored. In this study, we develope a machine learning-based integrative procedure for constructing a consensus immune-related lncRNA signature (IRLS). IRLS is an independent risk factor for overall survival and displays stable and powerful performance, but only demonstrates limited predictive value for relapse-free survival. Additionally, IRLS possesses distinctly superior accuracy than traditional clinical variables, molecular features, and 109 published signatures. Besides, the high-risk group is sensitive to fluorouracil-based adjuvant chemotherapy, while the low-risk group benefits more from bevacizumab. Notably, the low-risk group displays abundant lymphocyte infiltration, high expression of CD8A and PD-L1, and a response to pembrolizumab. Taken together, IRLS could serve as a robust and promising tool to improve clinical outcomes for individual CRC patients.


Conflict of interest statement

The authors declare no competing interests.

Figures

Fig. 1
Fig. 1. Identification of immune-related lncRNAs via two algorithms.
A The consensus score matrix of all samples when k = 2. A higher consensus score between two samples indicates they are more likely to be grouped into the same cluster in different iterations. B The CDF curves of consensus matrix for each k (indicated by colours). C The infiltration abundance of 28 immune cell subsets evaluated by ssGSEA for two clusters. D The distribution of 28 immune cell subsets infiltration between two clusters. E The distribution of immune score inferred by ESTIMATE algorithm between two clusters in the TCGA-CRC cohort (n = 584, P = 5.22e−113). Statistic test: two-sided unpaired t test. In boxplot graphs centre line indicates median, bounds of box indicate 25th and 75th percentiles, and whiskers indicate minimum and maximum. ****P < 0.0001. F Correlation analysis between module eigengenes and clinical traits. G The high correlation between GS and MM in the yellow module (P = 0). Dots within the red rectangle were defined as immune-related lncRNAs, with both high GS and MM. Statistic test: Pearson’s correlation coefficient, two-sided unpaired t test. H ImmLnc identified a total of 791 lncRNAs significantly associated with immune‐related pathways. I The overleaping lncRNAs between WGCNA and ImmLnc.
Fig. 2
Fig. 2. A consensus IRLS was developed and validated via the machine learning-based integrative procedure.
A A total of 101 kinds of prediction models via LOOCV framework and further calculated the C-index of each model across all validation datasets. B In the TCGA-CRC cohort (n = 584), the determination of the optimal λ was obtained when the partial likelihood deviance reached the minimum value, and further generated Lasso coefficients of the most useful prognostic genes. Data are presented as mean ± 95% confidence interval [CI]. C Coefficients of 16 lncRNAs finally obtained in stepwise Cox regression. DK Kaplan–Meier curves of OS according to the IRLS in TCGA-CRC (log-rank test: P = 9.16e−19) (D), GSE17536 (log-rank test: P = 2.79e−7) (E), GSE17537 (log-rank test: P = 0.011) (F), GSE29621 (log-rank test: P = 0.019) (G), GSE38832 (log-rank test: P = 1.87e−4) (H), GSE39582 (log-rank test: P = 2.06e−10) (I), GSE72970 (log-rank test: P = 0.0013) (J), and meta-cohort (log-rank test: P = 5.18e−35) (K).
Fig. 3
Fig. 3. Evaluation of the IRLS model.
ATime-dependent ROC analysis for predicting OS at 1, 3, and 5 years. B C-index of IRLS across all datasets. C The performance of IRLS was compared with other clinical and molecular variables in predicting prognosis. Statistic tests: two-sided z-score test. Data in (B, C) are presented as mean ± 95% confidence interval [CI]. *P < 0.05; **P < 0.01; ***P < 0.001; ****P < 0.0001.
Fig. 4
Fig. 4. Comparison of gene expression-based prognostic signatures in CRC.
A Univariate Cox regression analysis of IRLS and 109 published signatures in TCGA-CRC, GSE17536, GSE17537, GSE29621, GSE38832, GSE39582, GSE72970, and meta-cohort. B C-index analysis IRLS and 109 published signatures in TCGA-CRC (n = 584), GSE17536 (n = 177), GSE17537 (n = 55), GSE29621 (n = 65), GSE38832 (n = 122), GSE39582 (n = 573), GSE72970 (n = 124), and meta-cohort (n = 1700). Statistic tests: two-sided z-score test. Data are presented as mean ± 95% confidence interval [CI]. *P < 0.05; **P < 0.01; ***P < 0.001; ****P < 0.0001.
Fig. 5
Fig. 5. Validation in a clinical in-house cohort.
A, B Kaplan–Meier curves of OS (log-rank test: P = 1.93e−9) (A) and RFS (log-rank test: P = 5.23e−5) (B) according to the IRLS. C, D Multivariable Cox regression analysis of OS (C) and RFS (D) in our cohort (n = 232). Statistic test: two-sided Wald test. Data are presented as hazard ratio (HR) ± 95% confidence interval [CI]. E Time-dependent ROC analysis for predicting OS at 1, 3, and 5 years. F The performance of IRLS was compared with other clinical and molecular variables in predicting prognosis in our cohort (n = 232). Statistic tests: two-sided z-score test. Data are presented as mean ± 95% CI. **P < 0.01; ***P < 0.001; ****P < 0.0001.
Fig. 6
Fig. 6. Predictive value of fluorouracil-based ACT and bevacizumab benefits.
AF The distribution of IRLS score between responders and nonresponders of fluorouracil-based ACT in GSE19860 (n = 40, P = 1.70e–4) (A), GSE28702 (n = 83, P = 1.42e−5) (B), GSE45404 (n = 42, P = 0.033) (C), GSE72970 (n = 124, P = 5.29e−5) (D), GSE69657 (n = 30, P = 0.015) (E), and GSE62080 (n = 21, P = 0.095) (F). Statistic tests: two-sided t test. G-L ROC curves of IRLS to predict the benefits of fluorouracil-based ACT in GSE19860 (G), GSE28702 (H), GSE45404 (I), GSE62080 (J), GSE69657 (K), and GSE72970 (L). M The distribution of IRLS score between responders and nonresponders of fluorouracil-based ACT in in-house cohort (n = 88, P = 7.64e−6). Statistic test: two-sided t test. N ROC curves of IRLS to predict the benefits of fluorouracil-based ACT in in-house cohort. OQ The distribution of IRLS score between responders and nonresponders of bevacizumab in GSE19860 (n = 12, P = 0.106) (O), GSE19862 (n = 14, P = 0.318) (P), and GSE72970 (n = 28, P = 0.011) (Q). Statistic tests: two-sided t test. RT ROC curves of IRLS to predict the benefits of bevacizumab in GSE19860 (R), GSE19862 (S), and GSE72970 (T). In boxplot graphs (AF, M, OQ) centre line indicates median, bounds of box indicate 25th and 75th percentiles, and whiskers indicate minimum and maximum. nsP > 0.05; *P < 0.05; ***P < 0.001; ****P < 0.0001.
Fig. 7
Fig. 7. Implications of IRLS for ICI treatment.
A The relationship between IRLS and immune cell infiltrations in TCGA-CRC. B Chorograms were derived based on Pearson r value between IRLS and immune cell infiltrations in TCGA-CRC and Meta-GEO. C, D Scatterplots between IRLS and CD8A expression with microsatellite state were shown in TCGA-CRC (n = 584, P = 5.20e−15) (C) and in-house cohort (n = 232, P = 4.45e−32) (D). Statistic test: Pearson’s correlation coefficient, two-sided unpaired t test. Data are presented as mean ± 95% confidence interval [CI]. E Representative IHC staining images of CD8A between two risk groups (n = 104). Scale bars = 50 μm. F Analysis of IHC scores between two risk groups according to CD8A staining results (n = 104, P = 0.009). Statistic test: two-sided unpaired t test. Data are presented as mean ± 95% CI. G, H. Scatterplots between IRLS and PD-L1 expression with microsatellite state were shown in TCGA-CRC (n = 584, P = 1.30e−30) (G) and in-house cohort (n = 232, P = 1.37e−19) (H). Statistic test: Pearson’s correlation coefficient, two-sided unpaired t test. Data are presented as mean ± 95% CI. I Representative IHC staining images of PD-L1 between two risk groups (n = 104). Scale bars = 50 μm. J Analysis of IHC scores between two risk groups according to PD-L1 staining results (n = 104, P = 1.34e−5). Statistic test: two-sided unpaired t test. Data are presented as mean ± 95% CI. KM ROC curves of IRLS to predict the dMMR/MSI-H phenotype in TCGA-CRC (K), Meta-GEO (L), and in-house cohort (M). N ROC curves of IRLS, PD-L1, and CD8A to predict the benefits of pembrolizumab. Statistic test: two-sided unpaired DeLong test. **P < 0.01; ***P < 0.001; ****P < 0.0001.

References

    1. Sung H, et al. Global cancer statistics 2020: GLOBOCAN estimates of incidence and mortality worldwide for 36 cancers in 185 countries. Cancer J. Clin. 2021;68:394–424. - PubMed
    1. Koncina E, Haan S, Rauh S, Letellier E. Prognostic and predictive molecular biomarkers for colorectal cancer: updates and challenges. Cancers. 2020;12:2–319. - PMC - PubMed
    1. Weiser MR. AJCC 8th edition: colorectal cancer. Ann. Surg. Oncol. 2018;25:1454–1455. - PubMed
    1. Mahoney KM, Rennert PD, Freeman GJ. Combination cancer immunotherapy and new immunomodulatory targets. Nat. Rev. Drug Discov. 2015;14:561–584. - PubMed
    1. Gibney GT, Weiner LM, Atkins MB. Predictive biomarkers for checkpoint inhibitor-based immunotherapy. Lancet Oncol. 2016;17:e542–e551. - PMC - PubMed

Publication types