. 2022 Feb 10;13(1):783.
doi: 10.1038/s41467-022-28355-z.

A mammalian methylation array for profiling methylation levels at conserved sequences

Affiliations

A mammalian methylation array for profiling methylation levels at conserved sequences

Adriana Arneson et al. Nat Commun. .

Abstract

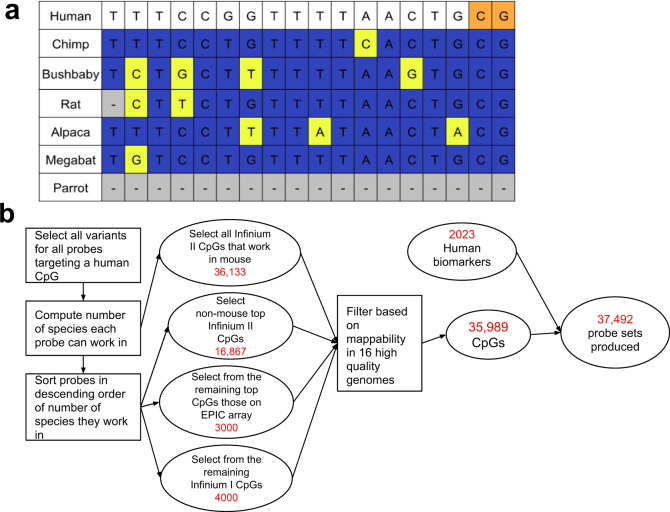
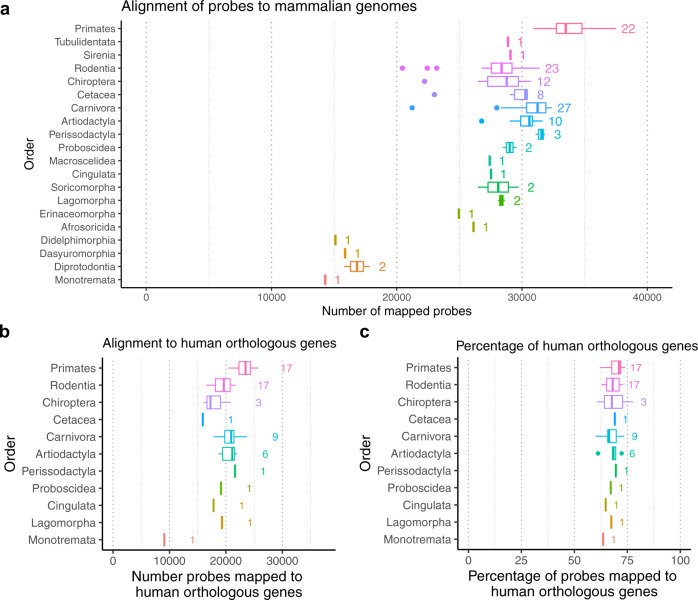
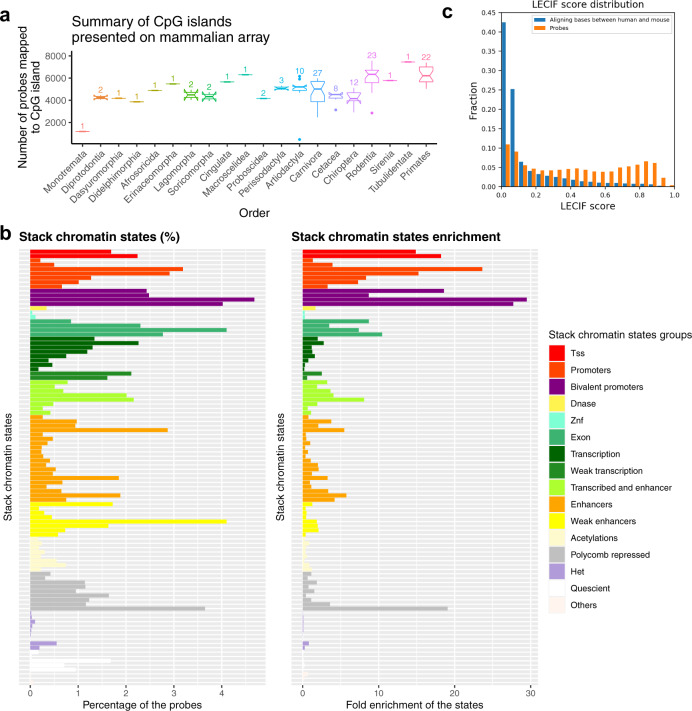
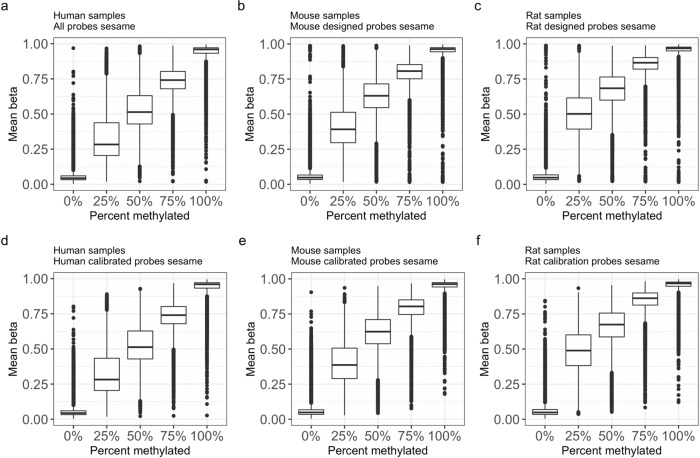
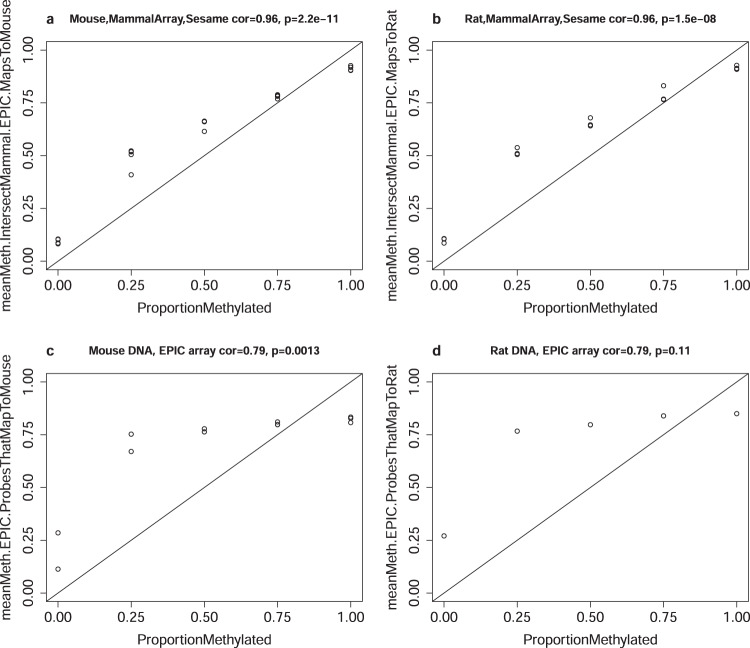
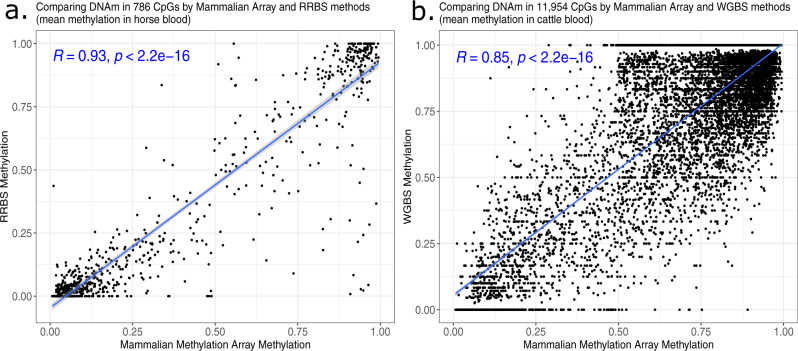
Infinium methylation arrays are not available for the vast majority of non-human mammals. Moreover, even if species-specific arrays were available, probe differences between them would confound cross-species comparisons. To address these challenges, we developed the mammalian methylation array, a single custom array that measures up to 36k CpGs per species that are well conserved across many mammalian species. We designed a set of probes that can tolerate specific cross-species mutations. We annotate the array in over 200 species and report CpG island status and chromatin states in select species. Calibration experiments demonstrate the high fidelity in humans, rats, and mice. The mammalian methylation array has several strengths: it applies to all mammalian species even those that have not yet been sequenced, it provides deep coverage of conserved cytosines facilitating the development of epigenetic biomarkers, and it increases the probability that biological insights gained in one species will translate to others.


Conflict of interest statement

The Regents of the University of California filed a patent application (publication number WO2020150705) related to this work for which A.A., B.B., J.E. and S.H. are named inventors. S.H. is a founder of the non-profit Epigenetic Clock Development Foundation, which has licensed several patents from his employer UC Regents, and distributes the mammalian methylation array. Bret Barnes is an employee for Illumina Inc which manufactures the mammalian methylation array. The remaining authors declare no competing interests.

Figures

Fig. 1
Fig. 1. Overview of mammalian methylation array design process.
a Toy example of a multiple sequence alignment at a CpG site being considered by the CMAPS algorithm. The orange coloring highlights the CpG being targeted. Positions, where other species have alignment that matches the human sequence, are in dark blue; positions, where other species have alignment that does not match the human sequence, are in neon yellow; positions, where other species have no alignment, are in gray. b Flowchart detailing the selection of probes on the array by the CMAPS algorithm. A small fraction of probes designed were dropped during the manufacturing process. The number of selected CpGs in different sets were determined by biological considerations (e.g., sufficient numbers of Type I probes to capture CpG rich regions), statistical considerations (sufficient numbers of Type I probes for normalization methods), and costs of the resulting array (fewer than 40 K CpGs resulted in tolerable costs and Type II probes being more cost-effective than Type I probes).
Fig. 2
Fig. 2. CpG and gene coverage of probes on the mammalian methylation array across different phylogenetic orders.
a Probe localization based on the QuasR package. The rows correspond to different phylogenetic orders. The phylogenetic orders are ordered based on the phylogenetic tree and increasing distance to human. The x axis reports the median number of mapped probes across species from the given phylogenetic order. The number to the right of each boxplot reports the number of species per order, e.g., n = 22 primate species. b The number of probes mapped to human orthologous genes for the subset of genomes in the Ensembl database (x axis). n = 17 genomes were used for primates. c Percentage of the probes associated with human orthologous genes among mapped probes for the species in b. The boxplot visualizes the median (vertical line in box) and upper and lower quartiles (25th and 75th percentile). The whiskers represent at most the 1.5*interquartile range of each order by extending to the most extreme data point that is no more than 1.5 times the interquartile range from the box.
Fig. 3
Fig. 3. CpG island and chromatin state analysis of mammalian methylation probes.
We characterize the CpGs located on the mammalian methylation array regarding a CpG island status in different phylogenetic orders, b chromatin state analysis, and c Learning Evidence of Conservation from Integrated Functional genomic annotations (LECIF) score of evidence of human-mouse conservation at the functional genomics level. a Each boxplot depicts the median number of CpGs that map to CpG islands in mammalian species of a given phylogenetic order (x axis). The lower and upper bound of each box visualizes the lower and upper quartile of the distribution. The notch around the median number of CpGs (horizontal line inside box) depicts the 95% confidence interval. The whiskers extend to the most extreme data point, that is, no more than 1.5 times the interquartile range from the box. The numbers above each box report the number of analyzed species in each order, e.g., n = 22 primate species. b Mammalian methylation array enrichment for universal chromatin state annotations. (Left) Distribution of probe overlap with a universal chromatin state annotation by the stacked modeling approach of ChromHMM applied to data from more than 100 cell or tissue types. Bars are colored based on their state corresponding state group as indicated by the legend on right. (Right) The same as left, but showing the fold enrichments of the state relative to a uniform background. The strongest enrichment is seen for some bivalent promoter states. A version of the figure with individual states labeled can be found in Supplementary Fig. 6. TSS, transcriptional start site; DNase, DNase I hypersensitivity; znf, zinc finger genes; Het, heterochromatin. c Comparison of distribution of LECIF score for probes on the array (orange) and aligning bases between human and mouse (blue). The LECIF score has been binned as shown on the x axis, and the fraction of probes or aligning bases with scores in that bin are shown on the y axis.
Fig. 4
Fig. 4. Distribution of beta values after SeSaMe normalization.
ac Distribution of beta values (relative intensity) of all probes on the array after SeSaMe normalization for a human samples, b mouse samples, and c rat samples. These cytosines are based on the CMAPS design criteria, i.e., a n = 35,453 human cytosines, b n = 21,900 mouse cytosines, c n = 18,157 rat cytosines. df Analogous to ac but based on mappable cytosines from QuasR and after using calibration data to identify and remove severely outlying cytosines. Specifically, the lower panels use respective subsets of cytosines whose Pearson correlation with Percent methylated exceeds 0.8, which was: n = 37,152 CpGs for human, n = 27,966 for mouse, and n = 25,669 for rat. Beta-valued distributions are heteroscedastic in that distributions at a fractional methylation value close to 0.5 are expected to have a higher variance than those at fractional value close to zero or 1. Based on the binomial distribution, one would expect that the variance and mean value across of the SeSaMe normalized beta values across designed CpGs follow the following relationship: variance = constant*mean*(1 − mean). Indeed, in a separate analysis, we find that the left-hand side (variance) is highly correlated with the mean*(1 − mean) in mice (Pearson correlation r = 0.92), rats (r = 0.95), and humans (r = 0.86). It can be advisable to use statistical models and distributions that model the over-dispersion inherent in these data. Both array and sequencing methods that use bisulfite conversion followed by amplification can lead to biases in the ratio of converted to unconverted strands (beta values), which could explain the broad peaks we see in the estimate of calibration data. Each boxplot visualizes the median value and the upper and lower quartile. The whiskers extend to the most extreme data point, that is, no more than 1.5 times the interquartile range from the box.
Fig. 5
Fig. 5. Calibration data: mean methylation across probes shared between the human EPIC array and the mammalian array.
The mammalian methylation array contained 5574 probes targeting the same CpG that can also be found on the human EPIC array that was not included based on being human biomarkers. However, the mammalian array probes were engineered differently than EPIC probes so that they would more likely work across mammals. By applying both array types to calibration data, we are able to compare the calibration of the overlapping probes in mice (a, c) and rats (b, d). Upper panels (a, b) and lower panels (c, d) present the results for the mammalian array and the EPIC array, respectively. The benchmark measure (ProportionMethylated, x axis) versus the mean methylation value (y axis) across 4341 CpGs that map to mice (a, c) and 3948 CpGs that map to rats (b, d). The CpGs used to compute the mean (i) are present on the human EPIC array, (ii) present on the mammalian array, and (iii) apply to the respective species according to the mappability analysis genome coordinate file. Sample sizes: n = 20 arrays for mice (a, c) and n = 15 arrays for rats (b, d). The title reports the Pearson correlation coefficients and two-sided p-values calculated using a Student’s t-test.
Fig. 6
Fig. 6. Comparison with RRBS data from horse blood and WGBS from cattle blood.
Each dot corresponds to a cytosine. Mean methylation level in blood according to the mammalian array (x axis) versus corresponding mean values according to a reduced representation bisulfite sequencing and b whole-genome bisulfite sequencing in blood from horse and cattle, respectively. The mammalian methylation array data come from horse blood and cattle blood. a The y axis reports the mean methylation levels in RRBS data from n = 18 whole blood samples from horses. The RRBS sequence reads were downloaded from the SRA database under bioproject No. PRJNA517684 (processing described in methods). The analysis was restricted to 786 CpGs that could be mapped to both platforms. b mean methylation levels in WGBS data (y axis) from n = 2 blood samples from Holstein cattle,. The WGBS data are available from Gene Expression Omnibus (GSE147087). Only CpGs with sufficient read count (at least 3) were considered. The analysis was restricted to the 11,954 CpGs that could be mapped in both platforms. The blue text reports Pearson correlation coefficients and two-sided p-values calculated using a Student’s t-test. The two-sided p-values are at the numerical limitation of the correlation test function in R, thus capped at p < 2.2e−16. The blue line and shaded area correspond to a regression line and the 95% confidence interval, respectively, as determined by the default values of the R function geom_smooth.

Similar articles

Cited by

References

    1. Smith ZD, Meissner A. DNA methylation: roles in mammalian development. Nat. Rev. Genet. 2013;14:204–220. - PubMed
    1. Bibikova, M. et al. Genome-wide DNA methylation profiling using Infinium((R)) assay. Epigenomics. 1, 10.2217/epi.09.14 (2009). - PubMed
    1. Bibikova M, et al. High density DNA methylation array with single CpG site resolution. Genomics. 2011;98:288–295. - PubMed
    1. Meissner A, et al. Reduced representation bisulfite sequencing for comparative high-resolution DNA methylation analysis. Nucleic Acids Res. 2005;33:5868–5877. - PMC - PubMed
    1. Morselli M, et al. Targeted bisulfite sequencing for biomarker discovery. Methods. 2021;187:13–27. - PMC - PubMed

Publication types