. 2022 Feb 10;13(1):791.
doi: 10.1038/s41467-022-28452-z.

Copy number amplification of ENSA promotes the progression of triple-negative breast cancer via cholesterol biosynthesis

Affiliations

Copy number amplification of ENSA promotes the progression of triple-negative breast cancer via cholesterol biosynthesis

Yi-Yu Chen et al. Nat Commun. .

Abstract

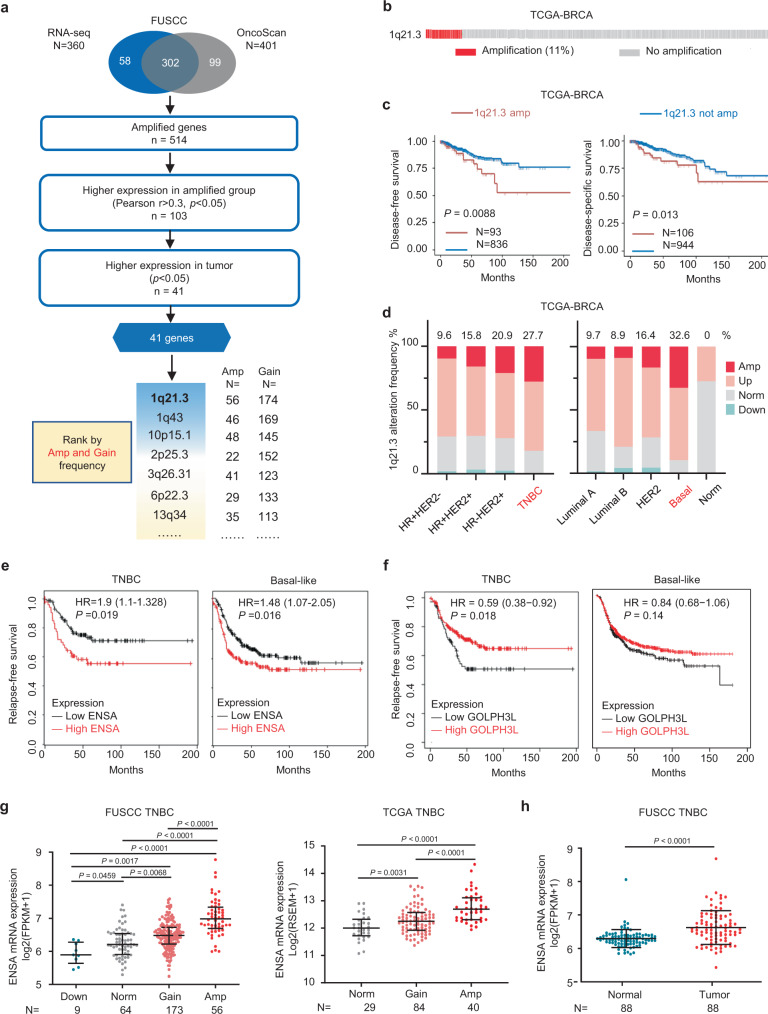
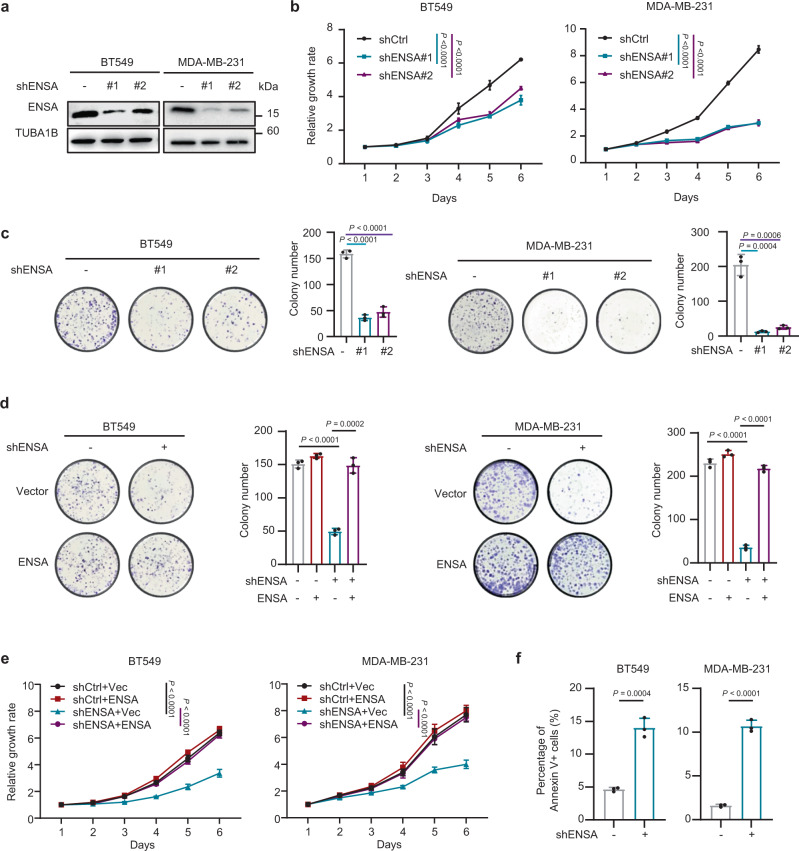
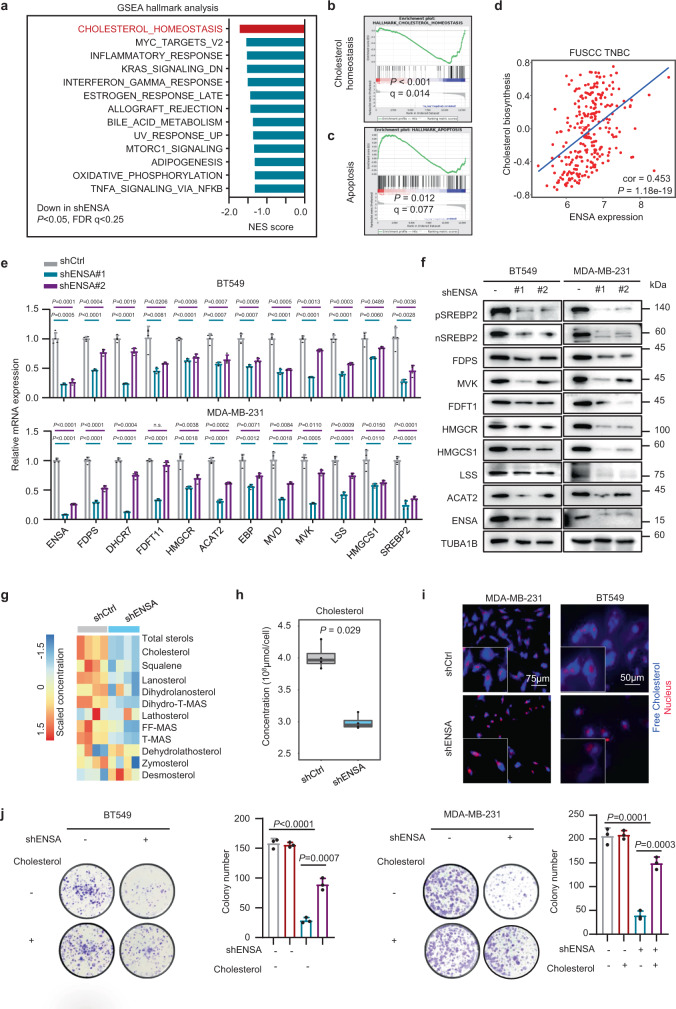
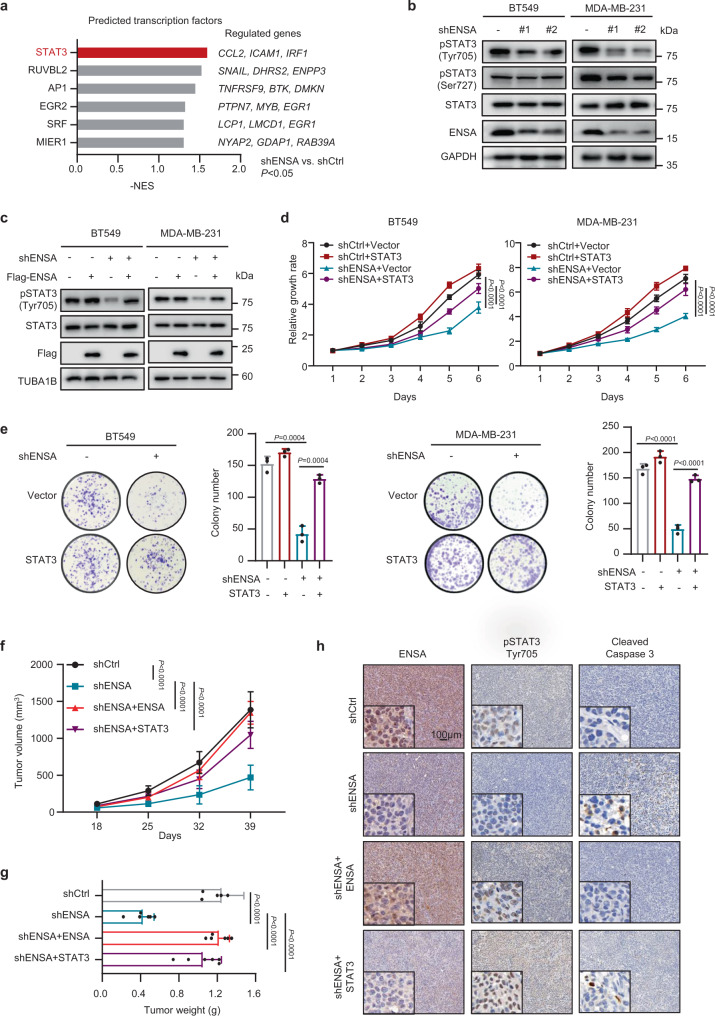
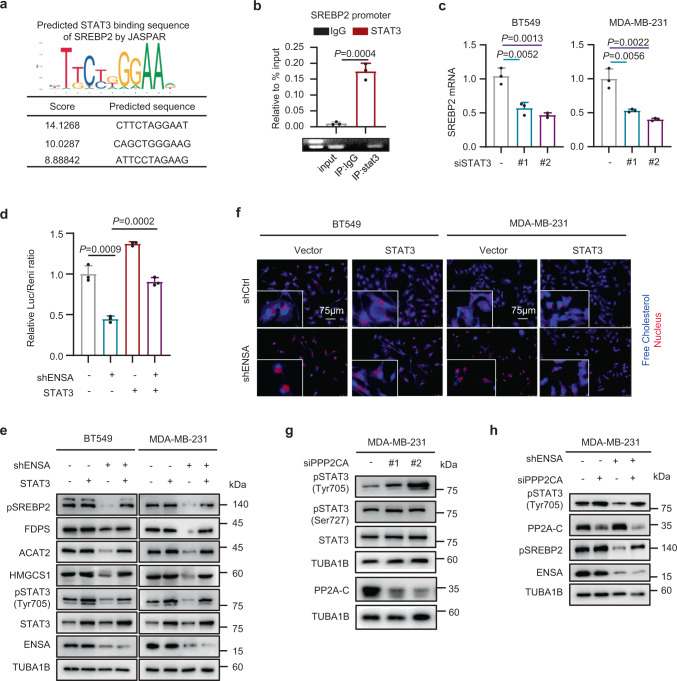
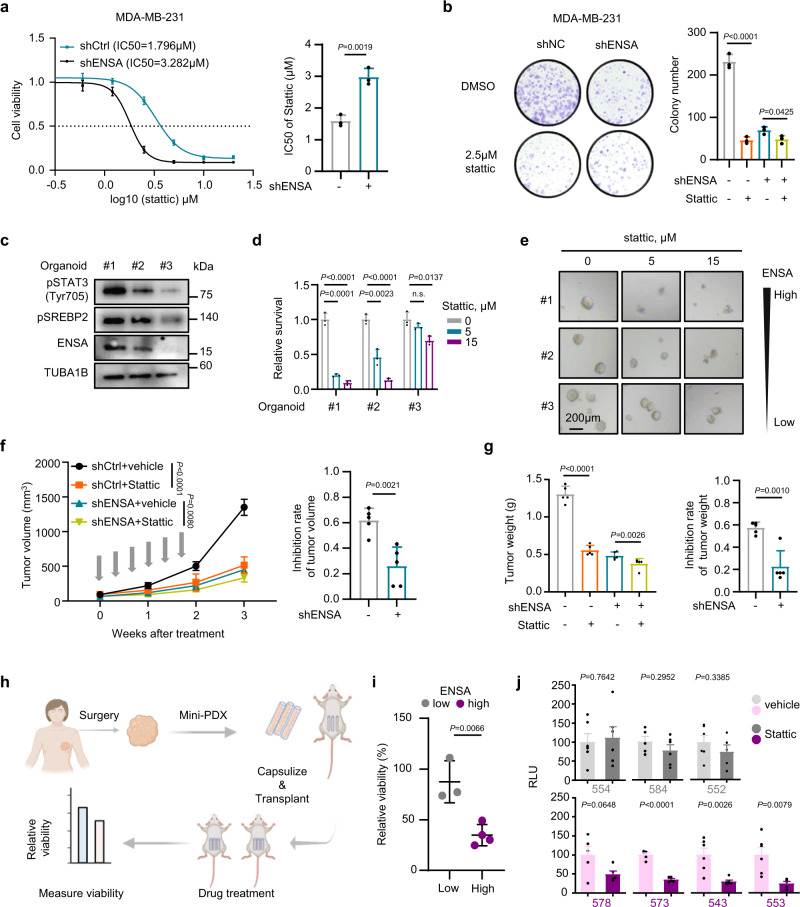
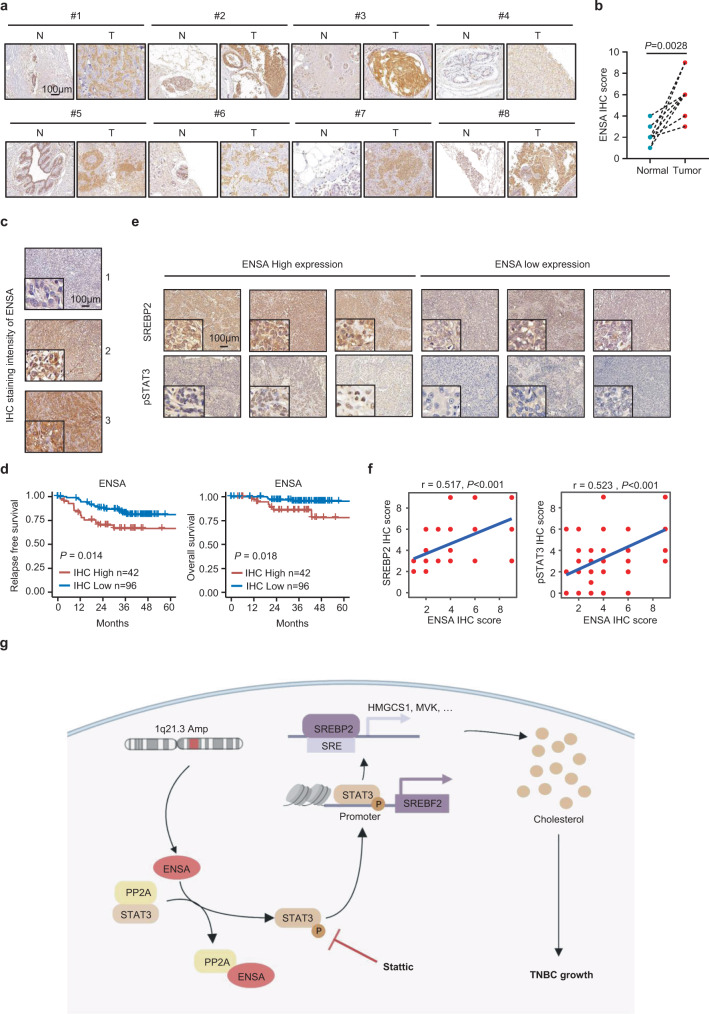
Copy number alterations (CNAs) are pivotal genetic events in triple-negative breast cancer (TNBC). Here, our integrated copy number and transcriptome analysis of 302 TNBC patients reveals that gene alpha-endosulfine (ENSA) exhibits recurrent amplification at the 1q21.3 region and is highly expressed in TNBC. ENSA promotes tumor growth and indicates poor patient survival in TNBC. Mechanistically, we identify ENSA as an essential regulator of cholesterol biosynthesis in TNBC that upregulates the expression of sterol regulatory element-binding transcription factor 2 (SREBP2), a pivotal transcription factor in cholesterol biosynthesis. We confirm that ENSA can increase the level of p-STAT3 (Tyr705) and activated STAT3 binds to the promoter of SREBP2 to promote its transcription. Furthermore, we reveal the efficacy of STAT3 inhibitor Stattic in TNBC with high ENSA expression. In conclusion, the amplification of ENSA at the 1q21.3 region promotes TNBC progression and indicates sensitivity to STAT3 inhibitors.


Conflict of interest statement

The authors declare no competing interests.

Figures

Fig. 1
Fig. 1. ENSA is amplified at the 1.21.3 region, is highly expressed and predicts poor survival in TNBC.
a Schematic diagram depicting the screening for copy number alteration-affected genes in TNBC. b Copy number alteration profile of the 1q21.3 region in the TCGA breast cancer cohort. c Kaplan–Meier survival analysis of 1q21.3 copy number alterations in TCGA breast cancer patients. Log-rank test. d 1q21.3 alteration frequency in the TCGA cohort with different breast cancer subtypes. e, f Kaplan–Meier plots of ENSA and GOLPH3L in TNBC or basal-like BC (https://kmplot.com/analysis/). Log-rank test. g ENSA expression of samples with different ENSA copy number in FUSCC and TCGA TNBC cohorts. n = 302 in FUSCC TNBC cohort and n = 153 in TCGA TNBC cohort. Data are presented as mean ± SD. Two-tailed one-way ANOVA tests and adjustments were made for multiple comparisons. h ENSA expression of 88 paired tumor tissues versus adjacent normal tissues in FUSCC cohort. n = 88 paired samples. Data are presented as mean ± SD. Two-tailed paired Student’s t test. Source data are provided as a Source Data file. FUSCC Fudan University Shanghai Cancer Center, TCGA The Cancer Genome Atlas, TNBC triple-negative breast cancer, BRCA breast cancer, FPKM fragments per kilobase million, RSEM RNA-seq by expectation maximization, Amp amplification, Norm normal.
Fig. 2
Fig. 2. ENSA is a major driver of TNBC cell growth.
a Stable silencing of ENSA expression in the TNBC cell lines BT549 and MDA-MB-231. b In vitro growth curves of BT549 and MDA-MB-231 cells expressing control or ENSA shRNA. n = 6. Data are presented as mean ± SD. Two-tailed two-way ANOVA tests. c Colony formation of BT549 and MDA-MB-231 cells expressing control or ENSA shRNA. n = 3. Data are presented as mean ± SD. Two-tailed unpaired Student’s t tests. d Colony formation of BT549 and MDA-MB-231 cells ± ENSA knockdown and ± ENSA overexpression. n = 3. Data are presented as mean ± SD. Two-tailed unpaired Student’s t tests. e In vitro growth curves of BT549 and MDA-MB-231 cells ± ENSA knockdown and ± ENSA overexpression. n = 6. Data are presented as mean ± SD. Two-tailed two-way ANOVA tests. f Apoptosis levels were measured in BT549 and MDA-MB-231 cells expressing control or ENSA shRNA. Percentage of annexin V+ cells are shown. n = 3. Data are presented as mean ± SD. Two-tailed unpaired Student’s t tests. Source data are provided as a Source Data file.
Fig. 3
Fig. 3. ENSA plays a crucial role in cholesterol biosynthesis in TNBC.
a GSEA of downregulated pathways after ENSA knockdown in MDA-MB-231 cells. The top 10 pathways (P < 0.05 and FDR q < 0.25) ranked by absolute normalized enrichment scores are shown. NES score and nominal P-value were given by GSEA software. b Enrichment plot of the cholesterol homeostasis pathway after ENSA knockdown in MDA-MB-231 cells. c Enrichment plot of the apoptosis pathway after ENSA knockdown in MDA-MB-231 cells. d Scatter plot showing the correlation of ENSA expression with the cholesterol biosynthesis pathway score in FUSCC TNBC data identified by ‘gsva’ method. Correlation coefficients were calculated using the Pearson test. Two-tailed P-values were given. e qRT-PCR analysis of the relative transcript levels of cholesterol biosynthesis pathway genes after ENSA knockdown in MDA-MB-231 cells. n = 4. Data are presented as mean ± SD. Two-tailed unpaired Student’s t tests. f Western blotting images showing proteins involved in the cholesterol biosynthesis pathway after ENSA knockdown in MDA-MB-231 cells. n = 3 independent experiments. g Heatmap displaying the concentration of cholesterol and intermediates in the cholesterol biosynthesis pathway after ENSA knockdown in MDA-MB-231 cells. n = 4. h Total cellular cholesterol contents in MDA-MB-231 cells were analyzed by LC-MS with normalization to cell quantity. n = 4. The center line corresponded to the median, the lower and upper hinges corresponded to the first and third quartiles, and the upper/lower whisker extends from the hinge to the largest/smallest value no further than 1.5 times interquartile range. Two-tailed unpaired Wilcoxon test. i Filipin III staining showing the cellular free cholesterol content in MDA-MB-231 and BT549 cells with ENSA knockdown. n = 3 independent experiments. j Colony formation of BT549 and MDA-MB-231 cells expressing control or ENSA shRNA after treatment with 2.5 μg/ml exogeneous cholesterol. n = 3. Data are presented as mean ± SD. Two-tailed unpaired Student’s t tests. Source data are provided as a Source Data file. GSEA gene set enrichment analysis, NES normalized enrichment score.
Fig. 4
Fig. 4. ENSA promotes tumor growth by activating STAT3.
a Candidate transcription factor (TF) prediction performed by GSEA of regulatory target gene sets. The top 6 TFs (P < 0.05) ranked by absolute normalized enrichment scores are shown. NES score and nominal P-value were given by GSEA software. b Western blotting images showing the protein levels of phosphorylated STAT3 (pSTAT3)-Tyr705, pSTAT3-Ser727 and total STAT3 after ENSA knockdown in BT549 and MDA-MB-231 cells. n = 3 independent experiments. c Western blotting images showing the protein levels of pSTAT3-Tyr705 and total STAT3 in BT549 and MDA-MB-231 cells ± ENSA knockdown and ± ENSA overexpression. n = 3 independent experiments. d In vitro growth curves of BT549 and MDA-MB-231 cells ± ENSA knockdown and ± STAT3 overexpression. n = 6. Data are presented as mean ± SD. Two-tailed two-way ANOVA tests. e Colony formation of BT549 and MDA-MB-231 cells ± ENSA knockdown and ± STAT3 overexpression. n = 3. Data are presented as mean ± SD. Two-tailed unpaired Student’s t tests. f In vivo growth curve of tumors (n = 6) generated by injecting MDA-MB-231 cells expressing control or ENSA shRNA and rescued by ENSA or STAT3 overexpression. n = 6 mice per group. Data are presented as mean ± SD. Two-tailed two-way ANOVA tests. g Tumor weight of MDA-MB-231 cells (n = 6) expressing control or ENSA shRNA rescued by ENSA or STAT3 overexpression. n = 6 mice per group. Data are presented as mean ± SD. Two-tailed unpaired Student’s t tests. h Immunohistochemical images of ENSA, pSTAT3-Tyr705, and cleaved caspase 3 in mammary fat pad xenograft models. Scale bar: 100 µm. Source data are provided as a Source Data file. NES normalized enrichment score.
Fig. 5
Fig. 5. ENSA activates STAT3 to promote the transcription of SREBP2 in a PP2A-dependent manner.
a JASPAR prediction of STAT3-binding sites on the sequence of SREBP2. b qRT-PCR and PCR analysis of STAT3 at the SREBP2 promoter after ChIP assays in MDA-MB-231 cells expressing control or ENSA shRNA. n = 3. Data are presented as mean ± SD. Two-tailed unpaired Student’s t tests. c qRT-PCR detecting relative SREBP2 mRNA expression in BT549 and MDA-MB-231 cells after STAT3 transient silencing. n = 3. Data are presented as mean ± SD. Two-tailed unpaired Student’s t tests. d Luciferase reporter assay detecting the activity of the SREBP2 promoter in BT549 cells ± ENSA knockdown and ± STAT3 overexpression. n = 3. Data are presented as mean ± SD. Two-tailed unpaired Student’s t tests. e Western blotting images showing the expression of enzymes involved in cholesterol biosynthesis, SREBP2, pSTAT3-Tyr705 and total STAT3 in BT549 and MDA-MB-231 cells with ± ENSA knockdown and ± STAT3 overexpression. n = 3 independent experiments. f Filipin III staining showing the cellular free cholesterol contents of BT549 and MDA-MB-231 cells ± ENSA knockdown and ± STAT3 overexpression. n = 3 independent experiments. g Western blotting images showing the expression of STAT3, pSTAT3-Tyr705, and pSTAT3-Ser727 in MDA-MB-231 cells expressing control or PPP2CA siRNA. n = 3 independent experiments. h Western blotting images showing the expression of pSTAT3-Tyr705 and SREBP2 in MDA-MB-231 cells ± ENSA knockdown and ± transient PPP2CA knockdown. n = 3 independent experiments. Source data are provided as a Source Data file.
Fig. 6
Fig. 6. ENSA is linked to Stattic sensitivity in TNBC.
a Dose–response curves and half maximal inhibition concentration values of Stattic in MDA-MB-231 cells expressing control or ENSA shRNA. Dose-response curves: n = 6; Data are presented as mean ± SD. Bar plot: n = 3 independent experiments; Data are presented as mean ± SD; Two-tailed unpaired Student’s t test. b Clonogenic survival assays of MDA-MB-231 cells expressing control or ENSA shRNA and treated with 2.5 μM Stattic. n = 3. Data are presented as mean ± SD. Two-tailed unpaired Student’s t test. c Western blotting images showing the expression of pSTAT3-Tyr705, SREBP2, and ENSA in three organoids. n = 3 independent experiments. d, e Results of the cell viability assay in three TNBC patient-derived organoid models treated with 0, 5, and 15 µM Stattic. d Cell viability assay and (e) Representative bright-field images of organoids after drug treatment in three organoids. Scale bars, 200 µm. n = 3. Data are presented as mean ± SD. Two-tailed unpaired Student’s t test. fg Stattic treatment of MDA-MB-231 cells expressing control or ENSA shRNA. Briefly, we injected shCtrl or shENSA MDA-MB-231 cells into the mammary fat pad of female NOD/SCID mice (n = 10 each). When the tumor volume reached 50–100 mm3, each group was randomly assigned to two treatment groups: vehicle and Stattic. All groups (n = 5 each) received treatment (vehicle or 10 mg/kg Stattic) three times per week after randomization. The gray arrows indicate the treatments. f The growth curve (left) and the inhibition rate of tumor volume (right). n = 5 mice per group. Data are presented as mean ± SD. Two-way ANOVA test for growth curve and two-tailed unpaired Student’s t test for inhibition rate. g The tumor weight (left) and the inhibition rate of tumor weight (right). n = 5 mice per group. Data are presented as mean ± SD. Two-tailed unpaired Student’s t test. h Scheme of the generation of the mini-PDX models for the in vivo pharmacological tests. i The relative viability of seven TNBC mini-PDX models with Stattic treatment, as normalized to vehicle treatment. n = 3 in low-ENSA group and n = 4 in high-ENSA group. Data are presented as mean ± SD. Two-tailed unpaired Student’s t test. j The relative luminance unit of each TNBC mini-PDX model treated with Stattic or vehicle. n = 5 or 6 independent capsules; Data are presented as mean ± SD. Two-tailed unpaired Student’s t test. Source data are provided as a Source Data file. n.s. not significant, Mini-PDX mini-patient-derived xenograft, RLU relative luminance unit.
Fig. 7
Fig. 7. Correlations among ENSA, SREBP2, pSTAT3-Tyr705 and survival in clinical samples.
a, b Representative IHC images (a) and IHC scores (b) of ENSA staining in 8 paired TNBC tissues and adjacent normal tissues. n = 8 paired samples. Two-tailed paired Student’s t test. c Immunohistochemical staining of ENSA in 138 TNBC specimens. Representative images are shown. Scale bars, 100 µm. d Kaplan–Meier analysis of the relapse-free survival and overall survival of 138 TNBC patients. A log-rank test was used to determine the statistical significance between the low-ENSA expression group (n = 96) and the high ENSA expression group (n = 42). e IHC staining of SREBP2 and pSTAT3-Tyr705 in 138 TNBC specimens. Representative images are shown. Scale bars, 100 µm. n = 138 samples. f Correlation analysis of ENSA with SREBP2 and pSTAT3-Tyr705 expression levels in 138 TNBC tissues. Correlation coefficients were calculated using the Spearman test. Two-tailed P-values were given. g Proposed working model. In TNBC, ENSA is amplified, highly expressed and inhibits the function of PP2A, resulting in STAT3 Tyr705 phosphorylation and activation. STAT3 activation induces SREBP2 transcription to upregulate cellular cholesterol biosynthesis and facilitate tumor progression. Inhibition of STAT3 signaling with Stattic might serve as an effective treatment strategy for 1q21.3-amplified and ENSA-highly expressed TNBC. Source data are provided as a Source Data file. IHC immunohistochemistry, Amp amplification, SRE sterol regulatory element.

Similar articles

Cited by

References

    1. Venkitaraman R. Triple-negative/basal-like breast cancer: clinical, pathologic and molecular features. Expert Rev. Anticancer Ther. 2010;10:199–207. - PubMed
    1. Dent R, et al. Triple-negative breast cancer: clinical features and patterns of recurrence. Clin. Cancer Res. 2007;13:4429–4434. - PubMed
    1. Garrido-Castro AC, Lin NU, Polyak K. Insights into molecular classifications of triple-negative breast cancer: improving patient selection for treatment. Cancer Discov. 2019;9:176–198. - PMC - PubMed
    1. Yin WJ, et al. Clinicopathological features of the triple-negative tumors in Chinese breast cancer patients. Breast Cancer Res Treat. 2009;115:325–333. - PubMed
    1. Bianchini G, Balko JM, Mayer IA, Sanders ME, Gianni L. Triple-negative breast cancer: challenges and opportunities of a heterogeneous disease. Nat. Rev. Clin. Oncol. 2016;13:674–690. - PMC - PubMed

Publication types

MeSH terms

Substances