

Modelling biophoton emission kinetics based on the initial intensity value in Helianthus annuus plants exposed to different types of stress
- PMID: 35145188
- PMCID: PMC8831617
- DOI: 10.1038/s41598-022-06323-3
Modelling biophoton emission kinetics based on the initial intensity value in Helianthus annuus plants exposed to different types of stress
Erratum in
-
Author Correction: Modelling biophoton emission kinetics based on the initial intensity value in Helianthus annuus plants exposed to different types of stress.Sci Rep. 2022 Mar 4;12(1):3901. doi: 10.1038/s41598-022-08059-6. Sci Rep. 2022. PMID: 35246588 Free PMC article. No abstract available.
Abstract
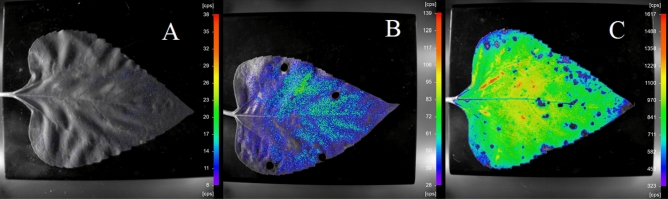
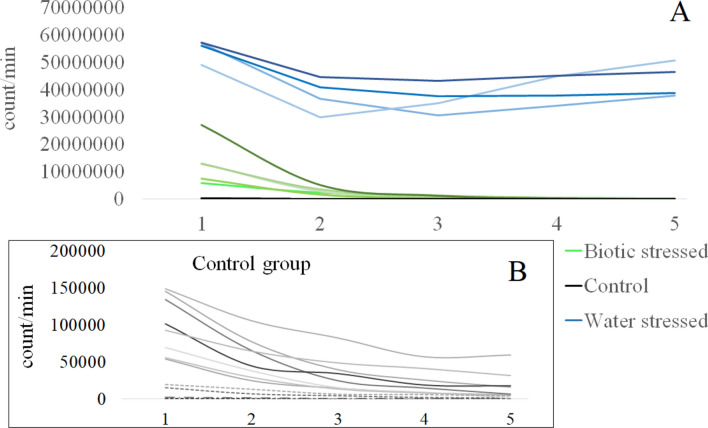
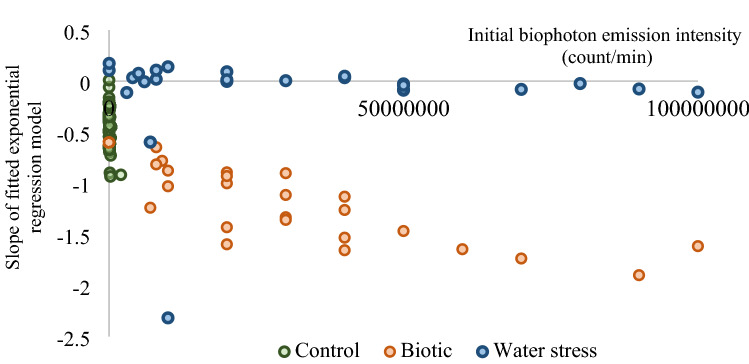
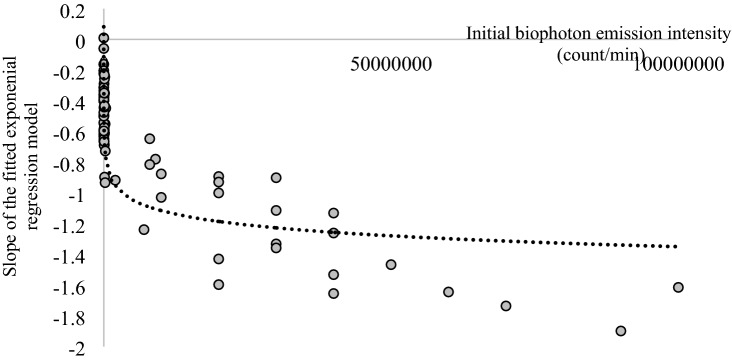
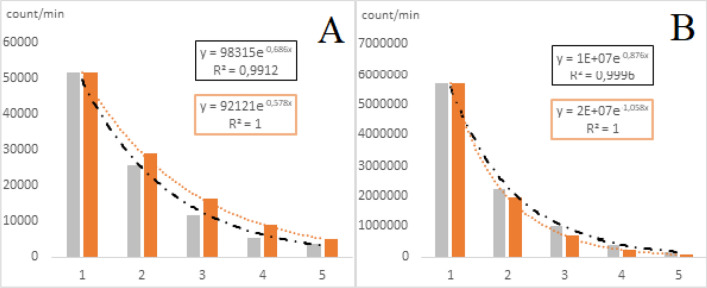
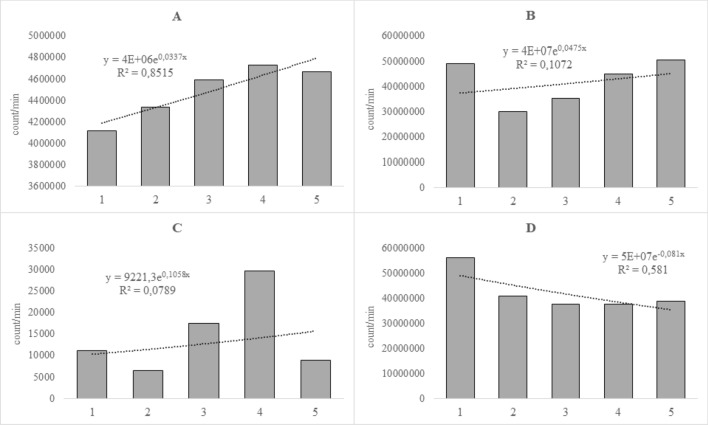
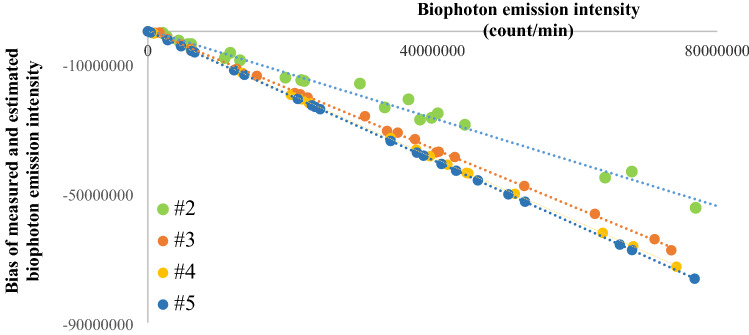
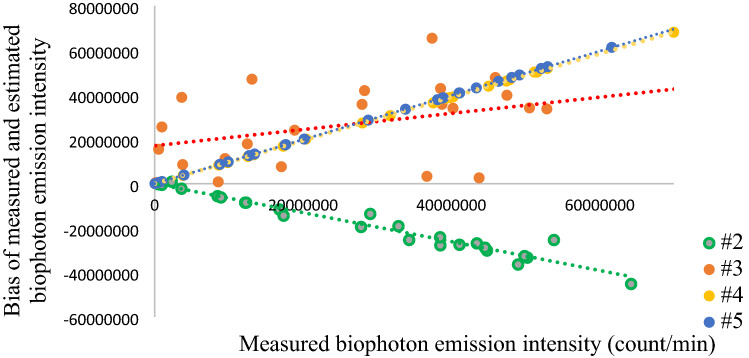
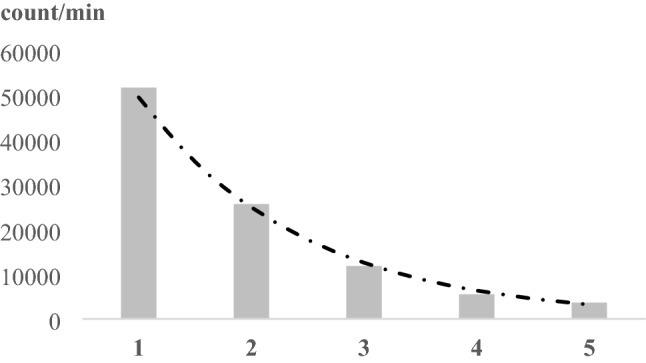
Biophoton radiation also referred to as ultra-weak photon emission (UPE) is used to denote a spontaneous and permanent photon emission associated with oxidative processes in cells and seems to universally occur in all living systems as a result of the generation of reactive oxygen species (ROS) that are produced under stress conditions. The measurement of this biophoton emission allows for a non-invasive approach in monitoring phenological stages throughout plant development which has direct relevance in agriculture research. In this study, the emission of photons emanating from sunflower (Helianthus annuus, L.) plants exposed to biotic and abiotic stress has been investigated. In healthy plants raised under controlled growth conditions UPE was low whereas in stressed individuals it considerably increased; particularly upon water stress. The kinetics of the signal is shown to reveal an exponential decay with characteristic dynamics, which appears to reflect different physiological states concomitantly setting in upon stress. The dynamics of the signal decay is shown to vary according to the type of stress applied (biotic vs. abiotic) hence suggesting a putative relationship between the kinetic traits of change in the signal intensity-decay and stress. Intriguingly, the determination of the change in the intensity of biophoton emission that ensued in a short time course was possible by using the initial biophoton emission intensity. The predictability level of the equations demonstrated the applicability of the model in a corroborative manner when employing it in independent UPE-measurements, thus permitting to forecast the intensity change in a very accurate way over a short time course. Our findings allow the notion that albeit stress confers complex and complicated changes on oxidative metabolism in biological systems, the employment of biophoton imaging offers a feasible method making it possible to monitor oxidative processes triggered by stress in a non-invasive and label-free way which has versatile applications especially in precision agriculture.
© 2022. The Author(s).
Conflict of interest statement
The authors declare no competing interests.
Figures
Similar articles
-
Non-invasive visualization of physiological changes of insects during metamorphosis based on biophoton emission imaging.Sci Rep. 2019 Jun 12;9(1):8576. doi: 10.1038/s41598-019-45007-3. Sci Rep. 2019. PMID: 31189990 Free PMC article.
-
Author Correction: Modelling biophoton emission kinetics based on the initial intensity value in Helianthus annuus plants exposed to different types of stress.Sci Rep. 2022 Mar 4;12(1):3901. doi: 10.1038/s41598-022-08059-6. Sci Rep. 2022. PMID: 35246588 Free PMC article. No abstract available.
-
Highly sensitive imaging for ultra-weak photon emission from living organisms.J Photochem Photobiol B. 2014 Oct 5;139:34-8. doi: 10.1016/j.jphotobiol.2013.11.011. Epub 2013 Dec 1. J Photochem Photobiol B. 2014. PMID: 24360927 Review.
-
Polychromatic spectral pattern analysis of ultra-weak photon emissions from a human body.J Photochem Photobiol B. 2016 Jun;159:186-90. doi: 10.1016/j.jphotobiol.2016.03.037. Epub 2016 Apr 7. J Photochem Photobiol B. 2016. PMID: 27082276
-
Human ultra-weak photon emission as non-invasive spectroscopic tool for diagnosis of internal states - A review.J Photochem Photobiol B. 2021 Mar;216:112141. doi: 10.1016/j.jphotobiol.2021.112141. Epub 2021 Jan 28. J Photochem Photobiol B. 2021. PMID: 33540236 Review.
References
-
- Devaraj B, Usa M, Inaba H. Biophotons: Ultraweak light emission from living systems. Curr. Opin. Solid State Mater. Sci. 1997;2(2):188–193.
-
- Cifra M, Pospíšil P. Ultra-weak photon emission from biological samples: Definition, mechanisms, properties, detection and applications. J. Photochem. Photobiol. B. Biol. 2014;139:2–10. - PubMed
-
- Pospíšil P, Prasad A, Rác M. Role of reactive oxygen species in ultra-weak photon emission in biological systems. J. Photochem. Photobiol. B. Biol. 2014;139:11–23. - PubMed
-
- Janusz S, Edward G, Leszek C. Spectral distribution of the ultraweak luminescence from germinating plants. J. Luminescence. 1981;24–25(2):791–794.
-
- Shoichi K, Tomomi M, Masahiro F. Morphogenesis and bioluminescence in germination of red bean. Phys. A. 1994;210:391–402.
Publication types
LinkOut - more resources
Full Text Sources
