. 2022 Mar;15(3):428-442.
doi: 10.1038/s41385-021-00478-4. Epub 2022 Feb 10.

Spatial, temporal and molecular dynamics of swine influenza virus-specific CD8 tissue resident memory T cells

Affiliations

Spatial, temporal and molecular dynamics of swine influenza virus-specific CD8 tissue resident memory T cells

Veronica Martini et al. Mucosal Immunol. 2022 Mar.

Abstract

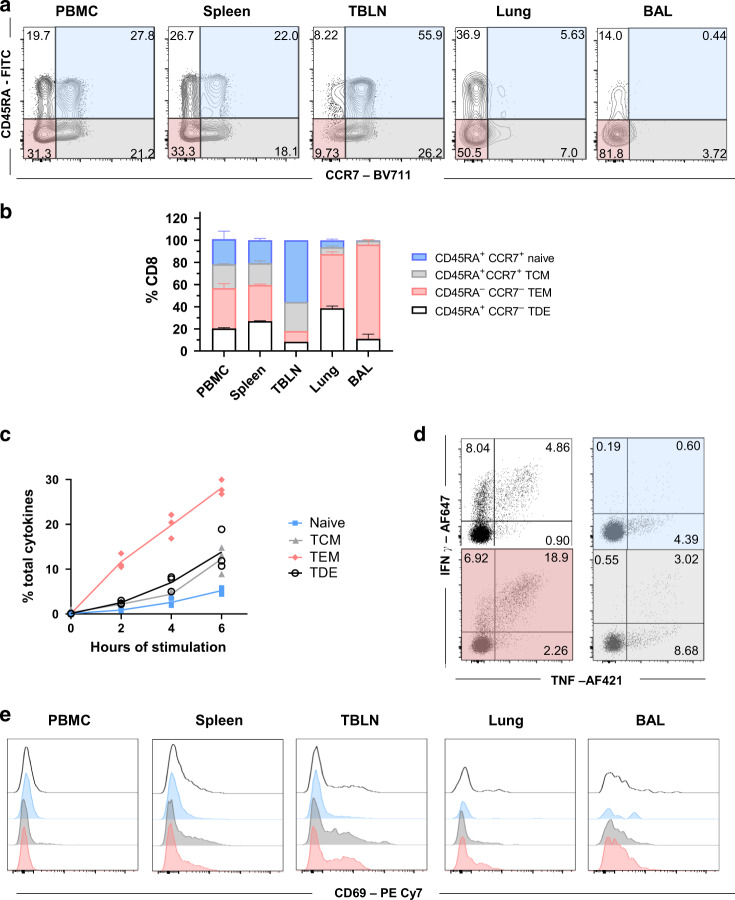
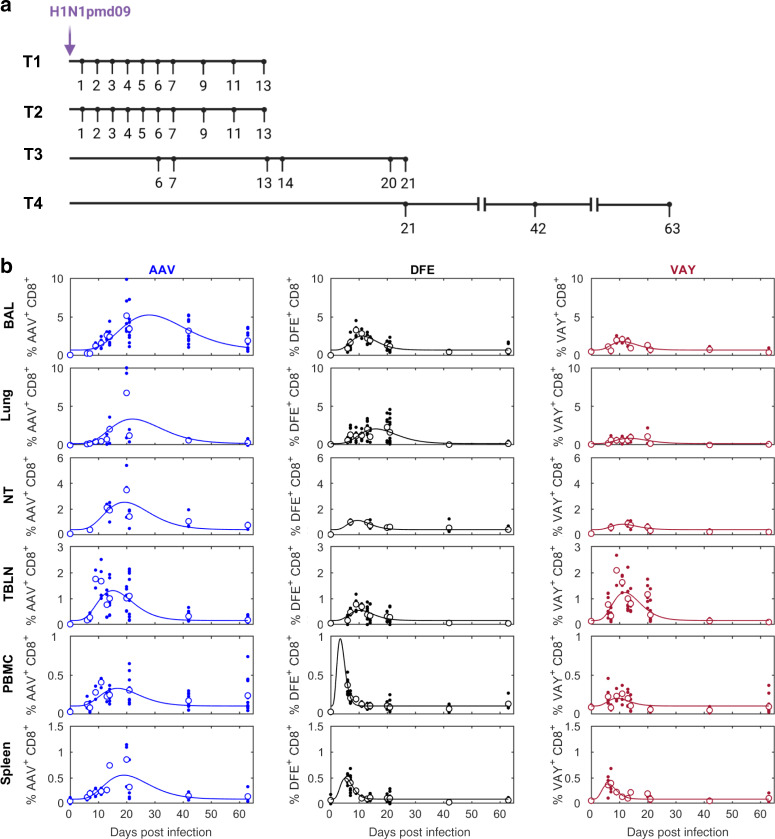
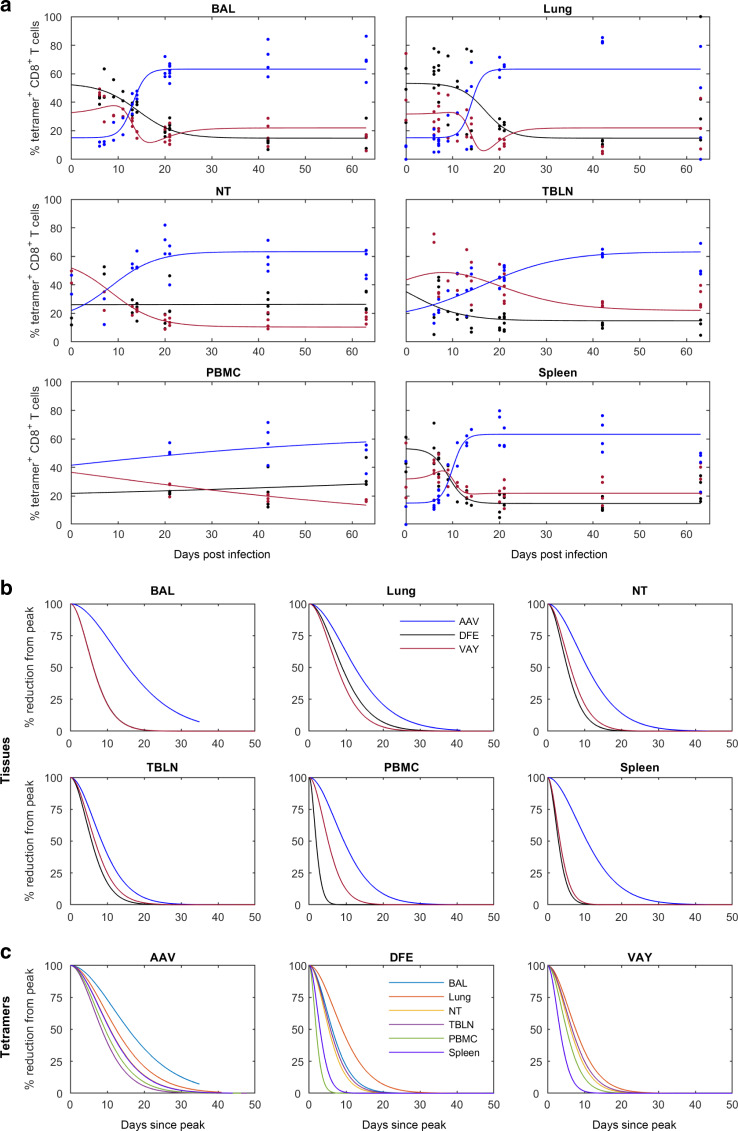
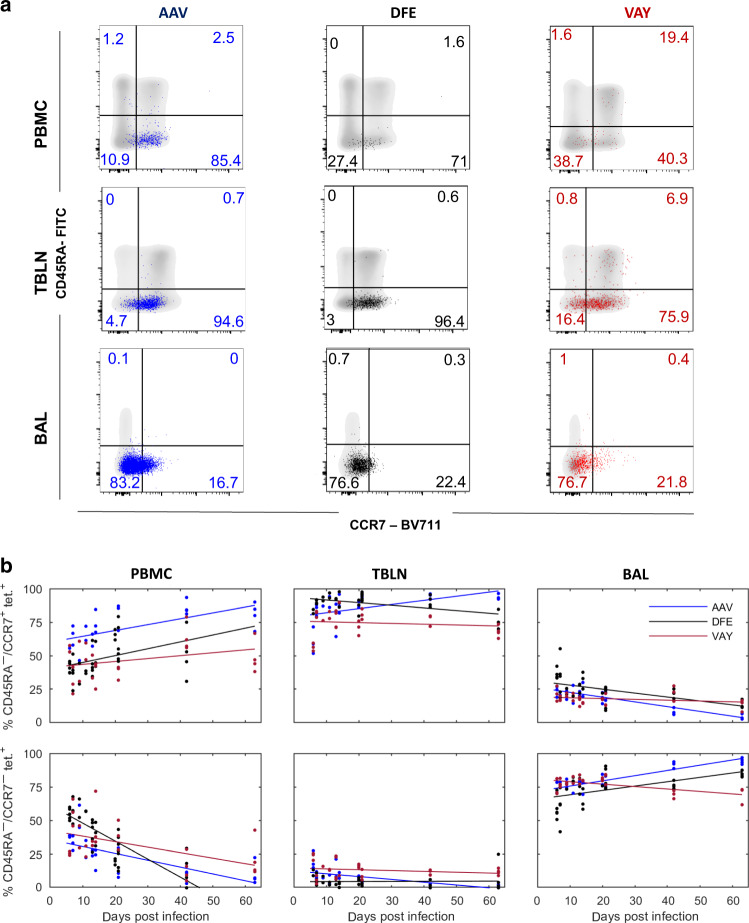
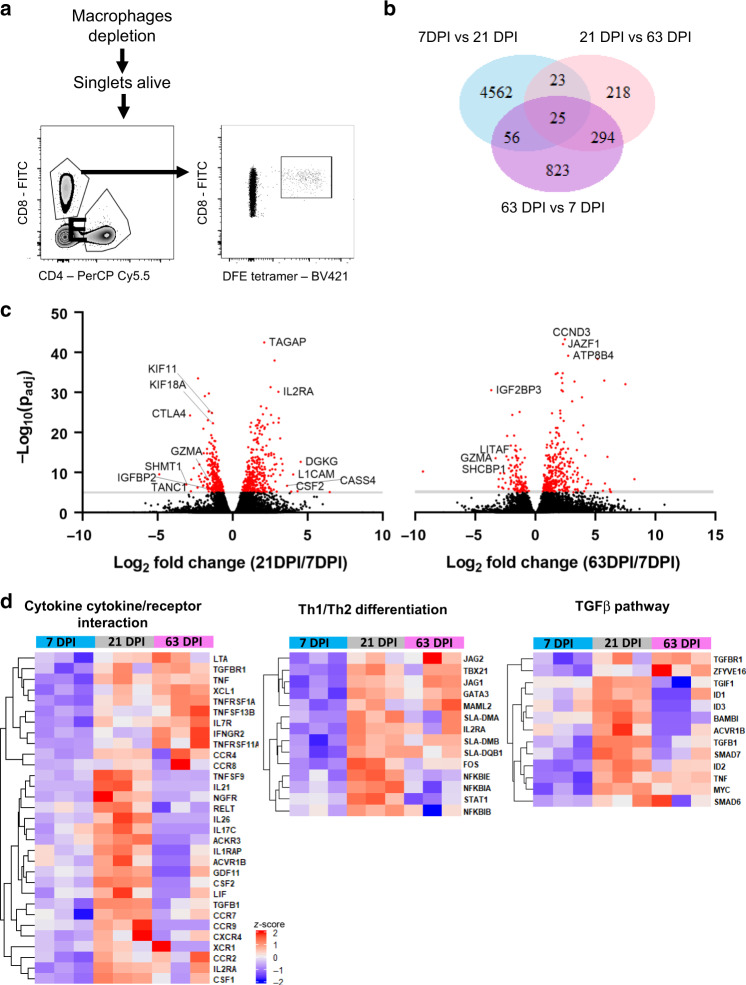
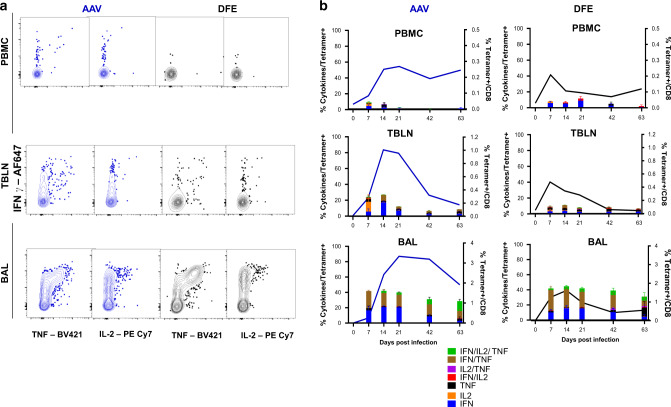
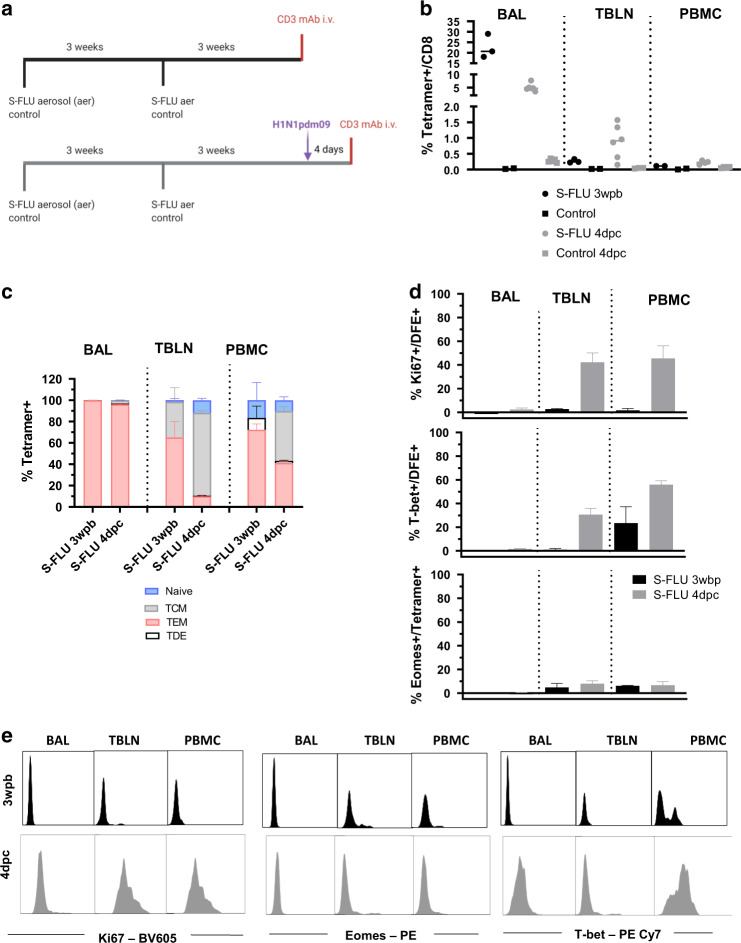
For the first time we have defined naïve, central memory, effector memory and differentiated effector porcine CD8 T cells and analyzed their distribution in lymphoid and respiratory tissues after influenza infection or immunization, using peptide-MHC tetramers of three influenza nucleoprotein (NP) epitopes. The hierarchy of response to the three epitopes changes during the response in different tissues. Most NP-specific CD8 T cells in broncho-alveolar lavage (BAL) and lung are tissue resident memory cells (TRM) that express CD69 and downregulate CD45RA and CCR7. NP-specific cells isolated from BAL express genes characteristic of TRM, but gene expression differs at 7, 21 and 63 days post infection. In all tissues the frequency of NP-specific CD8 cells declines over 63 days almost to background levels but is best maintained in BAL. The kinetic of influenza specific memory CD8 T cell in this natural host species differs from that in small animal models.


Conflict of interest statement

A.T. is named on a patent regarding the use of S-FLU vaccine. The other authors have no financial conflicts of interest.

Figures

Fig. 1
Fig. 1. Phenotype of porcine CD8 T cells in tissues and cytokine secretion after stimulation.
a Expression of CD45RA and CCR7 by CD8 T cells isolated from the indicated tissues of naïve Babraham pigs (n = 3). Quadrants show the proportion of each population. b Mean frequency (± SD) of TDE (CD45RA+, CCR7–), naïve (CD45RA + , CCR7 + ), TCM (CD45RA-, CCR7 + ) and TEM (CD45RA-, CCR7-) in CD8 T cells. c CD8 + T cells from PBMC of naïve Babraham pigs (n = 3) were sorted according to their expression of CD45RA and CCR7. The sorted cells were stimulated with PMA and Ionomycin for 0, 2, 4 and 6 h and TNF and IFNγ secretion measured by intracellular cytokine staining. Each symbol represents one animal, this experiment was repeated twice. d Representative FACS plot showing the secretion of IFNγ and TNF after 6 h stimulation in TDE (white panel), naïve (blue panel), TCM (grey panel) and TEM (red). Mean proportion of IFNγ single (top left), double producer (top right) and single TNF + (bottom right) T cells are reported. e CD69 expression in differentiated effector (TDE, white), naïve (blue), central memory (TCM, grey) and effector memory (TEM, red) in CD8 T cells in the tissues analyzed.
Fig. 2
Fig. 2. Experimental design and tetramer distribution in tissues.
a Babraham pigs were infected with H1N1pdm09 intranasally. One pig was culled on each day post infection in experiments T1 and T2, three on each day in T3 and four on each day in T4. Broncho-alveolar lavage (BAL), lung, tracheo-bronchial lymph nodes (TBLN), peripheral blood mononuclear cells (PBMC) and spleen were collected at all time points (n = 3 at 0, 14, 20 DPI; n = 5 at 6, 7, 13 DPI; n = 2 at 9, 11 DPI; n = 7 at 21 DPI; n = 4 at 42, 63 DPI) while nasal turbinates (NT) were isolated only in experiments T3 and T4 (n = 2 at 0, 7, 13 DPI; n = 3 at 14, 20, 21 DPI; n = 4 at 42, 63 DPI) b Proportion (%) of CD8+ T cells specific for AAV (left), DFE (middle) or VAY (right) in different tissues. In each plot the solid line is the fitted curve describing the dynamics, the large open circles are the mean % at each time point and the small filled circles are the observed % for individual pigs at each time point.
Fig. 3
Fig. 3. Proportions and decay of tetramer-specific cells in different tissues.
Changes in the proportion of tetramer+ CD8 T cells in different tissues and estimated decay (% reduction from peak) over time (a) Relative proportion (%) of CD8 + T cells specific for each tetramer (AAV—blue; DFE—black; VAY—red) in the indicated tissues. In each plot the solid line is the fitted curve describing the dynamics and the points are the observed proportions for individual pigs at each time point (for n see legend to Fig. 2). b Decay from the peak of response within the indicated tissue. c Decay of tetramer+ CD8 T cells in different tissues (as indicated). Note: DFE and VAY have the same dynamics in BAL, VAY has the same dynamics in NT and PBMC and AAV has the same dynamics in NT and spleen so these decay curves overlap.
Fig. 4
Fig. 4. Phenotype of influenza-specific CD8 T cells in tissues over time.
(a) Expression of CD45RA and CCR7 by AAV (left, blue), DFE (centre, black) and VAY (right, red) tetramer + (coloured dots) and total CD8 T cells (in grey) isolated at 21 DPI from PBMC (top), TBLN (middle) BAL (bottom), representative plots for one individual. b Proportion (%) of CD8 + T cells staining with AAV (blue), DFE (black) and VAY (red) tetramer in different tissues. T cell populations are TCM (CD45RA-/CCR7 + ; top row) and TEM (CD45RA-/CCR7 + ; bottom row) in PBMC (left), TBLN (centre) and BAL (right). In each plot the solid line is the fitted trend and the points are the observed proportions for individual pigs at each time point (for n see legend to Fig. 2).
Fig. 5
Fig. 5. Transcriptional profile of DFE-specific T cells in BAL at 7, 21 and 63 DPI.
a Sorting strategy for the isolation of DFE + T cells for RNA-seq. b Venn diagram shows the number of significant differentially expressed genes (padj value<0.05, and |log2 fold change | > 1) between 7DPI versus (vs) 21 DPI, 21DPI vs 63DPI and 63DPI vs 7DPI samples (n = 3). c Volcano plot showing upregulated genes in 21DPI vs 7DPI and 63DPI vs 21DPI comparison. d Heatmap of selected genes from KEGG Pathway analysis related to cytokine production, T cell differentiation and TGFβ pathway (enrichment score of 0.76, 0.88 and 0.83 respectively).
Fig. 6
Fig. 6. Activation state and transcription factors expression in tetramer+ CD8 T cells.
(a) Top: Histograms show the expression of CD69 by DFE (black), VAY (red) and AAV (blue) tetramer+ T cells in PBMC (left), TBLN (centre) and BAL (left) at 21 DPI. Bottom: Frequencies of tetramer+ cells expressing CD69 in PBMC, TBLN and BAL. b Top: Expression of T-Bet and Eomes by AAV (left, blue), DFE (centre, black) and VAY (right, red) tetramer + (coloured dots) and total CD8 T cells (in grey) isolated at 21 DPI from TBLN, representative plots for one individual. Bottom: Frequencies of tetramer+ cells expressing T-bet and Eomes in PBMC, TBLN and BAL. C Proportion of AAV, DFE and VAY tetramer+ expressing Ki67 in PBMC, TBLN and BAL. In each plot the solid line is the fitted curve describing the dynamics and the points are the observed proportions for individual pigs at each time point (for n see legend to Fig. 2).
Fig. 7
Fig. 7. Cytokine secretion after ex vivo virus stimulation of AAV and DFE tetramer+ cells.
(a) Lymphocytes isolated at different time points from blood, TBLN and BAL were stimulated with H1N1pdm09 MOI = 1. Following 18 h of stimulation, cells were labelled using tetramers and cytokines quantified using intracellular cytokine staining. Representative plots of AAV + (on left) and DFE + (right) T cells secreting IFNγ, TNF and IL-2 cytokines, from lymphocytes isolated 14 DPI. b Mean frequency (±SEM) of tetramer+ cells secreting IFNγ, TNF and IL-2 from PBMC (top panels), TBLN (in the middle) and BAL (bottom). The right Y axes shows the mean frequency of AAV + (in blue, left panels) and DFE + (in black, right panels) within CD8 T cells. Data shown are mean of 3/4 individuals per timepoint. Two-way ANOVA was used for comparison of each cytokine population between DFE+ and AAV+ cells.
Fig. 8
Fig. 8. DFE+ T cell distribution and phenotype after S-FLU immunisation.
(a) In a first experiment Babraham pigs (n = 3) were immunized with S-FLU by aerosol (aer), boosted 3 weeks later and after 3 weeks, infused with anti-porcine CD3 mAb intra-venously (i.v.) 10 min prior to sacrifice. Control animal were left untreated (n = 2). In a second experiment, Babraham pigs (n = 6) received S-FLU aer and control animals (n = 5) remained untreated. Three weeks post boost all animals were challenged with H1N1pdm09 intranasally. After 4 days, half of the pigs were infused i.v. with anti CD3 mAb and then all culled. b Percentages of CD8 T cells staining with DFE tetramer in S-FLU immunized (black dots) and S-FLU immunized and challenged animals (grey dots). Respective controls are shown as squares. Each symbol represents an individual animal and the mean is indicated by a bar. c Mean frequency (± SEM) of naïve (CD45RA + , CCR7 + ), TCM (CD45RA-, CCR7 + ) and TEM (CD45RA–, CCR7–) and TDE (CD45RA + , CCR7–) of DFE + T cells in BAL, TBLN and PBMC of S-FLU vaccinated (n = 3) and challenged animals (n = 6). d Representative histograms of intracellular staining for Ki67 (left) T-bet (centre) and Eomes (right) in DFE + CD8 T cells in BAL, TBLN and PBMC of S-FLU vaccinated animals 3 weeks post boost (black) and 4 days post challenge (grey). Dotted histograms indicate controls and numbers show mean fluorescent intensity (MFI).

References

    1. Krammer F. The human antibody response to influenza A virus infection and vaccination. Nat. Rev. Immunol. 2019;19:383–397. doi: 10.1038/s41577-019-0143-6. - DOI - PubMed
    1. Thomas PG, Keating R, Hulse-Post DJ, Doherty PC. Cell-mediated protection in influenza infection. Emerg. Infect. Dis. 2006;12:48–54. doi: 10.3201/eid1201.051237. - DOI - PMC - PubMed
    1. Harper SA, Fukuda K, Cox NJ, Bridges CB. Advisory Committee on Immunization P. Using live, attenuated influenza vaccine for prevention and control of influenza: supplemental recommendations of the Advisory Committee on Immunization Practices (ACIP) MMWR Recomm. Rep. 2003;52(RR-13):1–8. - PubMed
    1. Genzow M, Goodell C, Kaiser TJ, Johnson W, Eichmeyer M. Live attenuated influenza virus vaccine reduces virus shedding of newborn piglets in the presence of maternal antibody. Influenza Other Respir. Viruses. 2018;12:353–359. doi: 10.1111/irv.12531. - DOI - PMC - PubMed
    1. Sathaliyawala T, et al. Distribution and compartmentalization of human circulating and tissue-resident memory T cell subsets. Immunity. 2013;38:187–197. doi: 10.1016/j.immuni.2012.09.020. - DOI - PMC - PubMed

Publication types