

Tricyclic cell-penetrating peptides for efficient delivery of functional antibodies into cancer cells
- PMID: 35145246
- PMCID: PMC7617065
- DOI: 10.1038/s41557-021-00866-0
Tricyclic cell-penetrating peptides for efficient delivery of functional antibodies into cancer cells
Abstract
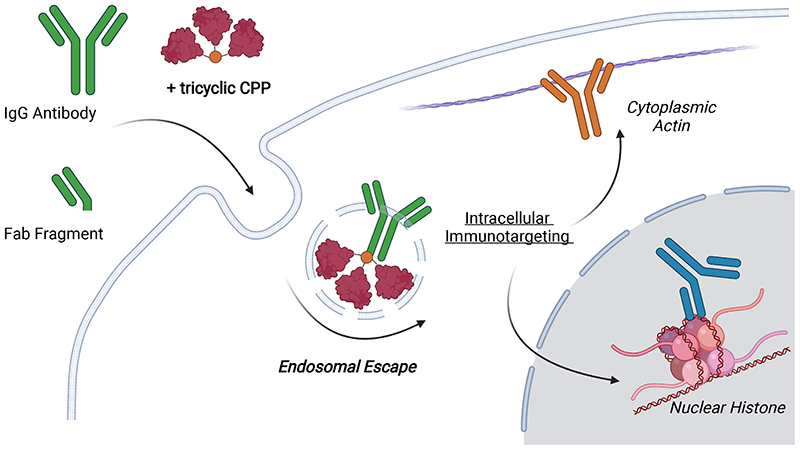
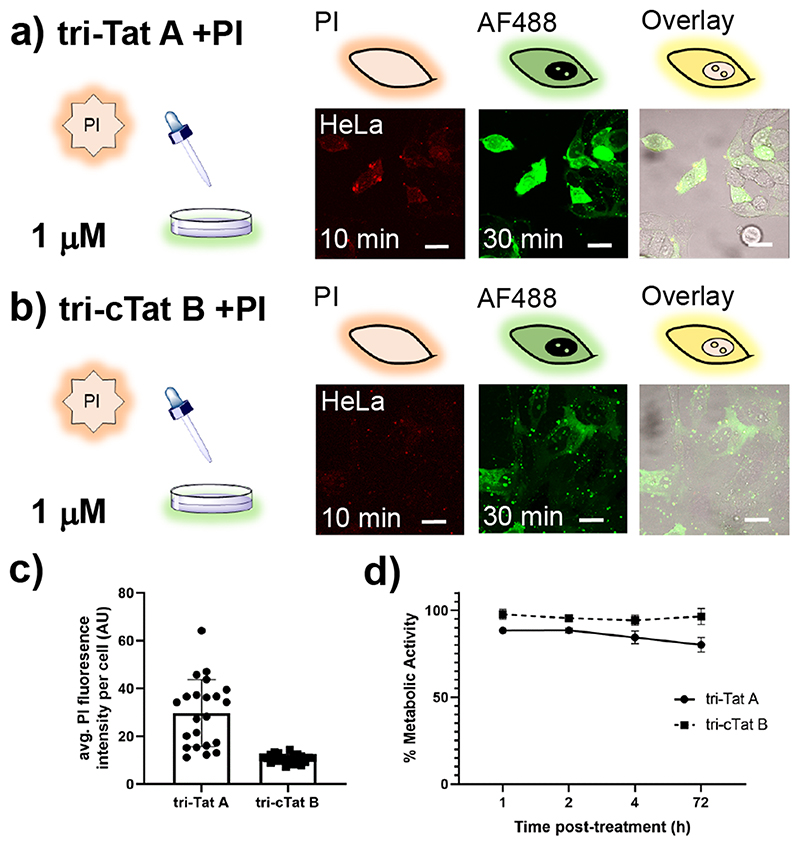
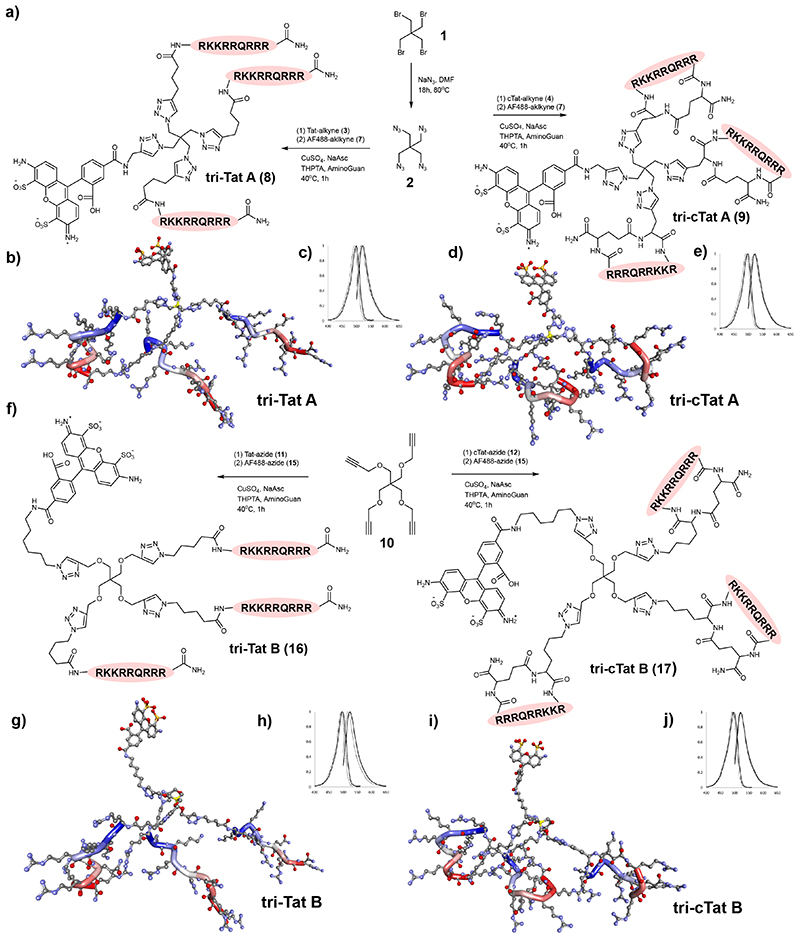
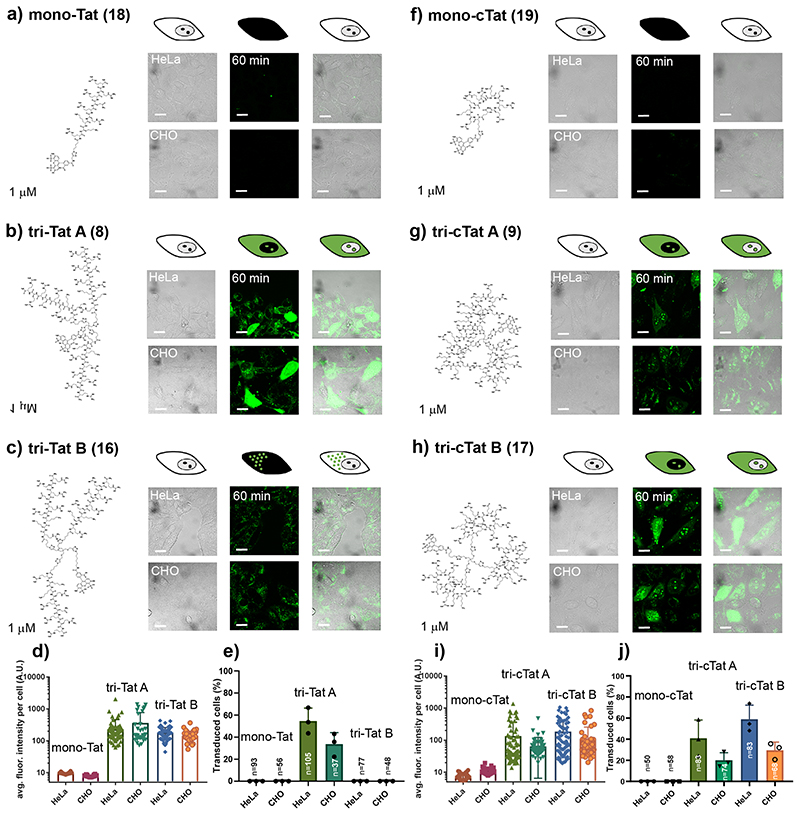
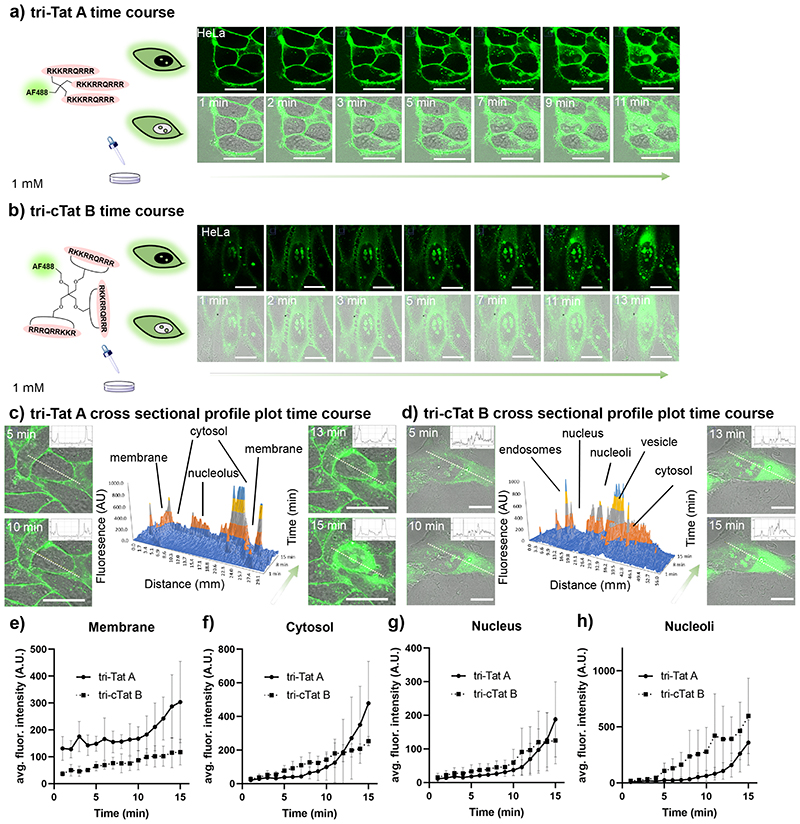
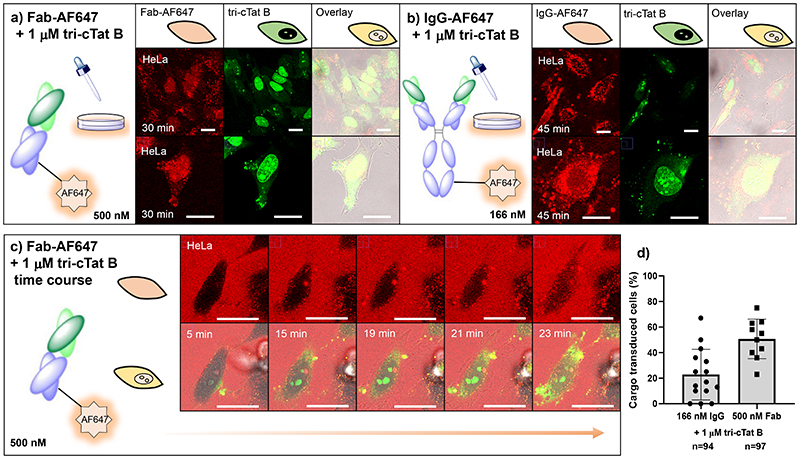
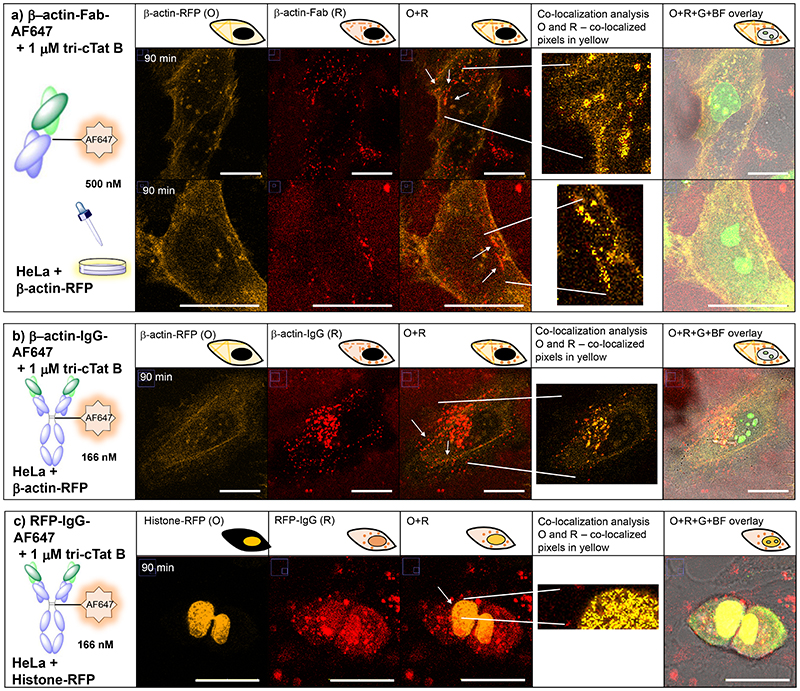
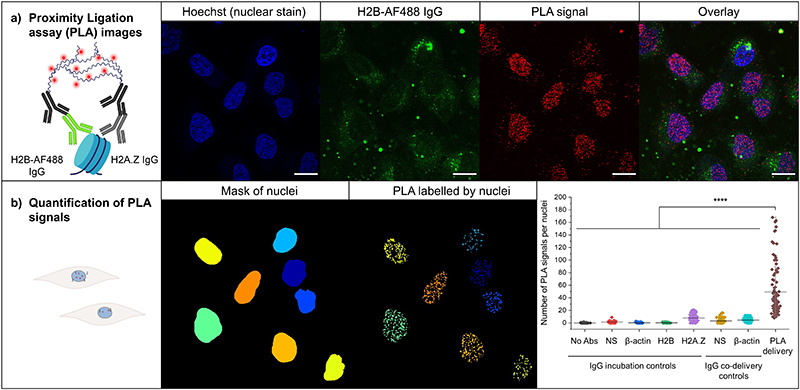
The intracellular environment hosts a large number of cancer- and other disease-relevant human proteins. Targeting these with internalized antibodies would allow therapeutic modulation of hitherto undruggable pathways, such as those mediated by protein-protein interactions. However, one of the major obstacles in intracellular targeting is the entrapment of biomacromolecules in the endosome. Here we report an approach to delivering antibodies and antibody fragments into the cytosol and nucleus of cells using trimeric cell-penetrating peptides (CPPs). Four trimers, based on linear and cyclic sequences of the archetypal CPP Tat, are significantly more potent than monomers and can be tuned to function by direct interaction with the plasma membrane or escape from vesicle-like bodies. These studies identify a tricyclic Tat construct that enables intracellular delivery of functional immunoglobulin-G antibodies and Fab fragments that bind intracellular targets in the cytosol and nuclei of live cells at effective concentrations as low as 1 μM.
© 2021. The Author(s), under exclusive licence to Springer Nature Limited.
Conflict of interest statement
The authors declare no competing interests.
Figures
Comment in
-
Peptides as molecular Trojan horses.Nat Chem. 2022 Mar;14(3):250-252. doi: 10.1038/s41557-022-00906-3. Nat Chem. 2022. PMID: 35228689 No abstract available.
Similar articles
-
Engineered Histidine-Rich Peptides Enhance Endosomal Escape for Antibody-Targeted Intracellular Delivery of Functional Proteins.Angew Chem Int Ed Engl. 2023 Sep 18;62(38):e202304692. doi: 10.1002/anie.202304692. Epub 2023 Jun 27. Angew Chem Int Ed Engl. 2023. PMID: 37283024
-
Cell-Penetrating Peptides Escape the Endosome by Inducing Vesicle Budding and Collapse.ACS Chem Biol. 2020 Sep 18;15(9):2485-2492. doi: 10.1021/acschembio.0c00478. Epub 2020 Aug 26. ACS Chem Biol. 2020. PMID: 32786250 Free PMC article.
-
Effective capture of proteins inside living cells by antibodies indirectly linked to a novel cell-penetrating polymer-modified protein A derivative.FEBS J. 2015 Jan;282(1):142-52. doi: 10.1111/febs.13111. Epub 2014 Nov 10. FEBS J. 2015. PMID: 25315678
-
Cyclic Cell-Penetrating Peptides as Efficient Intracellular Drug Delivery Tools.Mol Pharm. 2019 Sep 3;16(9):3727-3743. doi: 10.1021/acs.molpharmaceut.9b00633. Epub 2019 Aug 8. Mol Pharm. 2019. PMID: 31329448 Review.
-
In vitro and in vivo delivery of therapeutic proteins using cell penetrating peptides.Peptides. 2017 Jan;87:50-63. doi: 10.1016/j.peptides.2016.11.011. Epub 2016 Nov 22. Peptides. 2017. PMID: 27887988 Review.
Cited by
-
Nucleus-Targeting Phototherapy Nanodrugs for High-Effective Anti-Cancer Treatment.Front Pharmacol. 2022 May 11;13:905375. doi: 10.3389/fphar.2022.905375. eCollection 2022. Front Pharmacol. 2022. PMID: 35645841 Free PMC article. Review.
-
Cell-Surface-Retained Peptide Additives for the Cytosolic Delivery of Functional Proteins.J Am Chem Soc. 2023 Oct 31;145(45):24535-48. doi: 10.1021/jacs.3c05365. Online ahead of print. J Am Chem Soc. 2023. PMID: 37906525 Free PMC article.
-
Intracellular Antibodies for Drug Discovery and as Drugs of the Future.Antibodies (Basel). 2023 Mar 16;12(1):24. doi: 10.3390/antib12010024. Antibodies (Basel). 2023. PMID: 36975371 Free PMC article. Review.
-
Intracellular Delivery of Native Proteins by BioReversible Arginine Modification (BioRAM) on Amino Groups.Angew Chem Int Ed Engl. 2025 Aug 18;64(34):e202506802. doi: 10.1002/anie.202506802. Epub 2025 Jul 9. Angew Chem Int Ed Engl. 2025. PMID: 40452583 Free PMC article.
-
Protein Delivery to Insect Epithelial Cells In Vivo: Potential Application to Functional Molecular Analysis of Proteins in Butterfly Wing Development.BioTech (Basel). 2023 Apr 16;12(2):28. doi: 10.3390/biotech12020028. BioTech (Basel). 2023. PMID: 37092472 Free PMC article.
References
-
- Carter PJ, Lazar GA. Next generation antibody drugs: pursuit of the ‘high-hanging fruit’. Nature Reviews Drug Discovery. 2018;17:197–223. - PubMed
-
- Verdine GL, Walensky LD. The challenge of drugging undruggable targets in cancer: lessons learned from targeting BCL-2 family members. Clin Cancer Res. 2007;13:7264–7270. - PubMed
-
- Stewart MP, et al. In vitro and ex vivo strategies for intracellular delivery. Nature. 2016;538:183–192. - PubMed
-
- Samal SK, et al. Cationic polymers and their therapeutic potential. Chem Soc Rev. 2012;41:7147–7194. - PubMed
-
- Brooks H, Lebleu B, Vivès E. Tat peptide-mediated cellular delivery: back to basics. Adv Drug Del Rev. 2005;57:559–577. - PubMed
Publication types
MeSH terms
Substances
Grants and funding
LinkOut - more resources
Full Text Sources
Other Literature Sources
Medical
