. 2022 Feb;19(2):231-241.
doi: 10.1038/s41592-021-01390-2. Epub 2022 Feb 10.

A genetically encoded sensor for in vivo imaging of orexin neuropeptides

Affiliations

A genetically encoded sensor for in vivo imaging of orexin neuropeptides

Loïc Duffet et al. Nat Methods. 2022 Feb.

Erratum in

  • Author Correction: A genetically encoded sensor for in vivo imaging of orexin neuropeptides.
    Duffet L, Kosar S, Panniello M, Viberti B, Bracey E, Zych AD, Radoux-Mergault A, Zhou X, Dernic J, Ravotto L, Tsai YC, Figueiredo M, Tyagarajan SK, Weber B, Stoeber M, Gogolla N, Schmidt MH, Adamantidis AR, Fellin T, Burdakov D, Patriarchi T. Duffet L, et al. Nat Methods. 2022 Apr;19(4):505. doi: 10.1038/s41592-022-01449-8. Nat Methods. 2022. PMID: 35354982 Free PMC article. No abstract available.

Abstract

Orexins (also called hypocretins) are hypothalamic neuropeptides that carry out essential functions in the central nervous system; however, little is known about their release and range of action in vivo owing to the limited resolution of current detection technologies. Here we developed a genetically encoded orexin sensor (OxLight1) based on the engineering of circularly permutated green fluorescent protein into the human type-2 orexin receptor. In mice OxLight1 detects optogenetically evoked release of endogenous orexins in vivo with high sensitivity. Photometry recordings of OxLight1 in mice show rapid orexin release associated with spontaneous running behavior, acute stress and sleep-to-wake transitions in different brain areas. Moreover, two-photon imaging of OxLight1 reveals orexin release in layer 2/3 of the mouse somatosensory cortex during emergence from anesthesia. Thus, OxLight1 enables sensitive and direct optical detection of orexin neuropeptides with high spatiotemporal resolution in living animals.


Conflict of interest statement

T.P. is a co-inventor on a patent application related to the technology described in this article. All other authors declare no competing interests.

Figures

Fig. 1
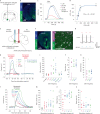
Fig. 1. Development of the orexin sensor.
a, Structural model of the OxLight1 sensor shown next its natural endogenous peptide ligands orexin-A (OXA; PDB, 1WSO) and orexin-B (OXB; PDB,1CQ0). b, Summary of the complete set of screened mutations and deletions performed in this study for a total of 101 variants. Snapshot of screening efforts, with mutated sensor regions highlighted in magenta in the structural model of OxLight1 (inset). Pink bars indicate variants with a positive response; blue bars indicate variants with a negative response. The response of OxLight1 is shown as a red bar (n = 5 cells for each variant). c, Fluorescence fold-change (ΔF / F0) for OxLight1 (green trace) or OxLight-ctr (gray trace) in HEK293T cells after addition of OXA or OXB each competing with almorexant. Ligand application is indicated by colored bars (all applied at 10 μM). d, Quantification of maximal ΔF / F0 from c for OxLight1 and OxLight-ctr. n = 3 independent experiments with n = 28, 20, 27 and 18 cells for OXA-OxLight1, OXA-OxLight-ctr, OXB-OxLight1 and OXB-OxLight-ctr, respectively. ***P < 0.0001. P = 2.070 × 10−23 and 1.242 × 10−22 for the response to either OXA or OXB of OxLight-ctr compared to OxLight1, respectively (two-tailed Student’s t-test with Welch’s correction). e, Representative images of OxLight1 expression in HEK293T cells and the sensor’s fluorescence intensity before (left) or after (center) 10 μM OXA (top) or OXB (bottom) application and corresponding pixel-wise ΔF / F0. Scale bars, 10 μm. f, Normalized dose–response curves (fitted with a four-parameter equation) to OXA or OXB in OxLight1-expressing HEK293T cells. n = 3 independent experiments with ≥18 cells each. g, Representative images of sensor expression in primary hippocampal neurons and the sensor’s fluorescence intensity before (left) or and after (center) 10 μM OXA (top) or OXB (bottom) application and corresponding pixel-wise ΔF / F0. Scale bars, 10 μm. h, Normalized dose–response curves (fitted as in f) to OXA or OXB in primary hippocampal neurons expressing OxLight1. n = 4 independent experiments with ≥10 neurons each. All data are shown as mean ± s.e.m. All experiments were repeated at least three times with similar results. Source data
Fig. 2
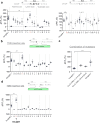
Fig. 2. In vitro sensor characterization.
a, Maximal ΔF / F0 responses in OxLight1-expressing HEK293T to addition of different drugs or drug combinations. Agonists (OXA or YNT-185 alone), OXA + antagonists (EMPA, JNJ10397049 (JNJ), TCS OX2 29 (TCS), SB334867 (SB)) and antagonists alone were applied in bolus at 10 μM final concentration. P values were as follows: almorexant, 0.9650 (n = 25 cells); suvorexant, 0.6452 (n = 37 cells); EMPA, 0.3013 (n = 28 cells); JNJ, 0.4359 (n = 34 cells); TCS, 0.3327 (n = 24 cells); SB, 0.2423 (n = 31 cells); YNT-185, 2.154 × 10−24 (n = 33 cells); OXA, 1.918 × 10−21 (n = 25 cells); OXA + almorexant, 3.673 × 10−22 (n = 28 cells); OXA + suvorexant, 4.286 × 10−22 (n = 18 cells); OXA + EMPA, 3.260 × 10−22 (n = 23 cells); OXA + JNJ, 6.947 × 10−22 (n = 29 cells); OXA + TCS, 6.866 × 10−24 (n = 32 cells); and OXA + SB, 1.309 × 10−12 (n = 25 cells); all antagonists and agonists were compared to Hank’s balanced salt solution (HBSS) (n = 38 cells) and all OXA + antagonists were compared to OXA using two-tailed Student’s t-test with Welch’s correction. All experiments were repeated three times with similar results. b, Fluorescence responses of OxLight1 to a high concentration (10 µM) of different neuropeptides. MCH, melanin-concentrating hormone; GLP-1, glucagon-like peptide 1. All experiments were repeated three times with similar results. NS, not significant. P values were as follows: OXA, 1.918 × 10−21 (n = 25 cells); dynorphin, 0.6434 (n = 30 cells); enkephalin, 0.0753 (n = 29 cells); GLP-1, 0.7942 (n = 30 cells); neuromedin B, 0.3163 (n = 30 cells); neuropeptide S, 0.1407 (n = 30 cells); neurotensin, 0.0690 (n = 30 cells); nociceptin, 0.6375 (n = 30 cells); nocistatin, 0.9033 (n = 30 cells); neuropeptide FF, 0.9996 (n = 30 cells); and MCH, 0.6613 (n = 24 cells); all peptides were compared to HBSS control (n = 38 cells) using two-tailed Student’s t-test with Welch’s correction. c, Time plots of ΔF / F0 for OxLight1 pixels from a representative line-scan trial. Red fluorescent dye signal onset is indicated by a dashed red line. OxLight1 responses to application of either orexin (10 µM) were fitted with a mono-exponential function. Curve fits are shown in yellow (OXA) and blue (OXB). Respective cells and line profiles used are shown directly underneath the time plots as well as the average time constant (τ¯) for OXA and OXB. Scale bars, 10 µm. d, Quantification of time constants from all curve fits. n = 8 dishes with ≥4 cells for each peptide. e, Characterization of OxLight1 coupling to intracellular calcium signaling. Intracellular calcium dynamics were measured in HEK293T expressing either OX2R or OxLight1 by monitoring the fluorescence of a coexpressed red calcium sensor (jRGECO1a). ΔF / F0 responses of jRGECO1a were recorded at baseline, after addition of 1 nM orexins for OX2R and 1 nM followed by 500 nM orexins for OxLight1. In both cases orexins were applied as an equimolar mix of OXA and OXB. Ligand addition is indicated by colored bars. All experiments were repeated three times with similar results, n = 44 and 45 cells for OX2R and OxLight1. f, Quantification of responses from e. Signals are normalized to the maximum response from the same cells after addition of 10 µM ionomycin. Individual data points represent the maximum jRGECO1a ΔF / F0 response of each cell after addition of 1 nM orexins. Violin plot represents the kernel density estimate of the probability density function for each sample. n = 3 dishes with ≥10 cells for each condition. P = 1.318 × 10−12 using two-tailed Student’s t-test with Welch’s correction. g, Representative images of cells used in e,f. OX2R was visualized with an Alexa-647-conjugated anti-FLAG antibody. Scale bars, 10 µm. All data are shown as mean ± s.e.m. ***P < 0.0001. Source data
Fig. 3
Fig. 3. Ex vivo and in vivo validation of the sensor.
a, Schematic drawing of AAV injections into the LH used for ex vivo validation. b, Representative confocal image of OxLight1 expression in LH. DAPI, 4,6-diamidino-2-phenylindole. c, Representative ΔF / F0 response traces for either OxLight1 or OxLight-ctr recorded from acute brain slices upon perfusion of the indicated OXA concentrations. d, Dose–response plot maximal OxLight1 ΔF / F0 responses in slices to different concentrations of perfused OXA. Individual data points are shown as aligned dots. Data were fitted using Hill’s equation (EC50 mean ± s.e.m. shown). n ≥ 3 slices per each concentration from four mice. e, Schematic drawing of viral injections and optic fiber implants in nucleus accumbens shell (NAcSh) and LH, used for in vivo photometry and optogenetic experiments. f, Histological verification of OxLight1 expression in NAcSh (left). Histological images showing that ChrimsonR-expression (magenta) colocalizes with OXA containing neurons of the LH (green), detected by immunostaining (right). g, Electrophysiological characterization of the light sensitivity of ChrimsonR-expressing orexinergic neurons. Representative recordings of n = 5 cells. Light stimuli were red bars, 635 nm laser; blue bar, 465 nm LED. h, Averaged OxLight1 fluorescence responses to increasing frequencies of optogenetic stimuli: 1, 5, 10 and 20 Hz, n = 3 mice, n = 3 randomly interleaved repeats per frequency (left). OxLight-ctr traces during 20 Hz and 10 Hz optogenetic stimulation (right). n = 3 mice, n = 3 randomly interleaved repeats per frequency. i, Quantification of peak fluorescence during optogenetic stimulation in h. Black bars indicate means. Two-sided rank-sum comparison of 20 Hz and 10 Hz for OxLight1 versus OxLight-ctr sensor was P = 0.0004, with no multiple comparison adjustments. j,k, Time constants of rise (j) and decay (k) in the fluorescence responses to different stimulation frequencies. l, Average OxLight1 fluorescence responses to optogenetic stimulus frequency of 10 Hz with train durations of 1, 5, 10, 15, 20 or 30 s, n = 3 mice and n = 3 randomly interleaved repeats per stimulation duration. Experiments were performed under isoflurane anesthesia. m, Quantification of peak fluorescence response during optogenetic stimulation in l. n,o, Time constants of rise (n) and decay (o) in the fluorescence responses to different stimulation durations. Source data
Fig. 4
Fig. 4. Monitoring orexin dynamics associated with natural behaviors.
a, Schematics of experimental setup for running experiments. b, Example traces of OxLight1 and OxLight-ctr fluorescence during spontaneous running bouts in head-restrained mice on a running wheel. Example running bouts, onsets indicated with black arrowheads (top). Running bouts in an OxLight1 (left) and OxLight-ctr mouse (right). Running-related sensor activity in an OxLight1 (light green) and OxLight-ctr (dark green) mouse (bottom). AU, arbitrary units (raw fluorescence). c, Average values during onset of spontaneous running bouts. OxLight1 activity, n = 5 mice, n = 75 bouts (light-green circle) versus OxLight-ctr activity, n = 3 mice, n = 45 bouts (dark-green circle) (left) Two-sided rank-sum comparison of OxLight1 versus OxLight-ctr activity, P = 1.1537 × 10−10. Running speed in OxLight1 mice (gray circle) and OxLight-ctr mice (black circle) (right). Two-sided rank-sum comparison of running activity, P = 0.4122, with no multiple comparison adjustments (values expressed as mean ± s.e.m.). d, Average running-related OxLight1 activity aligned to spontaneous running bout onset. OxLight1, n = 5 mice, n = 75 running bouts (left); OxLight-ctr, n = 3 mice, n = 45 running bouts, z-scored traces expressed as average ± s.e.m. (right). e, Time to peak for run bouts versus orexin release for period from run bout onset to 5 s. Individual time to peaks for run bouts, n = 5 mice, n = 75 running bouts (small black circles) and average (large black circle) (left). Individual peak running times (small green circles) and average time to peak (large green circle) (right). Two-sided rank-sum comparison of time to running peak versus OxLight1 activity peak, P = 0.0113, values expressed as average ± s.e.m. f, Correlation between running peaks and OxLight1 peaks from run bout onset to 5 s., n = 5 mice, n = 75 bouts (light-green circles), linear regression and F-test, R2 = 0.108, F = 8.853, P = 0.0039. OxLight-ctr activity, n = 3 mice, n = 45 bouts (dark-green circles), R2 = 0.0125, P = 0.465. g, Schematic of injections and manipulations for tail-picking experiments. h, Left, ∆F/F0 (%) of OxLight1-injected mice (n = 7 mice, one episode per mouse). Light-green line represents mean response from all animals and green shading represents s.e.m. Time 0 is aligned to tail pick (vertical gray line). Mean ∆F/F0 (%) for the pre-event period (5 s before tail pick) and event period (10 s of tail pick) (right). Two-sided paired Student’s t-test (P = 0.027). i, Same as in h for OxLight-ctr-injected mice (n = 4 mice, one episode per mouse). Two-sided paired Student’s t-test (P = 0.419) (right). Source data
Fig. 5
Fig. 5. Tracking orexin dynamics across sleep–wake cycles.
a, Schematic drawing of AAV injections in the BF and experimental setup for EEG, EMG and fiber photometry recordings during sleep–wake states. b, EEG spectrogram, EEG, EMG, hypnogram and ΔF / F0 fluorescence recordings of an OxLight1-injected animal with or without suvorexant administration (top to bottom). Representative 30-min OxLight1 recordings without pharmacological treatment (left). Representative recordings after suvorexant administration (dosage, 50 mg kg−1) in the same animal (right). Hypnogram color codes are wake, green; NREM, blue; and REM, orange. c, Changes in average ΔF / F0 of OxLight1-expressing neurons at the transition of the different sleep–wake states in the presence or absence of suvorexant. OxLight1 recordings performed in the absence of pharmacological treatment are shown in green, whereas recordings in the presence of suvorexant are shown in purple (n = 6 mice). Plotted changes in ΔF / F0 for each condition (treated versus untreated) represent pooled data from four animals implanted and recorded in the BF and two animals implanted and recorded in the LH. Transition from NREM to REM and from REM to wake (top). Transition from wake to NREM and from NREM to wake (bottom). Bar plots represent the difference in OxLight1 activity (normalized ΔF / F0) between maximum and minimum of the 15-s time point before and after the state transition. d, Bar plots showing the difference between mean ΔF / F0 of the sleep–wake states in OxLight1-injected animals between the nontreated and suvorexant-treated condition (n = 6 mice). Difference of ΔF / F0 NREM-REM (two-way ANOVA with Bonferroni’s multiple comparisons test; P = 0.0269) (left); difference of ΔF / F0 REM-wake (two-way ANOVA with Bonferroni’s multiple comparisons test; P = 0.0277) (right). All data are shown as mean ± s.e.m. Source data
Fig. 6
Fig. 6. Two-photon imaging of cortical orexin dynamics during emergence from anesthesia.
a, Experimental setup. Two-photon imaging was performed in the somatosensory cortex of mice resting inside a plastic tube. Isoflurane anesthesia was delivered for the first minute of the acquisition. b, Maximum intensity projections from one FOV in a mouse expressing OxLight1 in layer 2 of the somatosensory cortex (left) and one from a mouse expressing the control vector in the same region (right). Projections resulting from the first minute of imaging, during which mice received isoflurane (top). Projections obtained from the frames acquired during the last minute of imaging, when isoflurane anesthesia had been off for 5 to 7 min (bottom). Range of pixel intensities is the same for the two OxLight1 projections and for the two projections from the control FOV. c, Fluorescence traces representing the frame-by-frame average fluorescence from all pixels in eight FOVs from four mice expressing OxLight1. d, Same as in c, but for eight FOVs from four mice expressing the control vector. e, Difference between mean ΔF / F0 values during the first minute and the last minute of imaging in the eight FOVs shown in c and the eight FOVs shown in d (mean ± s.e.m.). Individual data are shown as gray dots and were jittered to improve visibility. One-sided unpaired Student’s t-test; P = 5.078 × 10−4. f, Average projection of one OxLight1 (top left) and one OxLight-ctr (top right) FOV after frame-by-frame binarization and deconvolution of the raw data. Black numbers indicate ROIs identified as inactive, whereas red numbers indicate active ROIs. Scale bar, 50 µm. Heat maps showing the raw fluorescence of the 20 ROIs identified in the OxLight1 (bottom left) and OxLight-ctr FOVs, during 4 min of imaging starting 1 min after anesthesia delivery was stopped. g, Pearson’s correlation coefficients between all ROI pairs in two example OxLight1 FOVs (top) and two OxLight-ctr FOVs. h, Average Pearson’s correlation coefficient for the ROI pairs in each OxLight1 FOV (n = 8) and in each OxLight-ctr FOV (n = 8). Individual data are shown as gray dots and were jittered to improve visibility. OxLight-ctr data were not normally distributed. One-sample Wilcoxon signed-rank test was used to analyze data, P = 0.007. Source data
Extended Data Fig. 1
Extended Data Fig. 1. Optimization of cpGFP insertion site into OX2R.
a, Sequence alignment of transmembrane domains (TM) 5 and 6 from OX2R, OX1R and DRD1 indicating the insertion site for the cpGFP module from dLight1. Color code is based on percent identity between orexin receptors and DRD1. b, Representative images showing membrane expression profile of sensor prototypes based on either the OX1 or OX2 receptor in HEK293T cells. c, Membrane expression and fluorescence response to 10 µM OXA of the OX1 and OX2 sensor prototypes shown in a-b. p = 0.3510, for the membrane expression and p = 1.109 × 10⁻⁷ for the fluorescence response. n = 15 cells from 3 independent experiments. d-i, cpGFP Insertion point optimization on the TM6 and TM5 of OX2R. The variant showing best membrane expression and response to 10 µM OXA was called OxLight0.1. d, Schematic representation of TM6 insertion site optimization. e, Representative images of TM6 insertion sites variants. f, Quantification of fluorescence responses to 10 µM OXA and surface expression from variants shown in e. p = 0.0047 for OX2 prototype response compared to OxLight0.1. n = 12 and 16 cells for OX2 prototype and OxLight0.1 or ≥ 5 cells for all other variants. g, Schematic representation of TM5 insertion site optimization. h, Representative images of TM5 insertion sites variants. i, Quantification of responses to 10 µM OXA and surface expression from variants shown in h for all variants. j-k, In vitro characterization of OxLight0.1 in HEK293T cells. j, Representative images of OxLight0.1 pre and post addition of 10 µM OXA. k, Response of OxLight0.1 to sequential addition of OXA or OXB followed by dual orexin receptor antagonist EMPA. n = 26 and 31 cells for OXA + EMPA and OXB + EMPA, respectively. All data are shown as mean ± s.e.m. All scale bars, 10 µm. All statistical tests performed using two-tailed student’s t-test with Welch’s correction. Source data
Extended Data Fig. 2
Extended Data Fig. 2. Optimization of OxLight0.1 dynamic range.
a, Fluorescence responses to 10 µM OXA of intracellular loop 2 (ICL2) variants of OxLight0.1. Left, every amino acid from the ICL2 was individually mutated to an alanine, lysine and glutamate. Right, site-saturated mutagenesis was performed on residue L160 which corresponds to F129 in dLight1. From this screening we selected two mutations (M161K and L160H) each of whom showed significantly higher responses compared to OxLight0.1 (n = 29 cells) (∆F/F0 = 153 ± 8%; p = 3.704 × 10⁻⁵ (n = 15 cells); ∆F/F0 = 168 ± 6%; p = 9.954 × 10⁻⁶ (n = 14 cells)), respectively). b, Fluorescence responses of OxLight0.1 TM5 variants generated as shown in the inset. The Q254E mutant showed a significantly higher response compared to OxLight0.1 (∆F/F0 = 194 ± 7%; p = 1.349 × 10⁻⁸) n = 28 and 20 cells from 3 independent experiments for OxLight0.1 and OxLight0.1-Q to E (TM5) respectively. c, Combination of beneficial mutations from both the ICL2 and TM5 screenings. The triple mutant containing M161K, L160H and Q254E had a greatly improved response: ∆F/F0 = 386 ± 25%; p = 4.843 × 10⁻⁹ (n = 19 cells) and was called OxLight0.2. d, Fluorescence responses of OxLight0.2 TM6 variants generated as shown in the inset. The K294R mutant showed a significantly higher response compared to OxLight0.2 (∆F/F0 = 915 ± 14%; p = 1.075 × 10⁻¹³ (n = 17 cells) and was called OxLight1. n.s., not significant. All data are shown as mean ± SEM with n ≥ 5 cells. All statistical tests have been performed using a Two-Tailed Student’s t-test with Welch’s correction with data resulting from three independent experiments. *** p < 0.0001. Source data
Extended Data Fig. 3
Extended Data Fig. 3. Development and characterization of a control sensor.
a, Representative images of HEK cells expressing different mutants of OxLight1, indicated by absolute residue numbering from the N-terminus of OX2R. b, Quantification of maximal ∆F/F0 in response to bath-applied orexin-A and orexin-B (both at 10 µM) for all mutants in a. The OxLight1 E54K + T111A mutant has a significantly decreased response compared to OxLight1: p = 2.174 × 10⁻²¹ with n = 32 and 25 cells, respectively. c, The two OxLight1 sites selected for the control sensor are highlighted in magenta in the structural model of OxLight1. Residue sidechains are shown for the two amino acid positions E541.32 and T1112.61. d, Representative images of OxLight-ctr expression in HEK cells and ∆F/F0 after addition of OXA or OXB. e, Identical to d, but in primary cultured neurons. f, Left, membrane ∆F/F0 in OxLight1 or OxLight-ctr expressing HEK cells from time lapse imaging experiments. Bars indicate bath application of orexins (black, both at 10 µM) followed by the OX2R antagonist EMPA (magenta, 10 µM). Right, quantification of maximal ∆F/F0 from time lapse imaging experiments shown on left. n = 16 and 21, cells for OxLight1 OXA HEK compared to OxLight-ctr OXA HEK (p = 1.640 × 10⁻¹⁹). n = 10 and 22 cells for OxLight1 OXB HEK compared to OxLight-ctr OXB HEK (p = 5.926 × 10⁻¹¹), Data are shown as mean ± SEM and all statistical analysis performed using Two tailed student’s t-test with Welch’s correction from 3 independent experiments. *** p < 0.0001. All scale bars, 10 µm. Source data
Extended Data Fig. 4
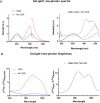
Extended Data Fig. 4. Spectral properties of OxLight1.
a, Left, One-photon fluorescence excitation (λ emission = 560 nm) and emission (λ excitation = 470 nm) spectra acquired from OxLight1-expressing HEK cells in the absence (No OXA) or presence (OXA) of orexin-A (OXA, 10 µM). Each trace is the average of 3 independent experiments (a.u. = arbitrary units). Right, ratio of fluorescence excitation spectra shown on left. b, Left, relative two photon brightness of OxLight1 expressed in HEK cells grown adherent on a glass coverslip. Each trace is the average of 3 independent experiments. Right, ratio of traces shown on left. In both a and b fluorescence excitation and emission were normalized to the respective maximal value in the absence of OXA. Source data
Extended Data Fig. 5
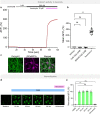
Extended Data Fig. 5. Brightness and p.H. sensitivity of OxLight1.
a, OxLight1 and OxLight-ctr brightness assessment in the presence or absence of 10 µM OXA compared to OX2R with C-terminally tagged GFP in HEK293T cells. All the data were normalized to OX2R-GFP mean fluorescence intensity. Representative images for each condition shown on top right, scale bars, 10 µm. p = 0,6367 for OxLight1+OXA compared to OX2R-GFP, two-tailed student’s t test with Welch’s correction. n = 104 cells from 3 different experiments for each condition. b, Comparison of OxLight1 fluorescence response to an equimolar mix of OXA and OXB (5 µM) (black) in PBS solutions at different pH levels. n = 60; 51; 53; 62; 63; 69; 71; 66; 57; 55; 69; 73; 57; 59; 52; 61; 53; 58; 51; 46; 51 cells for each dataset from p.H. 6 to 8, respectively. Each dataset was obtained from 3 independent experiments. All data are shown as mean ± SEM. Source data
Extended Data Fig. 6
Extended Data Fig. 6. Additional characterization of OxLight1.
a, Characterization of OxLight1 coupling to intracellular calcium activity in primary rat hippocampal neurons. Intracellular calcium dynamics were measured in co-transduced neurons expressing OxLight1 and jRCaMP1b. ΔF/F0 responses of jRCaMP1b were recorded after addition of vehicle (ACSF + 1 µM TTX), followed by 1 nM and 500 nM equimolar mix of OXA and OXB. Ligand addition is indicated by colored bars. Maximal intracellular calcium response was elicited with 10 µM ionomycin as a positive control. n = 41 neurons from 5 different experiments. b, Quantification of responses from a. Individual data points represent the average jRCaMP1b ΔF/F0 response of individual neurons for each condition. One-way ANOVA (p = 1.748 × 10−130) followed by Bonferroni’s multiple comparison test comparing vehicle against 1 nM OXA-OXB (adjusted p = 0,9601), 500 nM OXA-OXB (adjusted p = 0,6052) and 10 µM ionomycin (p = 9.685 × 10−118). ns, non-significant (p > 0.016); *** p < 0.0001 c, Representative images of neurons used in a-b. Scale bar, 10 µm. d, Representative images of OxLight1 fluorescence at the indicated time points before and after addition of OXB (5 µM) and almorexant (10 µM). Scale bar, 10 µm. e, Normalized fluorescence response values for OxLight1-expressing cells as in d. n = 24 cells from 3 different experiments. *** p < 0.0001, n.s. not significant. Brown-Forsythe one way ANOVA test comparing 10, 30, 60 and 90 min: p = 0.1221; Brown-Forsythe one way ANOVA test followed by post hoc Dunnett’s T3 multiple comparison test to compare HBSS to 10, 30, 60, 90 min and Almorexant. p = 0.2042 between HBSS and Almorexant. All data are shown as mean ± SEM. Source data
Extended Data Fig. 7
Extended Data Fig. 7. Characterization of sensor coupling to intracellular signaling partners.
a-e, Mini-G protein recruitment to wild-type orexin type-2 receptor (OX2R) or OxLight1. a, Agonist-induced membrane recruitment of mRuby-tagged mini-Gq, mini-Gs, mini-Gi or mini-G12 probes (collectively mini-Gx) in OX2R-expressing HEK293 cells upon OXB addition (50 nM). TIRF time-lapse movies frame-rate was 0.2/s. Signal quantification: agonist-induced ratio-change of mRuby-fluorescence compared to baseline (∆R/R0). n = 3 independent experiments for each mini-G. b, Membrane-recruitment normalized to M1-Alexa-647 fluorescence (before vs. 5 min after OXB addition) observed for constructs tested in a. Mini-Gq (n = 19 cells) compared to mini-Gi (n = 17 cells, p = 4.541×10⁻⁵), mini-Gs (n = 15 cells, p = 7.755×10⁻⁶) and miniG12 (n = 11 cells, p = 6.816×10⁻⁶). c, Recruitment of mRuby-tagged-mini-Gq measured as in a in OX2R- or OxLight1-expressing HEK293 cells (n = 3 independent experiments). d, Membrane-recruitment normalized to M1-Alexa-647 fluorescence (before vs. 5 minutes after OXB treatment) observed for constructs tested in c. p = 2.196×10⁻⁵ for OxLight1 compared to OX2R. n = 19 and 14 cells for OX2R and OxLight1, respectively. e, Membrane-recruitment (before vs. 5 minutes after OXB treatment) of mRuby-tagged-mini-Gs, mini-Gi or mini-G12 monitored in OxLight1-expressing HEK293 cells upon OXB addition (50 nM) compared to baseline (∆R/R0) and normalized to M1-Alexa-647 fluorescence. n = 19, n = 21 and 17 cells (n = 3 independent experiments) for mini-G12, mini-Gi and mini-Gs respectively. f, Membrane-recruitment of mCherry-tagged-beta-Arrestin-2 to activated OX2R or OxLight1 upon OXB addition (50 nM), measured as in a. and normalized to M1-Alexa-647 fluorescence g, Membrane-recruitment of mCherry-tagged-beta-Arrestin-2 (before vs. 15 min after OXB addition) observed for each construct tested in f. p = 4.603×10⁻⁶ for OxLight1 compared to OX2R. n = 19 and 23 cells (n = 5 independent experiments for OX2R and OxLight1, respectively). h, Representative images of cells from g at baseline and 15 minutes after stimulation with OXB (50 nM). Scale bars, 10 µm. All data shown as mean ± SEM, two-tailed student’s t test with Welch’s correction for all statistical analyses. Source data
Extended Data Fig. 8
Extended Data Fig. 8. Dynamic orexin fluctuations during brain states.
a, Schematic drawing of AAV injections in the LH and experimental setup for recording EEG, EMG and fiber photometry during sleep–wake states. b, Representative recordings showing (top to bottom) EEG spectrogram, EEG, EMG, hypnogram, and ΔF/F0 fluorescence trace of an OxLight1-injected animal. Left, example of a wake-predominant 30-minute recording, and right, example of a REM-predominant 30-minute recording. Both traces belong to the same OxLight1-injected animal. Hypnogram color-code: wake = green, NREM = blue, REM = orange. c, Medetomidine and isoflurane-induced modulation of OxLight1 signal in OxLight1-injected mice. Left, bar plots graph showing mean ΔF/F ± SEM of the sleep–wake and anesthetic-dependent states (medetomidine top left, isoflurane bottom left). Statistical analysis was performed using one-way ANOVA with Bonferroni’s multiple comparisons test n = 4 mice, p = 0.0191 for NREM vs REM (Medetomidine), p = 0.0216 for REM vs Medetomidine, p = 0.0118 for Wake vs REM, p = 0.0062 for Wake vs Isofuorane, p = 0.0032 for NREM vs REM (isoflurane), p = 0.0017 for REM vs Isofluorane. Right, representative hypnogram and trace of OxLight1 fluorescence in one-hour recording during medetomidine injection (top right) and isoflurane exposure (bottom right). Time spent under isoflurane-induced anesthesia: 12 minutes, time spent in medetomidine-induced anesthesia: 30 minutes. Source data
Extended Data Fig. 9
Extended Data Fig. 9. Immunohistochemical verification of orexinergic fibers in the somatosensory cortex.
a, A coronal section of the somatosensory cortex of one mouse showing the laminar spread of OxLight1. Scale bar, 100 µm. b, A high-magnification image (40x) of one coronal section from a brain expressing OxLight-ctr (green) in the somatosensory cortex layer 2/3 (L2/3). The section was stained with Hoechst dye (blue) and with an anti-Orexin-A antibody (white). Scale bar, 50 µm.
Extended Data Fig. 10
Extended Data Fig. 10. Characterization of OxLight1 and OxLight-ctr expression in somatosensory cortex.
a, Distributions of pixel-intensities for maximum-projections shown in Fig. 6b top-left (dark grey) and bottom left (light grey) from one FOV in a mouse expressing OxLight1. b, Same as in a for OxLight-ctr, related to Fig. 6b top-right (dark grey) and bottom right (light grey). c, Fluorescence traces representing frame-by-frame average fluorescence from all pixels in 2 FOVs from 2 mice expressing OxLight1 (left) or OxLight-ctr (right). Anesthesia was off for the first 2 minutes of imaging. d, Raw-fluorescence traces for 2 example OxLight1-FOVs and 2 example OxLight-ctr-FOVs, corresponding to a time window between the 3rd and 6th minute of imaging in each FOV. Boxes highlight the most-active minute. e, Mean across-frames s.d. calculated during the first minute of imaging and during the most-active minute, for each OxLight1 FOV (light-green) and OxLight-ctr-FOV (dark-green). Solid lines indicate mean across FOVs. OxLight1 data are normally distributed (paired t-test; p = 0.0013), while OxLight-ctr data are not (Wilcoxon signed-rank test; p = 0.57). f, Median pixel intensity values during the anaesthetized period (F0) in 8 OxLight1-FOVs and 8 OxLight-ctr-FOVs. The two distributions are not significantly different (unpaired t-test; p = 0.41). g, Heatmaps showing the frame-by-frame deconvolved activity in 20 ROIs from one example OxLight1-FOV (left) and one example OxLight-ctr-FOV (right). Solid vertical grey lines indicate the most-active minute. FOVs are the same as in Fig. 6 f. h, Heatmaps showing frame-by-frame raw fluorescence of each ROI in 2 example OxLight1-FOVs. Yellow lines indicate the most-active minute. i, Same as in h, but for 2 example OxLight-ctr-FOVs. j, Pearson’s correlation coefficients between all ROI pairs in 2 example OxLight1-FOVs, during the most-active minute. k, Same as in j, but for two example OxLight-ctr-FOVs. l, Pearson’s correlation coefficients in 8 OxLight1-FOVs across all pairs of active and inactive ROIs, during most-active minute (mean + /- SEM) (Wilcoxon signed-rank test; p = 0.0207). Source data

References

    1. Lecea Lde, et al. The hypocretins: hypothalamus-specific peptides with neuroexcitatory activity. PNAS. 1998;95:322–327. - PMC - PubMed
    1. Sakurai T, et al. Orexins and orexin receptors: a family of hypothalamic neuropeptides and G protein-coupled receptors that regulate feeding behavior. Cell. 1998;92:573–585. - PubMed
    1. Chemelli RM, et al. Narcolepsy in orexin knockout mice: molecular genetics of sleep regulation. Cell. 1999;98:437–451. - PubMed
    1. Hara J, et al. Genetic ablation of orexin neurons in mice results in narcolepsy, hypophagia, and obesity. Neuron. 2001;30:345–354. - PubMed
    1. Willie JT, et al. Distinct narcolepsy syndromes in orexin receptor-2 and orexin null mice: molecular genetic dissection of non-REM and REM sleep regulatory processes. Neuron. 2003;38:715–730. - PubMed

Publication types