

A Repurposed Drug Screen for Compounds Regulating Aquaporin 5 Stability in Lung Epithelial Cells
- PMID: 35145418
- PMCID: PMC8821664
- DOI: 10.3389/fphar.2022.828643
A Repurposed Drug Screen for Compounds Regulating Aquaporin 5 Stability in Lung Epithelial Cells
Abstract
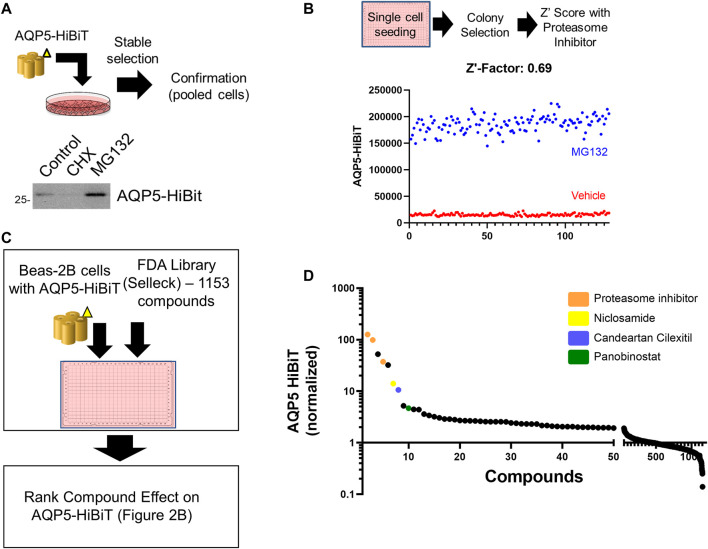
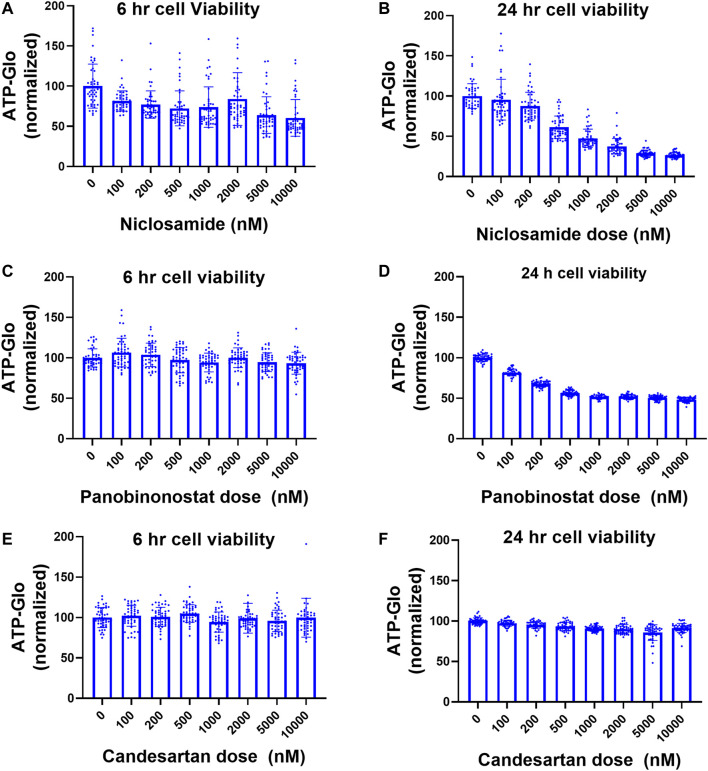
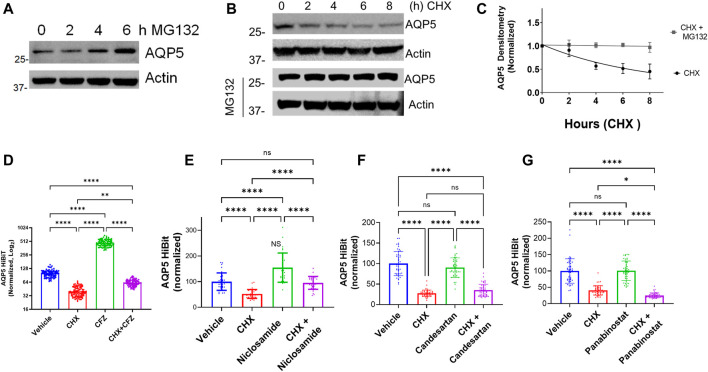
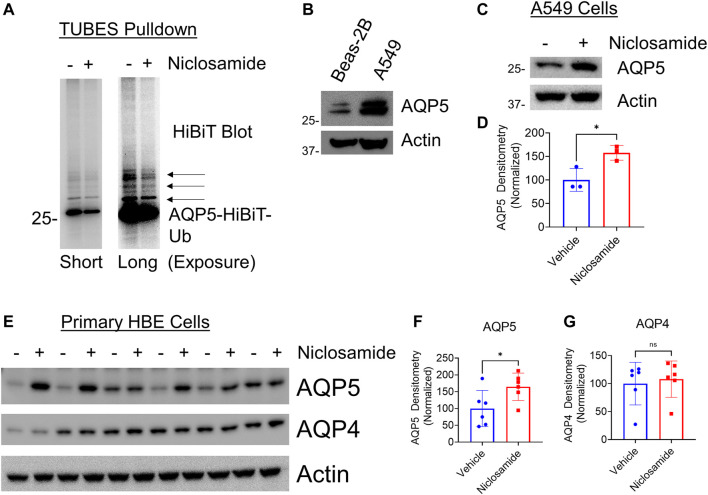
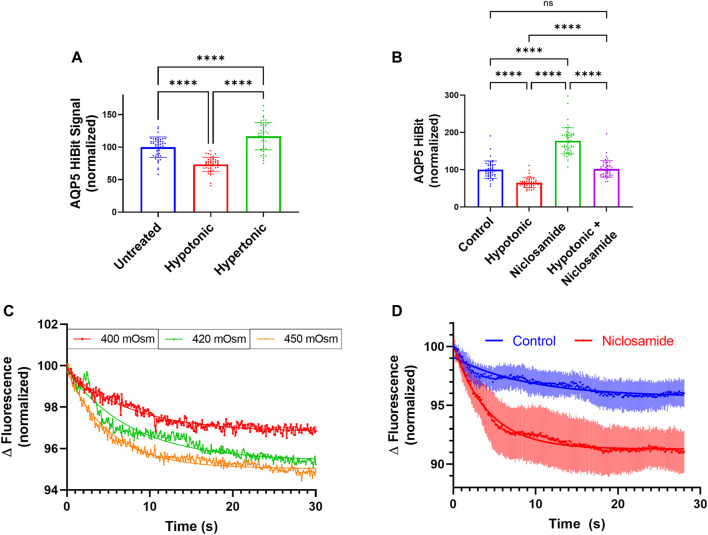
Aquaporin 5 (AQP5) is expressed in several cell types in the lung and regulates water transport, which contributes to barrier function during injury and the composition of glandular secretions. Reduced AQP5 expression is associated with barrier dysfunction during acute lung injury, and strategies to enhance its expression are associated with favorable phenotypes. Thus, pharmacologically enhancing AQP5 expression could be beneficial. Here, we optimized a high-throughput assay designed to detect AQP5 abundance using a cell line stably expressing bioluminescent-tagged AQP5. We then screened a library of 1153 compounds composed of FDA-approved drugs for their effects on AQP5 abundance. We show compounds Niclosamide, Panobinostat, and Candesartan Celexitil increased AQP5 abundance, and show that Niclosamide has favorable cellular toxicity profiles. We determine that AQP5 levels are regulated in part by ubiquitination and proteasomal degradation in lung epithelial cells, and mechanistically Niclosamide increases AQP5 levels by reducing AQP5 ubiquitination and proteasomal degradation. Functionally, Niclosamide stabilized AQP5 levels in response to hypotonic stress, a stimulus known to reduce AQP5 levels. In complementary assays, Niclosamide increased endogenous AQP5 in both A549 cells and in primary, polarized human bronchial epithelial cells compared to control-treated cells. Further, we measured rapid cell volume changes in A549 cells in response to osmotic stress, an effect controlled by aquaporin channels. Niclosamide-treated A549 cell volume changes occurred more rapidly compared to control-treated cells, suggesting that increased Niclosamide-mediated increases in AQP5 expression affects functional water transport. Taken together, we describe a strategy to identify repurposed compounds for their effect on AQP5 protein abundance. We validated the effects of Niclosamide on endogenous AQP5 levels and in regulating cell-volume changes in response to tonicity changes. Our findings highlight a unique approach to screen for drug effects on protein abundance, and our workflow can be applied broadly to study compound effects on protein abundance in lung epithelial cells.
Keywords: Aquaporin 5; Niclosamide; lung epithelial cells; proteasome; repurposed drugs.
Copyright © 2022 Villandre, White, Lear, Chen, Tuncer, Vaiz, Tuncer, Lockwood, Camarco, Liu, Chen and Evankovich.
Conflict of interest statement
The authors declare that the research was conducted in the absence of any commercial or financial relationships that could be construed as a potential conflict of interest.
Figures

Similar articles
-
Transient receptor potential vanilloid 4 regulates aquaporin-5 abundance under hypotonic conditions.Proc Natl Acad Sci U S A. 2006 Mar 21;103(12):4747-52. doi: 10.1073/pnas.0511211103. Epub 2006 Mar 13. Proc Natl Acad Sci U S A. 2006. PMID: 16537379 Free PMC article.
-
Aquaporin 5 regulates cigarette smoke induced emphysema by modulating barrier and immune properties of the epithelium.Tissue Barriers. 2013 Oct 1;1(4):e25248. doi: 10.4161/tisb.25248. Epub 2013 Jun 3. Tissue Barriers. 2013. PMID: 24665410 Free PMC article.
-
cAMP has distinct acute and chronic effects on aquaporin-5 in lung epithelial cells.J Biol Chem. 2005 Feb 4;280(5):3590-6. doi: 10.1074/jbc.M411038200. Epub 2004 Nov 9. J Biol Chem. 2005. PMID: 15536076 Free PMC article.
-
Hypertonic induction of aquaporin-5: novel role of hypoxia-inducible factor-1alpha.Am J Physiol Cell Physiol. 2007 Apr;292(4):C1280-90. doi: 10.1152/ajpcell.00070.2006. Epub 2006 Nov 15. Am J Physiol Cell Physiol. 2007. PMID: 17108010
-
Silencing of aquaporin 5 inhibits the growth of A549 lung cancer cells in vitro and in vivo.Int J Oncol. 2018 May;52(5):1643-1650. doi: 10.3892/ijo.2018.4326. Epub 2018 Mar 16. Int J Oncol. 2018. PMID: 29568884
Cited by
-
Aquaporin-5 Protein Is Selectively Reduced in Rat Parotid Glands under Conditions of Fasting or a Liquid Diet.Acta Histochem Cytochem. 2024 Feb 29;57(1):25-33. doi: 10.1267/ahc.24-00003. Epub 2024 Feb 23. Acta Histochem Cytochem. 2024. PMID: 38463206 Free PMC article.
-
Exploring Aquaporins in Human Studies: Mechanisms and Therapeutic Potential in Critical Illness.Life (Basel). 2024 Dec 20;14(12):1688. doi: 10.3390/life14121688. Life (Basel). 2024. PMID: 39768394 Free PMC article. Review.
-
Aquaporin-5 Dynamic Regulation.Int J Mol Sci. 2023 Jan 18;24(3):1889. doi: 10.3390/ijms24031889. Int J Mol Sci. 2023. PMID: 36768212 Free PMC article. Review.
-
Role of aquaporins in brain water transport and edema.Front Neurosci. 2025 Jan 29;19:1518967. doi: 10.3389/fnins.2025.1518967. eCollection 2025. Front Neurosci. 2025. PMID: 39944892 Free PMC article. Review.
-
The Expanding Role of Aquaporin-1, Aquaporin-3 and Aquaporin-5 as Transceptors: Involvement in Cancer Development and Potential Druggability.Int J Mol Sci. 2025 Feb 4;26(3):1330. doi: 10.3390/ijms26031330. Int J Mol Sci. 2025. PMID: 39941100 Free PMC article. Review.
References
Grants and funding
LinkOut - more resources
Full Text Sources