. 2022 Jan 26:12:816058.
doi: 10.3389/fphys.2021.816058. eCollection 2021.

Rapid Assessment of Insect Steroid Hormone Entry Into Cultured Cells

Affiliations

Rapid Assessment of Insect Steroid Hormone Entry Into Cultured Cells

Mitchell Masterson et al. Front Physiol. .

Abstract

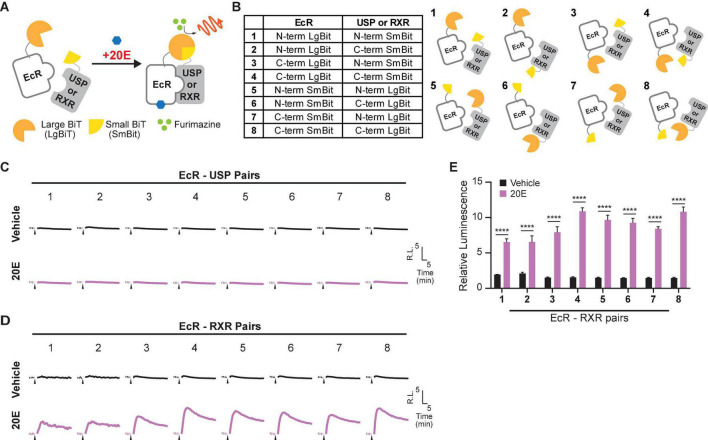
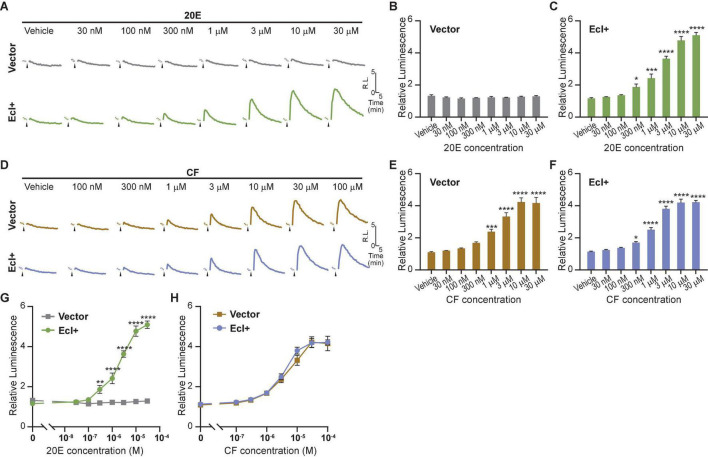
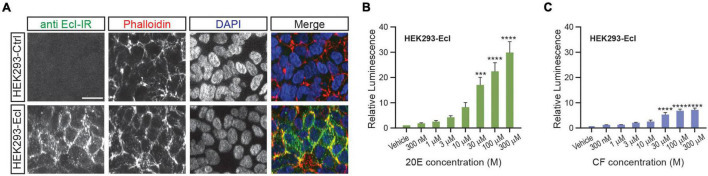
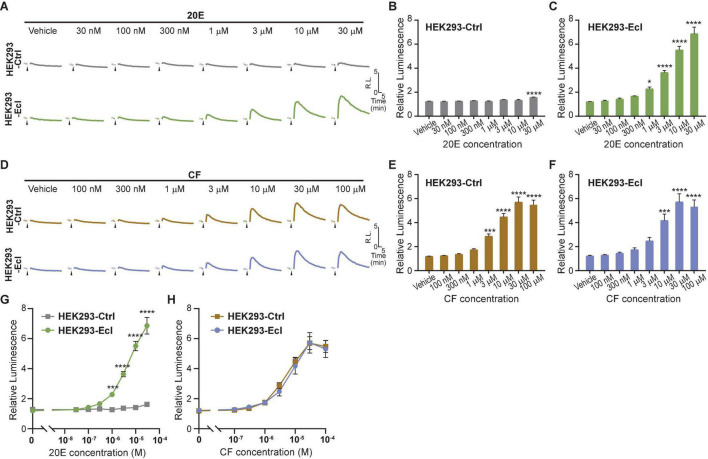
Steroid hormones control development and homeostasis in a wide variety of animals by interacting with intracellular nuclear receptors. Recent discoveries in the fruit fly Drosophila melanogaster revealed that insect steroid hormones or ecdysteroids are incorporated into cells through a membrane transporter named Ecdysone Importer (EcI), which may become a novel target for manipulating steroid hormone signaling in insects. In this study, we established an assay system that can rapidly assess EcI-mediated ecdysteroid entry into cultured cells. Using NanoLuc Binary Technology (NanoBiT), we first developed an assay to detect ligand-dependent heterodimerization of the ecdysone receptor (EcR) and retinoid X receptor (RXR) in human embryonic kidney (HEK) 293T cells. We also developed HEK293 cells that stably express EcI. By combining these tools, we can monitor ecdysteroid entry into the cells in real time, making it a reliable system to assess EcI-mediated steroid hormone incorporation into animal cells.

Keywords: Ecdysone Importer; NanoBiT assay; cellular uptake; ecdysone receptor (EcR); ecdysteroid; nuclear receptor (NR); steroid hormone; transporter.


Conflict of interest statement

RB, SH-Y, and NY have a patent (U.S. Patent No. 10,228,380) relevant to this work. The remaining authors declare that the research was conducted in the absence of any commercial or financial relationships that could be construed as a potential conflict of interest.

Figures

FIGURE 1
FIGURE 1
Optimization of the EcR-RXR NanoBiT assay. (A) Schematic diagram of the NanoBiT 20E reporter system. EcR and either USP or RXR are expressed as fusion proteins with LgBiT and SmBiT, respectively. When the NanoBiT partners are brought in close proximity by EcR dimerization with USP or RXR in the presence of 20E, the NanoBiT partners form a functional luciferase enzyme which produces an observable light signal in the presence of the substrate furimazine. (B) Table (left) and schematics (right) showing the fusion protein pairs used in optimization testing. Eight different options are available as LgBiT or SmBiT could be fused to either protein and the fusion at either the N- or C-terminus. (C,D) Mean time-course changes of the relative luminescence in HEK293T cells expressing EcI and each of the NanoBiT EcR-USP (C) or EcR-RXR (D) combinations 1–8 listed in panel (B). Black triangles indicate the time point when either EtOH or 10 μM 20E was added to the medium. Data were normalized to the average of the basal luminescence reading immediately prior to treatment (dashed lines). R.L., relative luminescence. (E) Maximum relative luminescence from the EcR-RXR pairs for each of the combinations 1–8 listed in panel (B). Bars represent means ± S.E.M. (n = 3). Analysis by two-way ANOVA identified a significant interaction of the NanoBiT pair in response to the 20E treatment [F(7, 32) = 8.32, p < 0.0001]. ****p < 0.0001 by multiple comparisons using Sidak’s correction.
FIGURE 2
FIGURE 2
Detection of 20E and CF entry into HEK293T cells using the NanoBiT assay. (A) Mean time-course changes of the relative luminescence in HEK293T cells transfected with RXR-SmBiT and EcR-LgBiT reporters. Either an EcI-containing vector (EcI +) or an empty vector (Vector) was co-transfected, and the luminescence was monitored in real time in response to different doses of 20E. Black triangles indicate the time point when 20E was added to the medium. Data were normalized to the average of the basal luminescence reading immediately prior to treatment (dashed lines). R.L., relative luminescence. (B,C) Maximum relative luminescence in response to different doses of 20E in the Vector (B) or EcI + (C) HEK293T cells. Bars represent means ± S.E.M. (n = 4). One-way ANOVA analysis identified no significant effect in the Vector cells [F(7,24) = 1.16, p = 0.362, (B)], whereas significant effects were observed in the EcI + cells [F(7,24) = 85.97, p < 0.0001, (C)]. *, ***, and **** indicate p < 0.05, 0.001, and 0.0001, respectively, from multiple comparisons to the vehicle treatment using Dunnett’s correction. (D) Mean time-course changes of the relative luminescence in HEK293T cells transfected with RXR-SmBiT and EcR-LgBiT reporters. Either an EcI-containing vector (EcI +) or an empty vector (Vector) was co-transfected, and the luminescence was monitored in real time in response to different doses of CF. Black triangles indicate the time point when CF was added to the medium. Data were normalized to the average of the basal luminescence reading immediately prior to treatment (dashed lines). R.L., relative luminescence. (E,F) Maximum relative luminescence in response to different doses of CF in the Vector (E) or EcI + (F) HEK293T cells. Bars represent means ± S.E.M. (n = 4). One-way ANOVA analysis identified a significant effect in the Vector cells [F(7, 24) = 45.68, p < 0.0001, (E)] and in the EcI + cells [F(7,24) = 112.9, p < 0.0001, (F)]. *, ***, and **** indicate p < 0.05, 0.001, and 0.0001, respectively, from multiple comparisons to the vehicle treatment using Dunnett’s correction. (G,H) 20E (G) and CF (H) dose-response relationship in the Vector and EcI + HEK293T cells. All values are the means ± S.E.M. (n = 4) replotted from panels (B,C,E,F). Two-way ANOVAs identified a significant interaction of the 20E concentration with EcI expression [F(7, 48) = 77.30, p < 0.0001, (G)] and only main effect of CF concentration independent of EcI expression [F(7, 48) = 131.5, p < 0.0001, (H)]. **, and **** indicate p < 0.01, and 0.0001, respectively, from multiple comparisons using Sidak’s correction within each concentration of 20E between the EcI + and Vector cells.
FIGURE 3
FIGURE 3
Establishment of an EcI-expressing HEK293 cell line. (A) Immunocytochemistry of HEK293-Ctrl and -EcI cells using anti-EcI antibodies (green in merged images). Filamentous actin of the cytoskeleton and cell nuclei were stained with phalloidin (red in merged images) and DAPI (blue in merged images), respectively. Scale bar, 20 μm. (B,C) Luciferase reporter activity in HEK293-EcI cells in response to different concentrations of 20E (B) or CF (C). All values are the means ± S.E.M. [n = 6 in panel (B) and 5 in panel (C)]. One-way ANOVAs identified a significant effect of the 20E concentration [F(7, 40) = 21.23, p < 0.0001, (B)] and the CF concentration [F(7, 32) = 22.25, p < 0.0001, (C)]. ***, and **** indicate p < 0.001, and 0.0001, respectively, from multiple comparisons to the vehicle treatment using Dunnett’s correction.
FIGURE 4
FIGURE 4
Detection of 20E and CF entry into HEK293-EcI and -Ctrl cells using the NanoBiT assay. (A) Mean time-course changes of the relative luminescence in HEK293-Ctrl or -EcI cells transfected with RXR-SmBiT and EcR-LgBiT reporters in response to different doses of 20E. (B,C) Maximum relative luminescence in response to different doses of 20E in HEK293-Ctrl (B) or -EcI (C) cells. Bars represent means ± S.E.M. (n = 4). One-way ANOVA analysis identified a significant effect in HEK293-Ctrl cells [F(7, 24) = 7.11, p < 0.001, (B)] and HEK293-EcI cells [F(7,24) = 79.05, p < 0.0001, (C)]. * and **** indicate p < 0.05, and 0.0001, respectively, from multiple comparisons to the vehicle treatment using Dunnett’s correction. Note that the larger variance across the samples in the HEK293-EcI cell data reduces the significances of the individual comparisons in a way which does not occur in the HEK293-Ctrl cells hence the smaller difference in panel (B) accounting for more significance in the multiple comparisons compared to that observed in panel (C). (D) Mean time-course changes of the relative luminescence in HEK293-Ctrl or -EcI cells transfected with RXR-SmBiT and EcR-LgBiT reporters in response to different doses of CF. (E,F) Maximum relative luminescence in response to different doses of CF in the HEK293-Ctrl (E) or -EcI (F) cells. Bars represent means ± S.E.M. (n = 4). One-way ANOVA analysis identified a significant effect in HEK293-Ctrl cells [F(7, 24) = 62.65, p < 0.0001, (E)] and HEK293-EcI cells [F(7,24) = 23.29, p < 0.0001, (F)]. ***, and **** indicate p < 0.001, and 0.0001, respectively, from multiple comparisons to the vehicle treatment using Dunnett’s correction. (G,H) 20E (G) and CF (H) dose-response relationship in HEK293-Ctrl and -EcI cells. All values are the means ± S.E.M. (n = 4) replotted from panels (B,C,E,F). Two-way ANOVAs identified a significant interaction of the 20E concentration with EcI expression [F(7, 48) = 69.72, p < 0.0001, (G)] and only a main effect of CF concentration, independent of EcI expression [F(7, 48) = 68.88, p < 0.0001, (H)]. ***, and **** indicate p < 0.001, and 0.0001, respectively, from multiple comparisons using Sidak’s correction within each concentration of 20E between HEK293-Ctrl and HEK293-EcI cells.

Similar articles

Cited by

References

    1. Attard G., Cooper C. S., De Bono J. S. (2009). Steroid hormone receptors in prostate cancer: a hard habit to break? Cancer Cell 16 458–462. 10.1016/j.ccr.2009.11.006 - DOI - PubMed
    1. Clemons M., Goss P. (2001). Estrogen and the risk of breast cancer. N. Engl. J. Med. 344 276–285. - PubMed
    1. Devarakonda S., Harp J. M., Kim Y., Ozyhar A., Rastinejad F. (2003). Structure of the heterodimeric ecdysone receptor DNA-binding complex. EMBO J. 22 5827–5840. 10.1093/emboj/cdg569 - DOI - PMC - PubMed
    1. Dhadialla T. S., Retnakaran A., Smagghe G. (2005). “Insect growth- and development-disrupting insecticides,” in Comprehensive Molecular Insect Science, eds Gilbert L. I., Iatrou K., Gill S. S. (Amsterdam: Elsevier; ), 55–115. 10.3390/molecules24234304 - DOI
    1. Dixon A. S., Schwinn M. K., Hall M. P., Zimmerman K., Otto P., Lubben T. H., et al. (2016). NanoLuc complementation reporter optimized for accurate measurement of protein interactions in cells. ACS Chem. Biol. 11 400–408. 10.1021/acschembio.5b00753 - DOI - PubMed