

Glufosinate-Ammonium Induced Aberrant Histone Modifications in Mouse Sperm Are Concordant With Transcriptome in Preimplantation Embryos
- PMID: 35145430
- PMCID: PMC8821811
- DOI: 10.3389/fphys.2021.819856
Glufosinate-Ammonium Induced Aberrant Histone Modifications in Mouse Sperm Are Concordant With Transcriptome in Preimplantation Embryos
Abstract
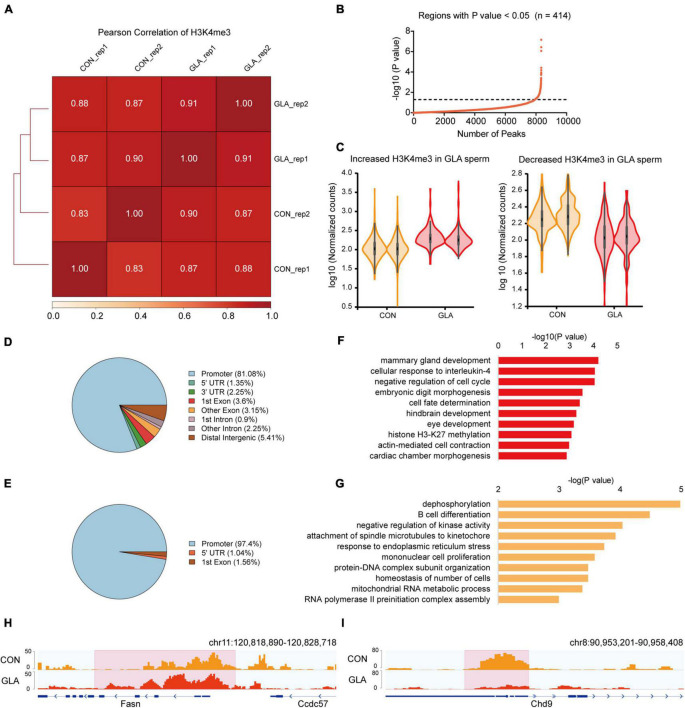
Glufosinate-ammonium (GLA) is a widely used herbicide with emerging concern over its male reproductive toxicity. Abnormalities in sperm histone modification induced by GLA exposure observed in our previous study aroused our interest in whether such alterations could further affect embryonic gene expression. Here we administered adult male mice with 0.2 mg/kg⋅day of GLA for 5 weeks to collect their sperm or 4-cell embryos after copulation. Cleavage Under Targets and Tagmentation (CUT&Tag) sequencing showed alterations of sperm H3 lysine 4 trimethylation (H3K4me3) and histone H3 lysine 27 acetylation (H3K27ac), which are active histone modification marks involved in embryo development, while RNA sequencing identified differentially expressed genes in 4-cell embryos. Differentially H3K4me3 and H3K27ac occupied regions were mainly distributed at the gene promoters and putative enhancers, and were enriched in pathways related to the immune system and nervous system. Integrative analysis of these sequencing data showed that genes such as Mgl2 with increased H3K4me3 and H3K27ac in sperm were up-regulated in embryos, and vice versa for genes such as Dcn. Additionally, differentially occupied H3K4me3 and H3K27ac in sperm were linked to gene expression changes in both paternal and maternal alleles of 4-cell embryos. In conclusion, GLA-induced changes in sperm H3K4me3 and H3K27ac are concordant with gene expression in preimplantation embryos, which might further affect embryo development and offspring health.
Keywords: H3K27ac; H3K4me3; embryo development; glufosinate-ammonium; sperm.
Copyright © 2022 Ma, Fan, Xiao, Ding, Hu and Xia.
Conflict of interest statement
The authors declare that the research was conducted in the absence of any commercial or financial relationships that could be construed as a potential conflict of interest.
Figures


Similar articles
-
Effects of glufosinate-ammonium on male reproductive health: Focus on epigenome and transcriptome in mouse sperm.Chemosphere. 2022 Jan;287(Pt 4):132395. doi: 10.1016/j.chemosphere.2021.132395. Epub 2021 Sep 28. Chemosphere. 2022. PMID: 34597628
-
Chromatin alterations during the epididymal maturation of mouse sperm refine the paternally inherited epigenome.Epigenetics Chromatin. 2022 Jan 6;15(1):2. doi: 10.1186/s13072-021-00433-4. Epigenetics Chromatin. 2022. PMID: 34991687 Free PMC article.
-
Determining the effects of paternal obesity on sperm chromatin at histone H3 lysine 4 tri-methylation in relation to the placental transcriptome and cellular composition.Elife. 2024 Nov 29;13:e83288. doi: 10.7554/eLife.83288. Elife. 2024. PMID: 39612469 Free PMC article.
-
The contribution of human sperm proteins to the development and epigenome of the preimplantation embryo.Hum Reprod Update. 2018 Sep 1;24(5):535-555. doi: 10.1093/humupd/dmy017. Hum Reprod Update. 2018. PMID: 29800303 Review.
-
Bivalent histone modifications in early embryogenesis.Curr Opin Cell Biol. 2012 Jun;24(3):374-86. doi: 10.1016/j.ceb.2012.03.009. Epub 2012 Apr 17. Curr Opin Cell Biol. 2012. PMID: 22513113 Free PMC article. Review.
Cited by
-
Impact of Endocrine Disruptors upon Non-Genetic Inheritance.Int J Mol Sci. 2022 Mar 20;23(6):3350. doi: 10.3390/ijms23063350. Int J Mol Sci. 2022. PMID: 35328771 Free PMC article. Review.
-
Emerging evidence that the mammalian sperm epigenome serves as a template for embryo development.Nat Commun. 2023 Apr 14;14(1):2142. doi: 10.1038/s41467-023-37820-2. Nat Commun. 2023. PMID: 37059740 Free PMC article. Review.
-
Beyond Genes: Mechanistic and Epidemiological Insights into Paternal Environmental Influence on Offspring Health.Curr Environ Health Rep. 2025 Aug 9;12(1):29. doi: 10.1007/s40572-025-00488-5. Curr Environ Health Rep. 2025. PMID: 40782138 Review.
-
Toxicological Effects of Glufosinate-Ammonium-Containing Commercial Formulations on Biomphalaria glabrata in Aquatic Environments: A Multidimensional Study from Embryotoxicity to Histopathology.Toxics. 2025 Jun 24;13(7):528. doi: 10.3390/toxics13070528. Toxics. 2025. PMID: 40710973 Free PMC article.
-
Integrating Transcriptomic and ChIP-Seq Reveals Important Regulatory Regions Modulating Gene Expression in Myometrium during Implantation in Pigs.Biomolecules. 2022 Dec 26;13(1):45. doi: 10.3390/biom13010045. Biomolecules. 2022. PMID: 36671430 Free PMC article.
References
-
- Bienvenu J. F., Bélanger P., Gaudreau É, Provencher G., Fleury N. (2021). Determination of glyphosate, glufosinate and their major metabolites in urine by the UPLC-MS/MS method applicable to biomonitoring and epidemiological studies. Anal. Bioanal. Chem. 413 2225–2234. 10.1007/s00216-021-03194-x - DOI - PubMed
LinkOut - more resources
Full Text Sources
Miscellaneous