

Exercise Increases Bone in SEIPIN Deficient Lipodystrophy, Despite Low Marrow Adiposity
- PMID: 35145475
- PMCID: PMC8822583
- DOI: 10.3389/fendo.2021.782194
Exercise Increases Bone in SEIPIN Deficient Lipodystrophy, Despite Low Marrow Adiposity
Abstract
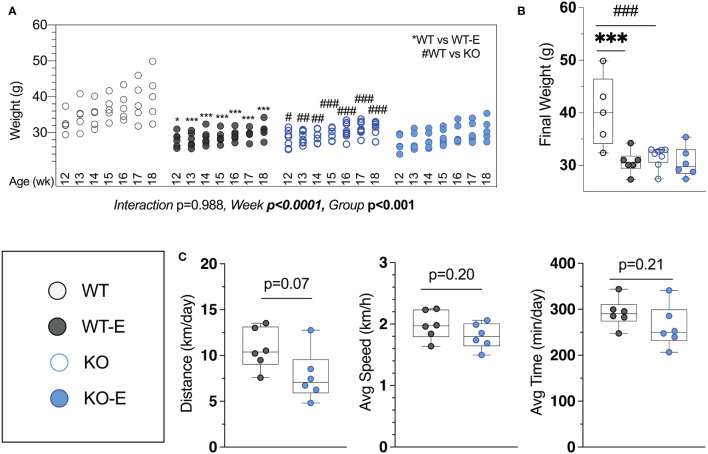
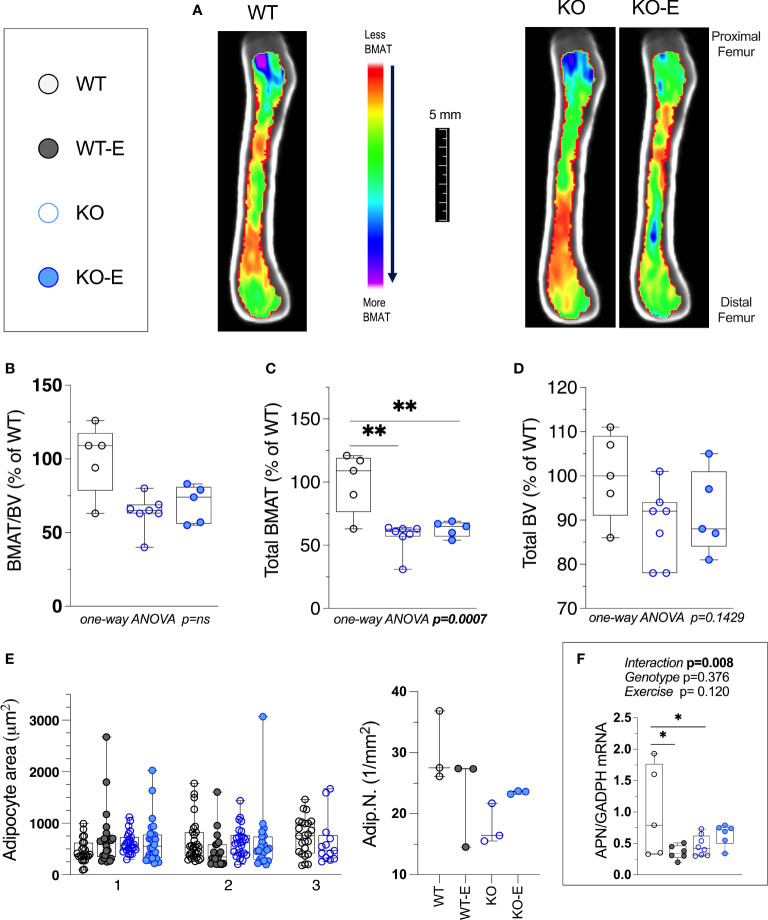
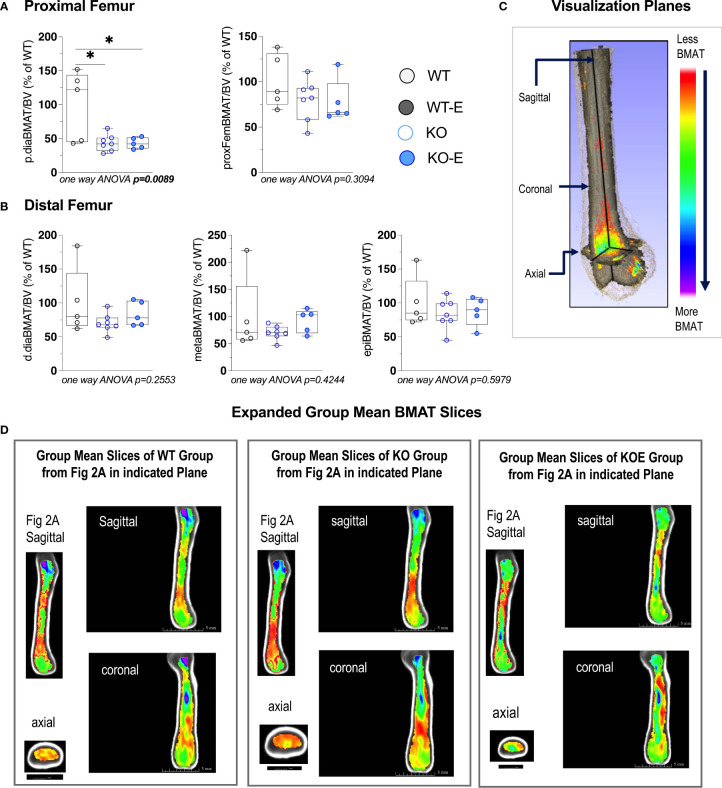
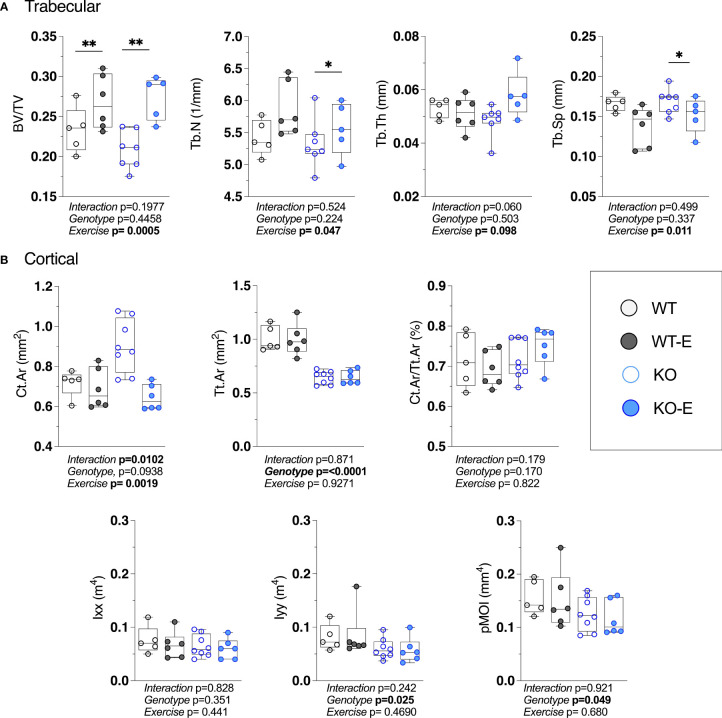
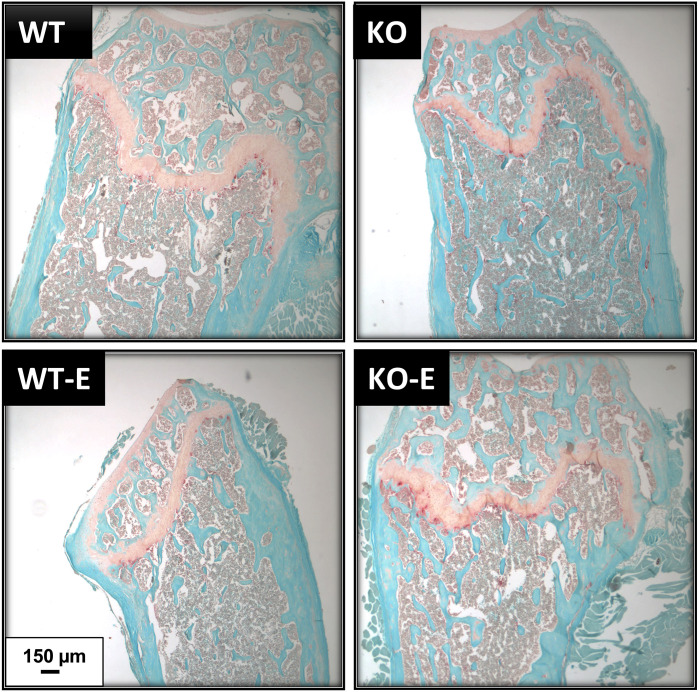
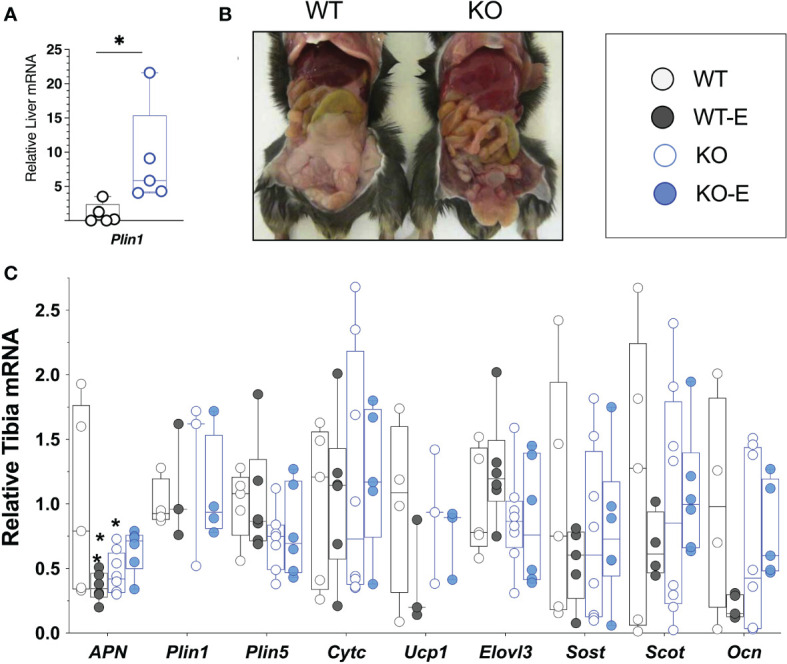
Exercise, typically beneficial for skeletal health, has not yet been studied in lipodystrophy, a condition characterized by paucity of white adipose tissue, with eventual diabetes, and steatosis. We applied a mouse model of global deficiency of Bscl2 (SEIPIN), required for lipid droplet formation. Male twelve-week-old B6 knockouts (KO) and wild type (WT) littermates were assigned six-weeks of voluntary, running exercise (E) versus non-exercise (N=5-8). KO weighed 14% less than WT (p=0.01) and exhibited an absence of epididymal adipose tissue; KO liver Plin1 via qPCR was 9-fold that of WT (p=0.04), consistent with steatosis. Bone marrow adipose tissue (BMAT), unlike white adipose, was measurable, although 40.5% lower in KO vs WT (p=0.0003) via 9.4T MRI/advanced image analysis. SEIPIN ablation's most notable effect marrow adiposity was in the proximal femoral diaphysis (-56% KO vs WT, p=0.005), with relative preservation in KO-distal-femur. Bone via μCT was preserved in SEIPIN KO, though some quality parameters were attenuated. Running distance, speed, and time were comparable in KO and WT. Exercise reduced weight (-24% WT-E vs WT p<0.001) but not in KO. Notably, exercise increased trabecular BV/TV in both (+31%, KO-E vs KO, p=0.004; +14%, WT-E vs WT, p=0.006). The presence and distribution of BMAT in SEIPIN KO, though lower than WT, is unexpected and points to a uniqueness of this depot. That trabecular bone increases were achievable in both KO and WT, despite a difference in BMAT quantity/distribution, points to potential metabolic flexibility during exercise-induced skeletal anabolism.
Keywords: BSCL2; SEIPIN; anabolism; bone; bone marrow adipose tissue (BMAT); congenital lipodystrophy; endocrinology and metabolism; exercise.
Copyright © 2022 McGrath, Little-Letsinger, Sankaran, Sen, Xie, Styner, Zong, Chen, Rubin, Klett, Coleman and Styner.
Conflict of interest statement
The authors declare that the research was conducted in the absence of any commercial or financial relationships that could be construed as a potential conflict of interest.
Figures
Similar articles
-
Adipose transplantation improves metabolism and atherosclerosis but not perivascular adipose tissue abnormality or vascular dysfunction in lipodystrophic Seipin/Apoe null mice.Am J Physiol Cell Physiol. 2024 May 1;326(5):C1410-C1422. doi: 10.1152/ajpcell.00698.2023. Epub 2024 Mar 25. Am J Physiol Cell Physiol. 2024. PMID: 38525541 Free PMC article.
-
Adipose-specific knockout of SEIPIN/BSCL2 results in progressive lipodystrophy.Diabetes. 2014 Jul;63(7):2320-31. doi: 10.2337/db13-0729. Epub 2014 Mar 12. Diabetes. 2014. PMID: 24622797
-
Seipin Deficiency as a Model of Severe Adipocyte Dysfunction: Lessons from Rodent Models and Teaching for Human Disease.Int J Mol Sci. 2022 Jan 11;23(2):740. doi: 10.3390/ijms23020740. Int J Mol Sci. 2022. PMID: 35054926 Free PMC article. Review.
-
Adipose specific disruption of seipin causes early-onset generalised lipodystrophy and altered fuel utilisation without severe metabolic disease.Mol Metab. 2018 Apr;10:55-65. doi: 10.1016/j.molmet.2018.01.019. Epub 2018 Jan 31. Mol Metab. 2018. PMID: 29459250 Free PMC article.
-
Function of seipin: new insights from Bscl2/seipin knockout mouse models.Biochimie. 2014 Jan;96:166-72. doi: 10.1016/j.biochi.2013.06.022. Epub 2013 Jul 2. Biochimie. 2014. PMID: 23831461 Review.
Cited by
-
Diet-Stimulated Marrow Adiposity Fails to Worsen Early, Age-Related Bone Loss.Obes Facts. 2024;17(2):145-157. doi: 10.1159/000536159. Epub 2024 Jan 15. Obes Facts. 2024. PMID: 38224679 Free PMC article.
-
The skeleton in a physical world.Exp Biol Med (Maywood). 2022 Dec;247(24):2213-2222. doi: 10.1177/15353702221113861. Epub 2022 Aug 19. Exp Biol Med (Maywood). 2022. PMID: 35983849 Free PMC article. Review.
-
Role of Seipin in Human Diseases and Experimental Animal Models.Biomolecules. 2022 Jun 17;12(6):840. doi: 10.3390/biom12060840. Biomolecules. 2022. PMID: 35740965 Free PMC article. Review.
References
Publication types
MeSH terms
Substances
Grants and funding
LinkOut - more resources
Full Text Sources
Molecular Biology Databases
Research Materials