Extracellular Vesicles as Biomarkers of Acute Graft-vs.-Host Disease After Haploidentical Stem Cell Transplantation and Post-Transplant Cyclophosphamide
- PMID: 35145514
- PMCID: PMC8821147
- DOI: 10.3389/fimmu.2021.816231
Extracellular Vesicles as Biomarkers of Acute Graft-vs.-Host Disease After Haploidentical Stem Cell Transplantation and Post-Transplant Cyclophosphamide
Abstract
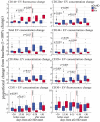
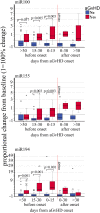
Even with high-dose post-transplant cyclophosphamide (PT-Cy) which was initially introduced for graft-versus-host disease (GvHD) prevention in the setting of HLA-haploidentical transplantation, both acute and chronic GvHDs remain a major clinical challenge. Despite improvements in the understanding of the pathogenesis of both acute and chronic GvHDs, reliable biomarkers that predict their onset have yet to be identified. We recently studied the potential correlation between extracellular vesicles (EVs) and the onset of acute (a)GvHD in transplant recipients from related and unrelated donors. In the present study, we further investigated the role of the expression profile of membrane proteins and their microRNA (miRNA) cargo (miRNA100, miRNA155, and miRNA194) in predicting the onset of aGvHD in haploidentical transplant recipients with PT-Cy. Thirty-two consecutive patients were included. We evaluated the expression profile of EVs, by flow cytometry, and their miRNA cargo, by real-time PCR, at baseline, prior, and at different time points following transplant. Using logistic regression and Cox proportional hazard models, a significant association between expression profiles of antigens such as CD146, CD31, CD140a, CD120a, CD26, CD144, and CD30 on EVs, and their miRNA cargo with the onset of aGvHD was observed. Moreover, we also investigated a potential correlation between EV expression profile and cargo with plasma biomarkers (e.g., ST2, sTNFR1, and REG3a) that had been associated with aGVHD previously. This analysis showed that the combination of CD146, sTNFR1, and miR100 or miR194 strongly correlated with the onset of aGvHD (AUROC >0.975). A large prospective multicenter study is currently in progress to validate our findings.
Keywords: acute GvHD; biomarkers; correlation; extracellular vesicles; haploidentical; miRNA.
Copyright © 2022 Lia, Di Vito, Bruno, Tapparo, Brunello, Santoro, Mariotti, Bramanti, Zaghi, Calvi, Comba, Fascì, Giaccone, Camussi, Boyle, Castagna, Evangelista, Mavilio and Bruno.
Conflict of interest statement
The authors declare that the research was conducted in the absence of any commercial or financial relationships that could be construed as a potential conflict of interest.
Figures


Similar articles
-
Extracellular vesicles: a new frontier in diagnosing and treating graft-versus-host disease after allogeneic hematopoietic cell transplantation.J Nanobiotechnology. 2025 Mar 26;23(1):251. doi: 10.1186/s12951-025-03297-y. J Nanobiotechnology. 2025. PMID: 40133949 Free PMC article. Review.
-
Elafin as a Predictive Biomarker of Acute Skin Graft-Versus-Host Disease After Haploidentical Stem Cell Transplantation Using Post-Transplant High-Dose Cyclophosphamide.Front Immunol. 2021 Feb 19;12:516078. doi: 10.3389/fimmu.2021.516078. eCollection 2021. Front Immunol. 2021. PMID: 33679728 Free PMC article.
-
Extracellular vesicles as potential biomarkers of acute graft-vs-host disease.Leukemia. 2018 Mar;32(3):765-773. doi: 10.1038/leu.2017.277. Epub 2017 Aug 30. Leukemia. 2018. PMID: 28852198
-
Interleukin-6 as Biomarker for Acute GvHD and Survival After Allogeneic Transplant With Post-transplant Cyclophosphamide.Front Immunol. 2019 Oct 1;10:2319. doi: 10.3389/fimmu.2019.02319. eCollection 2019. Front Immunol. 2019. PMID: 31632401 Free PMC article.
-
Haploidentical Transplantation with Post-Transplant Cyclophosphamide versus Unrelated Donor Hematopoietic Stem Cell Transplantation: A Systematic Review and Meta-Analysis.Biol Blood Marrow Transplant. 2019 Dec;25(12):2422-2430. doi: 10.1016/j.bbmt.2019.07.028. Epub 2019 Aug 3. Biol Blood Marrow Transplant. 2019. PMID: 31386903
Cited by
-
Extracellular vesicles: a new frontier in diagnosing and treating graft-versus-host disease after allogeneic hematopoietic cell transplantation.J Nanobiotechnology. 2025 Mar 26;23(1):251. doi: 10.1186/s12951-025-03297-y. J Nanobiotechnology. 2025. PMID: 40133949 Free PMC article. Review.
-
Platelet removal from human blood plasma improves detection of extracellular vesicle-associated miRNA.J Extracell Vesicles. 2023 Feb;12(2):e12302. doi: 10.1002/jev2.12302. J Extracell Vesicles. 2023. PMID: 36788785 Free PMC article.
-
Complex interactions of cellular players in chronic Graft-versus-Host Disease.Front Immunol. 2023 Jun 26;14:1199422. doi: 10.3389/fimmu.2023.1199422. eCollection 2023. Front Immunol. 2023. PMID: 37435079 Free PMC article. Review.
-
CD73-Adenosinergic Axis Mediates the Protective Effect of Extracellular Vesicles Derived from Mesenchymal Stromal Cells on Ischemic Renal Damage in a Rat Model of Donation after Circulatory Death.Int J Mol Sci. 2022 Sep 14;23(18):10681. doi: 10.3390/ijms231810681. Int J Mol Sci. 2022. PMID: 36142593 Free PMC article.
-
The rise of exosome-mediated mechanisms in MSC therapy.J Transl Med. 2025 Jul 14;23(1):793. doi: 10.1186/s12967-025-06747-1. J Transl Med. 2025. PMID: 40660274 Free PMC article.
References
Publication types
MeSH terms
Substances
LinkOut - more resources
Full Text Sources
Research Materials
Miscellaneous

