. 2022 Jan 25:13:761046.
doi: 10.3389/fimmu.2022.761046. eCollection 2022.

Histone Acetylation Regulator-Mediated Acetylation Patterns Define Tumor Malignant Pathways and Tumor Microenvironment in Hepatocellular Carcinoma

Affiliations

Histone Acetylation Regulator-Mediated Acetylation Patterns Define Tumor Malignant Pathways and Tumor Microenvironment in Hepatocellular Carcinoma

Yuyan Xu et al. Front Immunol. .

Abstract

Background: Histone acetylation modification is one of the most common epigenetic methods used to regulate chromatin structure, DNA repair, and gene expression. Existing research has focused on the importance of histone acetylation in regulating tumorigenicity, tumor progression, and tumor microenvironment (TME) but has not explored the potential roles and interactions of histone acetylation regulators in TME cell infiltration, drug sensitivity, and immunotherapy.

Methods: The mRNA expression and genetic alterations of 36 histone acetylation regulators were analyzed in 1599 hepatocellular carcinoma (HCC) samples. The unsupervised clustering method was used to identify the histone acetylation patterns. Then, based on their differentially expressed genes (DEGs), an HAscore model was constructed to quantify the histone acetylation patterns and related subtypes of individual samples. Lastly, the relationship between HAscore and transcription background, tumor clinical features, characteristics of TME, drug response, and efficacy of immunotherapy were analyzed.

Results: We identified three histone acetylation patterns characterized by high, medium, and low HAscore. Patients with HCC in the high HAscore group experienced worse overall survival time, and the cancer-related malignant pathways were more active in the high HAscore group, comparing to the low HAscore group. The high HAscore group was characterized by an immunosuppressive subtype because of the high infiltration of immunosuppressive cells, such as regulatory T cells and myeloid-derived suppressor cells. Following validation, the HAscore was highly correlated with the sensitivity of anti-tumor drugs; 116 therapeutic agents were found to be associated with it. The HAscore was also correlated with the therapeutic efficacy of the PD-L1 and PD-1 blockade, and the response ratio was significantly higher in the low HAscore group.

Conclusion: To the best of our knowledge, our study is the first to provide a comprehensive analysis of 36 histone acetylation regulators in HCC. We found close correlations between histone acetylation patterns and tumor malignant pathways and TME. We also analyzed the therapeutic value of the HAscore in targeted therapy and immunotherapy. This work highlights the interactions and potential clinical utility of histone acetylation regulators in treatment of HCC and improving patient outcomes.

Keywords: drug sensitivity; hepatocellular carcinoma; histone acetylation; immunotherapy; tumor microenvironment.


Conflict of interest statement

The authors declare that the research was conducted in the absence of any commercial or financial relationships that could be construed as a potential conflict of interest.

Figures

Figure 1
Figure 1
The landscape of genetic alterations of histone acetylation regulators in hepatocellular carcinoma (HCC). (A) Summary of the dynamic reversible process of histone acetylation modification mediated by regulators (“writers,” “erasers,” and “readers”) and their biological functions. (B) Functional annotations of 36 regulators analyzed by the Metascape enrichment tool. Cluster annotations are shown in the color code. (C) The mutation frequency of 36 histone acetylation regulators in TCGA-LIHC cohort. Each column represents individual patients. The barplot on top shows TMB, and the numbers on the right display the mutation frequency of each regulator. The barplot on the right shows the proportion of each variation type. The stacked barplot on the bottom displays the fraction of conversions in each sample. (D) The copy number variation (CNV) frequency of histone acetylation regulators in TCGA-LIHC was prevalent. The column represents the alteration frequency. The deletion frequency is a light-green dot; the amplification frequency is a crimson dot. (E) Boxplot shows the expression of the 36 histone acetylation regulators between tumor and normal tissues in the TCGA-LIHC cohort. Tumor: red; Normal: blue. (*P < 0.05, **P < 0.01, ***P < 0.001). (F) Principal component analysis of the 36 histone acetylation regulators to distinguish tumors from normal samples in TCGA-LIHC. Tumor: pale blue; normal: yellow.
Figure 2
Figure 2
Histone acetylation modification pattern and clinical characteristics of each pattern. (A) The interaction among histone acetylation regulators in liver cancer. The circle size describes the effect of each regulator on the prognosis and scale by P value. Favorable factors are shown with a pink semicircle on the right. Risk factors are shown with a blue semicircleon the right. Three histone modification types of the 36 histone acetylation regulators are depicted by different colored semicircle on the left. Readers: Indigo; writers: brown; erasers: gray. The red and blue lines represent positive and negative correlations, respectively (P < 0.0001). (B) Survival analyses of three histone acetylation modification patterns based on 607 patients from the RNA-seq meta cohort (TCGA-LIHC, ICGC-LIRI). (C) Survival analyses of three histone acetylation modification patterns based on 421 patients from the GEO meta cohort (GSE14520, GSE76427, GSE116174). (D) Principal component analysis of the transcriptome profiles between three histone acetylation modification patterns, indicating a prominent difference on the transcriptome between different HAclusters (based on RNA-seq meta cohort). (E) Unsupervised clustering of the 36 histone acetylation modification regulators in the TCGA-LIHC cohort. The HAcluster, viral infection, vascular invasion, TNM stage, histology grade, age, and gender were used as sample annotations. Red represents high expression, and blue represents low expression. Comparison of clinical characteristics proportion analysis between three HAclusters was evaluated by Chi-square test (*P < 0.05, **P < 0.01).
Figure 3
Figure 3
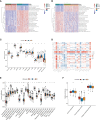
Biological characteristics of histone acetylation patterns. (A, B) GSVA enrichment analysis demonstrates the activation states of KEGG biological pathways between distinct HAclusters in RNA-seq meta cohort and the activated group visualized by heatmap. Yellow and blue represent activated and inhibited pathways, respectively. The HAcluster and project of database were used as sample annotations. (A) HAcluster A vs HAcluster B; (B) HAcluster B vs HAcluster (C) Differences in oncogenic pathways among the three distinct HAclusters. (D) The correlation between the 36 histone acetylation regulators and TME infiltration cells in RNA-seq meta cohort. Positive and negative correlations are marked in red and blue, respectively. (E) Boxplot of abundance of TME-infiltrating cells in three HAclusters, based on the RNA-seq meta cohort. (F) Differences in immune-related functional pathways among the three distinct HAclusters. The statistical differences among the three HAclusters were tested by the Kruskal–Wallis test. (*P < 0.05; **P < 0.01; ***P < 0.001; ns, non-significant).
Figure 4
Figure 4
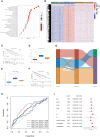
Construction of the characteristic signature of histone acetylation patterns and its prognostic significance. (A) GO enrichment analysis for histone acetylation pattern related genes with prognostic significance. The x-axis indicates the gene ratio within each GO term. (B) Unsupervised clustering of 591 histone-acetylation-related genes in RNA-seq meta cohort. The HAcluster, geneCluster, and cohorts were used as sample annotations. (C) The survival curves of different geneClusters in the RNA-seq meta cohorts (TCGA-LIHC and ICGC-LIRI) were estimated by the Kaplan–Meier plotter (p = 1.62e-05, Log-rank test). (D) Differences in the HAscores of the HAclusters in the RNA-seq meta cohorts. (E) Differences in the HAscores of the geneClusters in the RNA-seq meta cohorts. The statistical differences were tested by the Kruskal–Wallis test. (****P < 0.0001). (F) Survival analyses for low and high HAscore groups in the RNA-seq meta cohort (TCGA-LIHC and ICGC-LIRI) using Kaplan–Meier curves (P = 4.28e-07, Log-rank test). (G) Alluvial diagram demonstrating the changes in the HAcluster, geneCluster, and HAscore groups. (H) The predictive value of HAscore in patients from the TCGA-LIHC and ICGC-LIRI RNA-seq meta cohorts (AUC: 0.708, 0.612, 0.624 and 0.573 for 1, 2, 3, 5- year overall survival). (I) Multivariate Cox regression model analysis of the factors including HAscore, patient age, gender, TNM status, histology grade, vascular invasion, and viral hepatitis serologies in the TCGA-LIHC cohort.
Figure 5
Figure 5
Clinical features, molecular characteristics, and TME infiltrating cells of the distinct HAscore groups. (A) Difference in HAscore among distinct clinical features related subgroups in the GSE14520 cohort. The Wilcoxon test was used to test the statistical differences among clinical features related subgroups. (B) Clinical features for the high and low HAscore groups in TCGA-LIHC cohort. Chi-squared test or Fisher test was used to test the statistical differences. (C) Correlations between the HAscore and the known gene signatures in RNA-seq meta cohort using Spearman analysis. Positive correlation is marked with red and negative correlation with blue. The asterisks represent the statistical P value (*P < 0.05). (D) Correlations between HAscore and TME infiltrating cell abundance in RNA-seq meta cohort using Spearman analysis. The circle size and x-coordinates describe the correlation coefficient. The color of the circle is scaled by P value. (E) Boxplot of each TME infiltrating cell abundance for high and low HAscore groups in the RNA-seq meta cohort. The statistical differences among the HAscore groups were tested by the Kruskal–Wallis test. (*P < 0.05; **P < 0.01; ***P < 0.001; ns, non-significant).
Figure 6
Figure 6
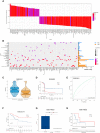
The relationship between HAscore and drug sensitivity. (A) The Spearman analysis was used to evaluate the correlation between HAscore and AUC of drug-sensitive curve. The brightness of column indicates the significance of the correlation. The height indicates the values of Rs. (B) Signaling pathways targeted by drugs that were closely correlated with HAscore. The horizontal axis shows the drug names, and the vertical axis shows the signaling pathway targeted by the drugs. The bar graph on the right displays the number of drugs in each signaling pathway. The significance of the correlation is shown by the size of the point. (C, G) The difference of HAscores between distinct clinical outcomes of related anti-tumor drugs, including cetuximab (C) and ricolinostat (G). (D, F, H) Kaplan–Meier curves show the overall survival time in high HAscore or low HAscore group after the treatment of related anti-tumor drugs, including cetuximab (D), a cyclophosphamide, methotrexate, and 5-fluorouracil regimen (F), and ricolinostat (H). (E) The predictive value of the HAscore to the sensitivity of cetuximab (AUC = 0.691).
Figure 7
Figure 7
The relationship between HAscore and immunotherapy. (A, B) The TIDE scores of individual HCC samples in the high HAscore or the low HAscore groups. (A) shows the result from the RNA-seq meta cohort and (B) shows the result from the GEO meta cohort. (C, G) Kaplan–Meier curves show the overall survival time in the high HAscore or the low HAscore groups after the treatment of PD-L1 pathway blockgade immunotherapy (C) or PD-1 pathway blockade immunotherapy (G). (D, H) The proportion of patients with different responses to PD-L1 blockage (D) or PD-1 blockage (H). (E, F) the differences of neoantigen burden (E) or mutation burden (F) in the high HAscore or the low HAscore group.

References

    1. Sung H, Ferlay J, Siegel RL, Laversanne M, Soerjomataram I, Jemal A, et al. . Global Cancer Statistics 2020: GLOBOCAN Estimates of Incidence and Mortality Worldwide for 36 Cancers in 185 Countries. CA: Cancer J Clin (2021) 71:209–49. doi: 10.3322/caac.21660 - DOI - PubMed
    1. Petrowsky H, Fritsch R, Guckenberger M, De Oliveira ML, Dutkowski P, Clavien PA. Modern Therapeutic Approaches for the Treatment of Malignant Liver Tumours. Nat Rev Gastroenterol Hepatol (2020) 17:755–72. doi: 10.1038/s41575-020-0314-8 - DOI - PubMed
    1. Villanueva A. Hepatocellular Carcinoma. N Engl J Med (2019) 380:1450–62. doi: 10.1056/NEJMra1713263 - DOI - PubMed
    1. Zeng H, Chen W, Zheng R, Zhang S, Ji JS, Zou X, et al. . Changing Cancer Survival in China During 2003-15: A Pooled Analysis of 17 Population-Based Cancer Registries. Lancet Glob Health (2018) 6:e555–67. doi: 10.1016/S2214-109X(18)30127-X - DOI - PubMed
    1. Craig AJ, von Felden J, Garcia-Lezana T, Sarcognato S, Villanueva A. Tumour Evolution in Hepatocellular Carcinoma. Nat Rev Gastroenterol Hepatol (2020) 17:139–52. doi: 10.1038/s41575-019-0229-4 - DOI - PubMed

Publication types