

Systems Biology Modeling of the Complement System Under Immune Susceptible Pathogens
- PMID: 35145963
- PMCID: PMC8827490
- DOI: 10.3389/fphy.2021.603704
Systems Biology Modeling of the Complement System Under Immune Susceptible Pathogens
Abstract
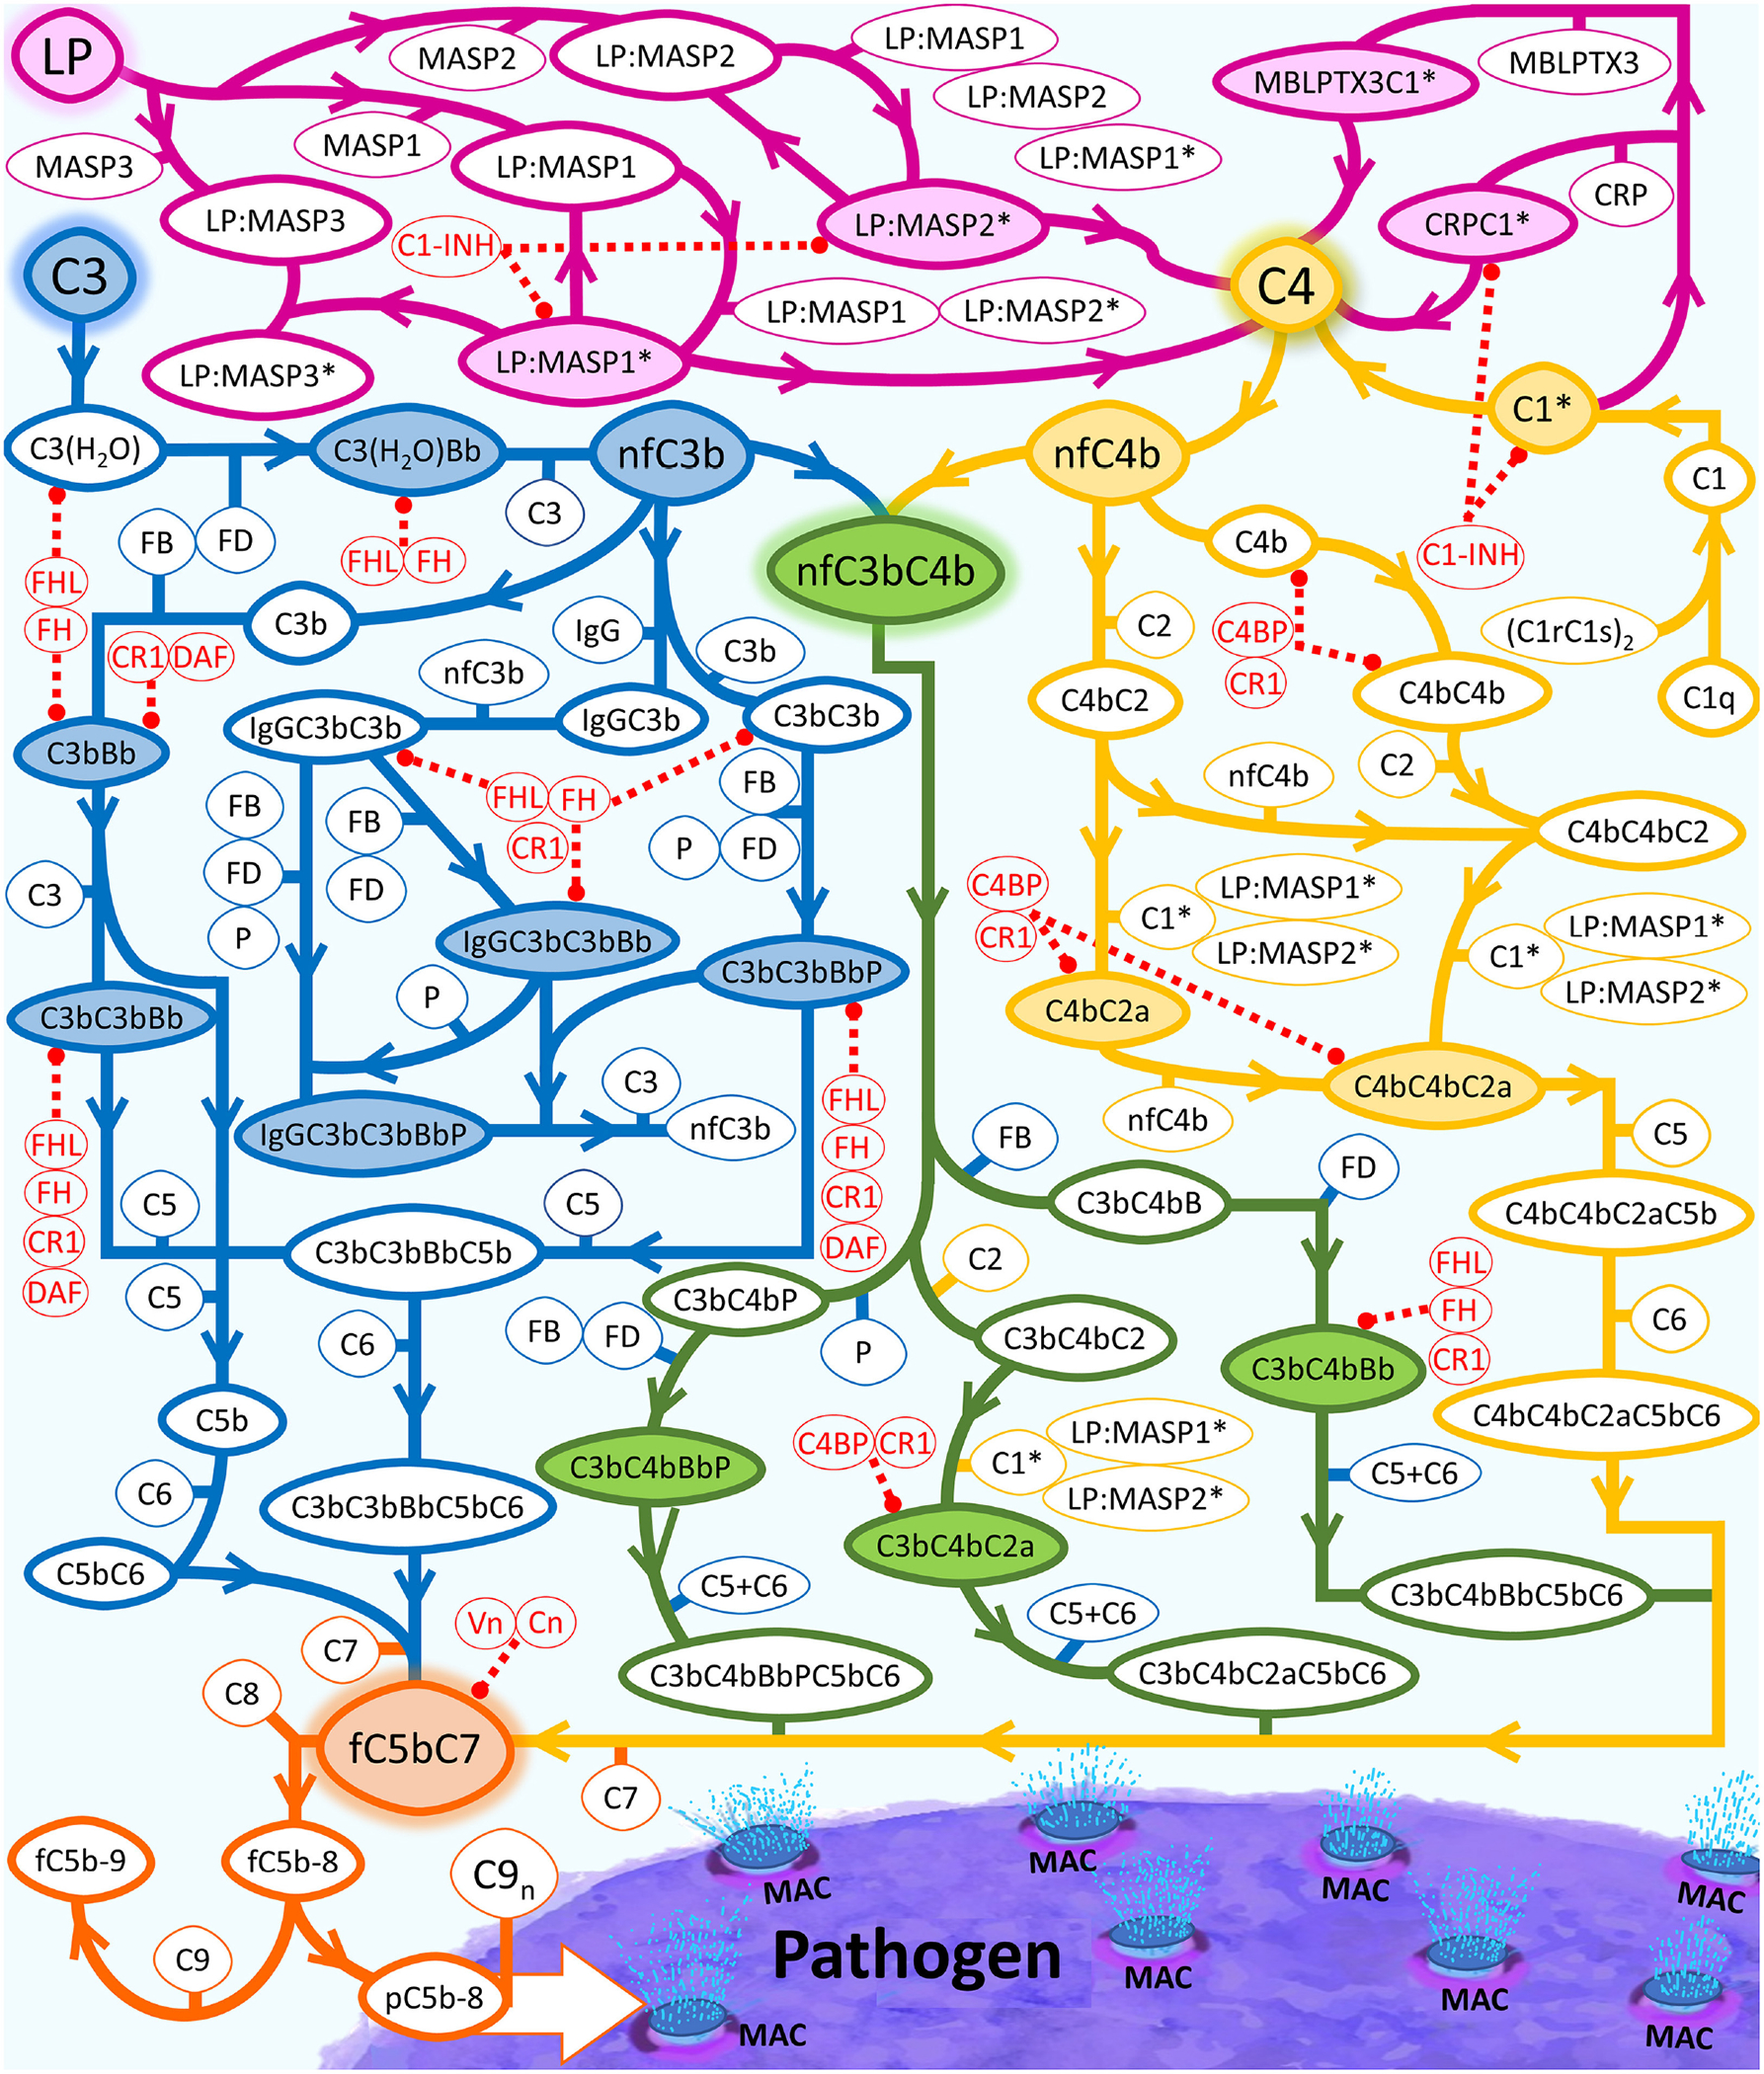
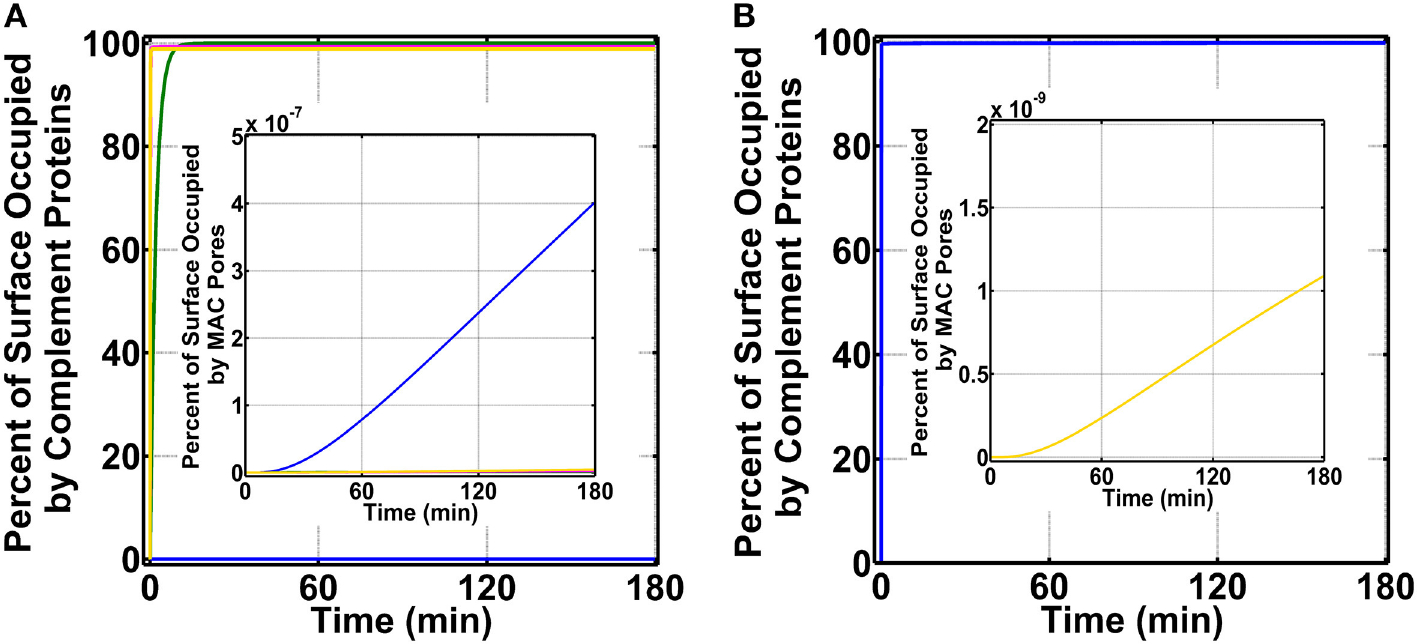
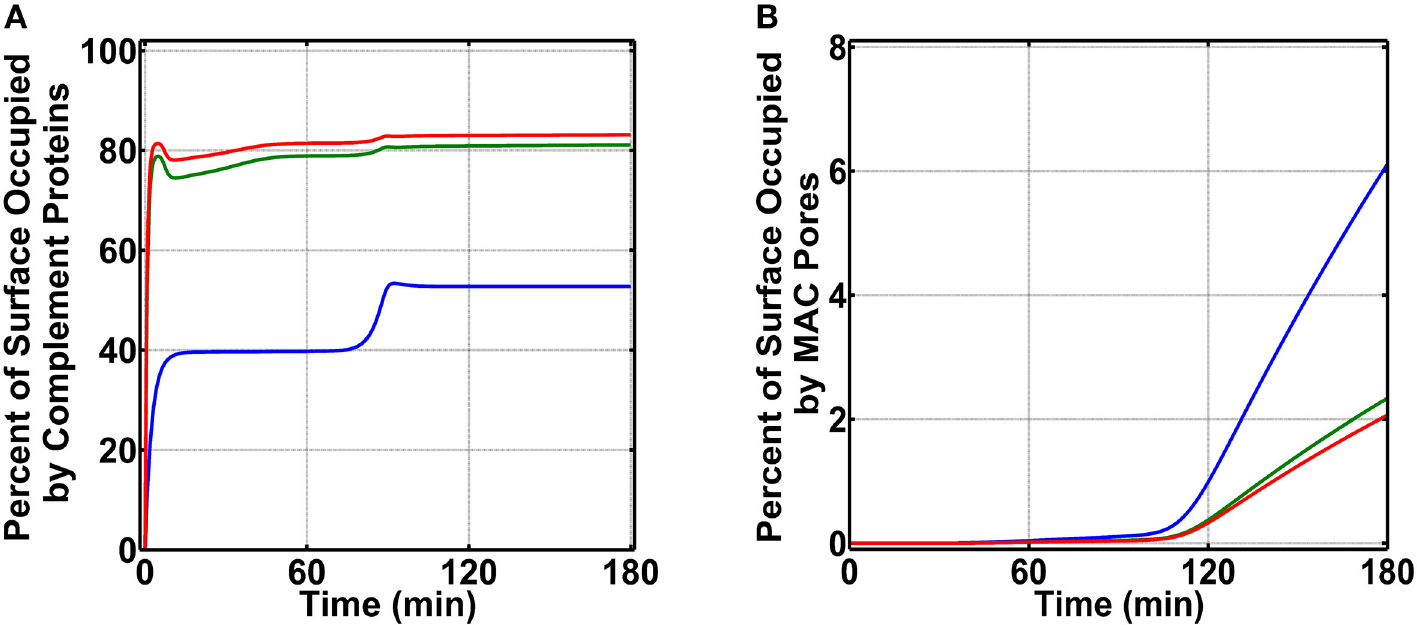
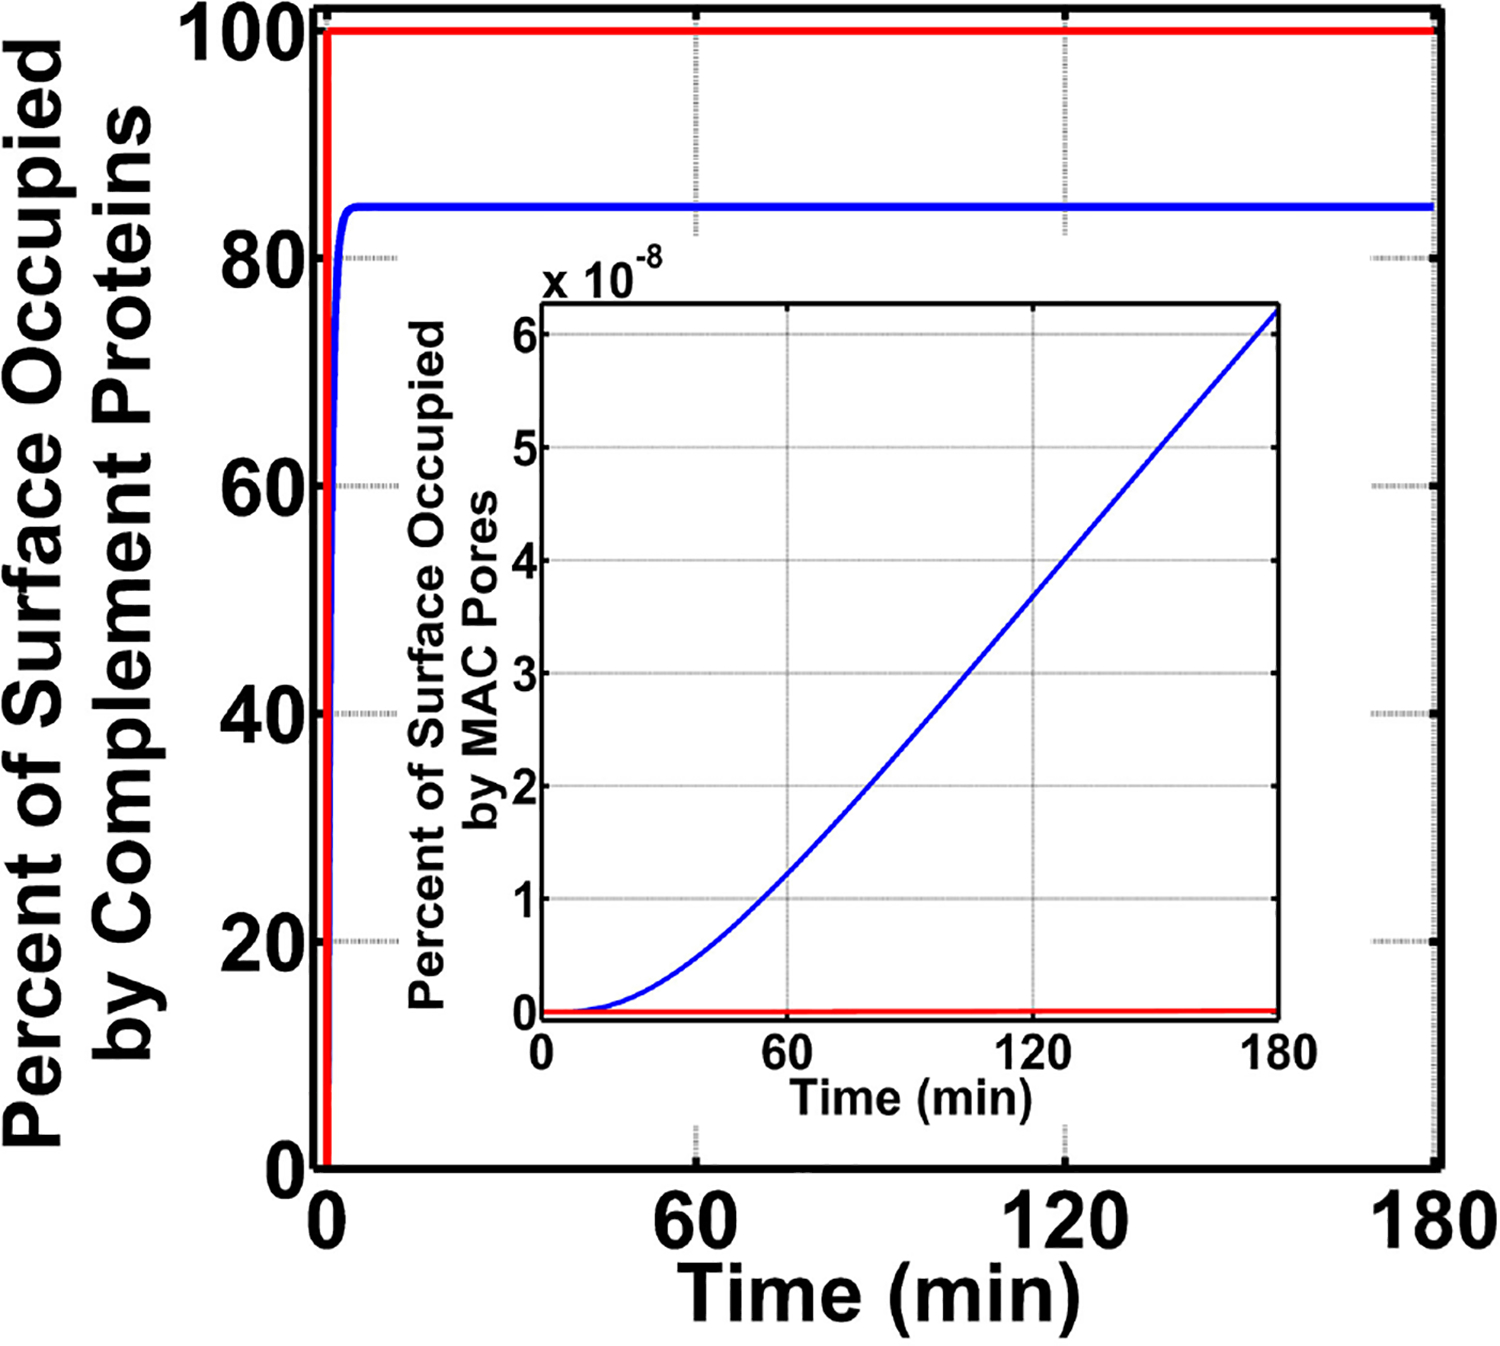
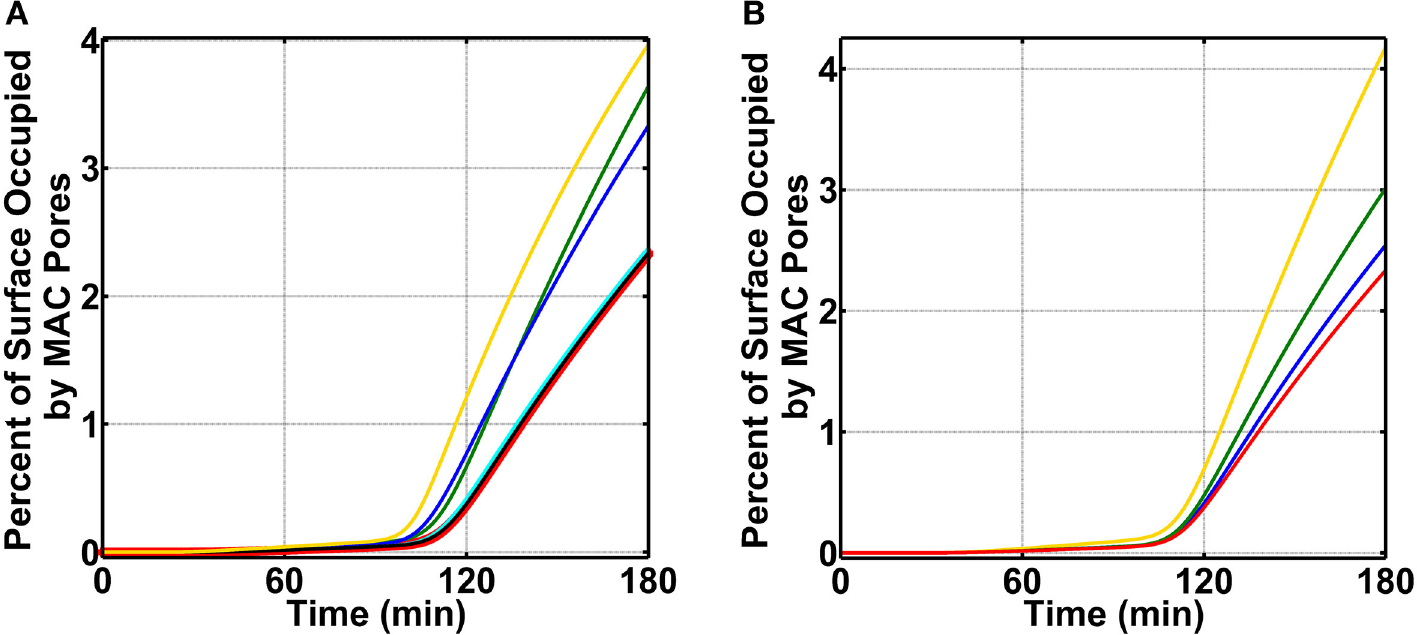
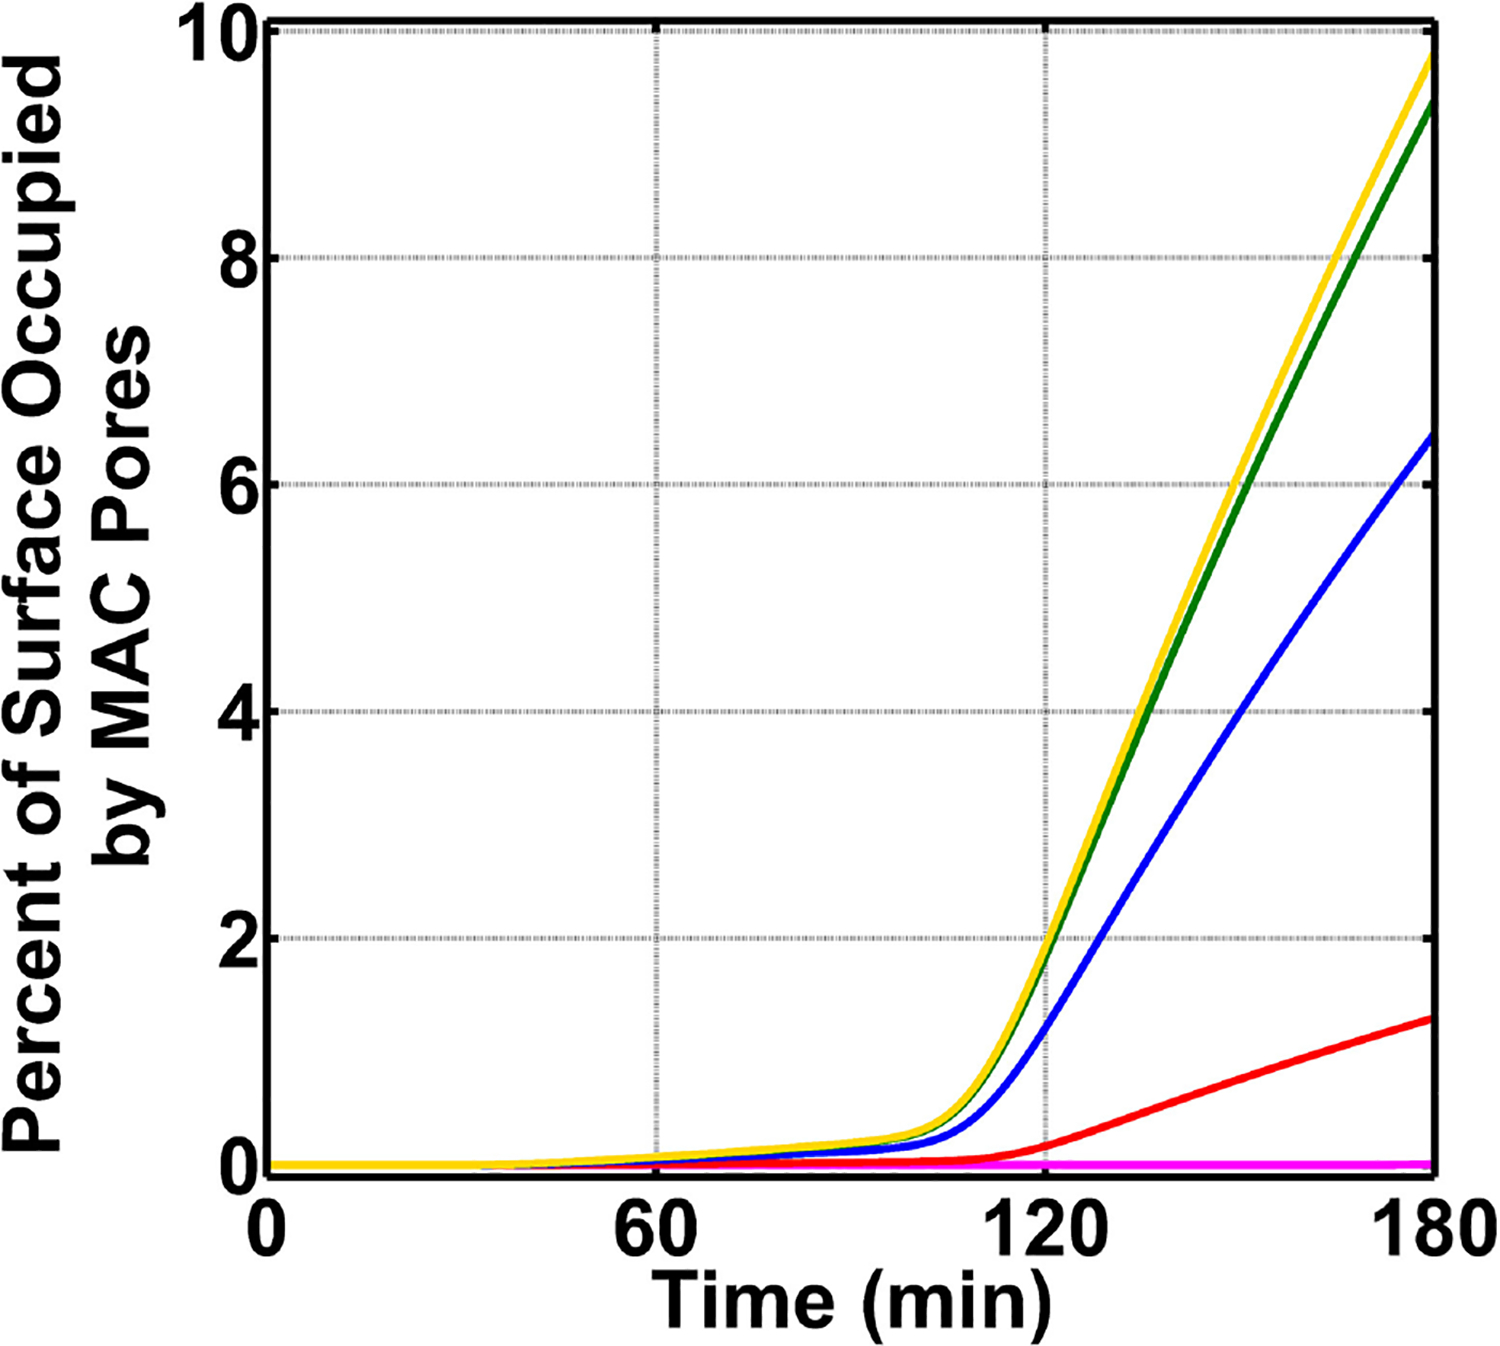
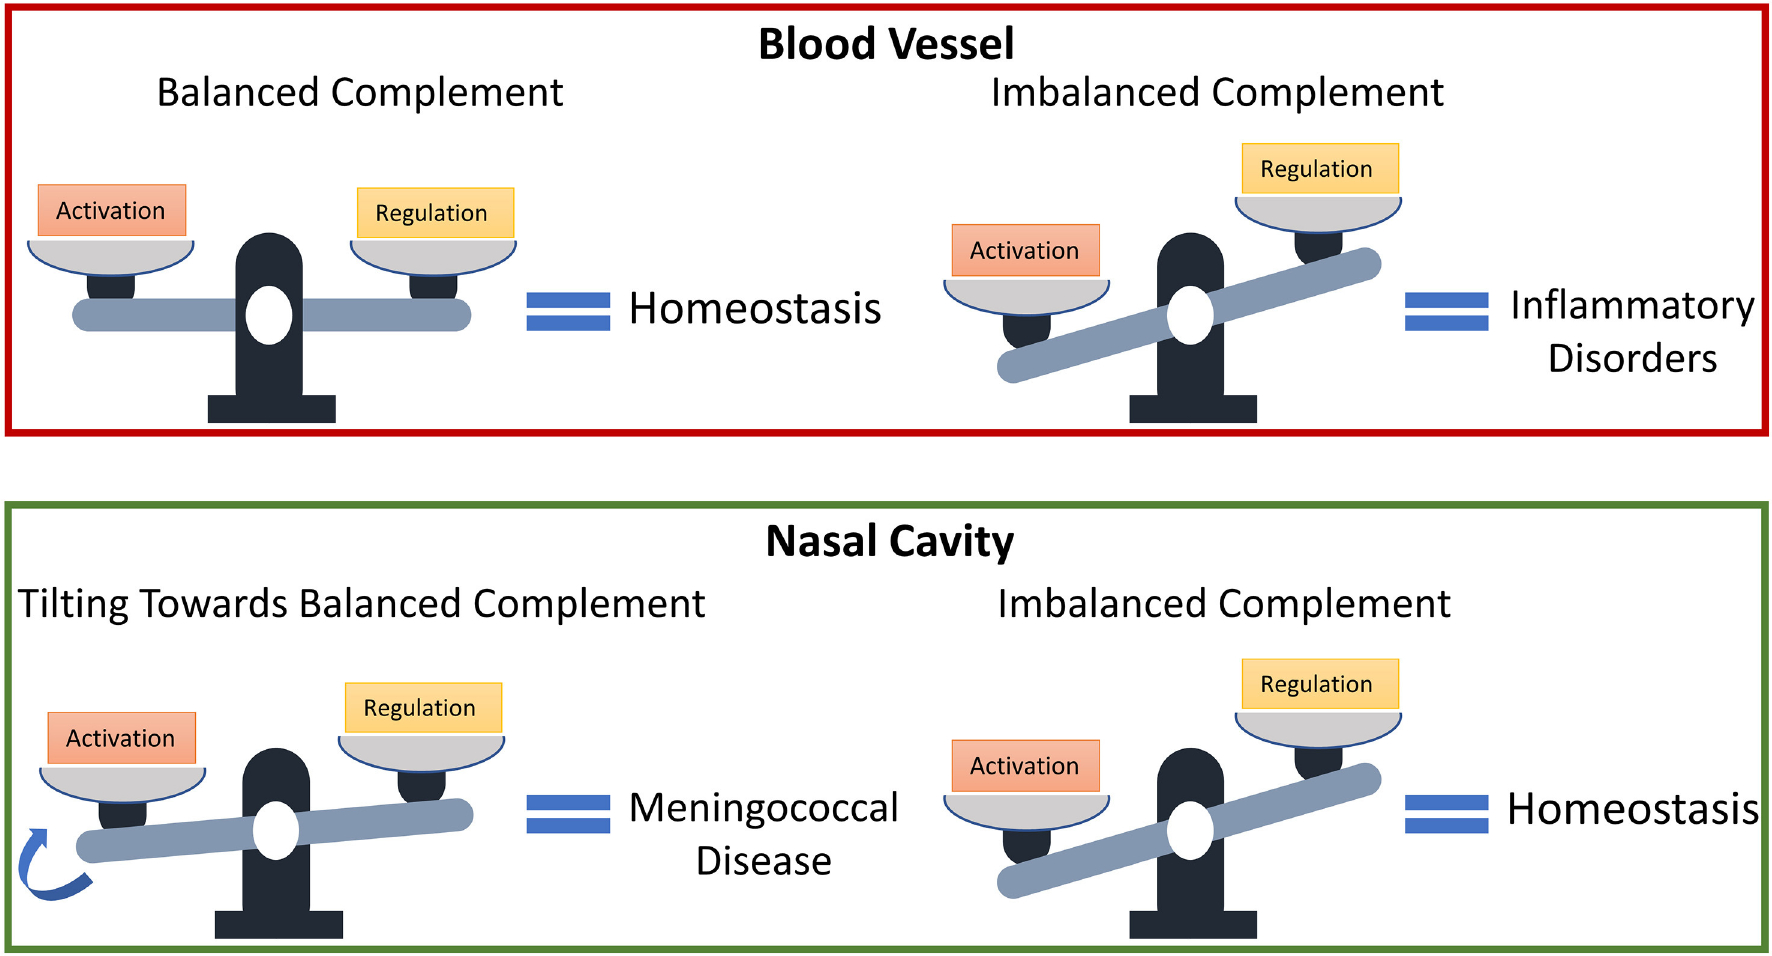
The complement system is assembled from a network of proteins that function to bring about the first line of defense of the body against invading pathogens. However, complement deficiencies or invasive pathogens can hijack complement to subsequently increase susceptibility of the body to infections. Moreover, invasive pathogens are increasingly becoming resistant to the currently available therapies. Hence, it is important to gain insights into the highly dynamic interaction between complement and invading microbes in the frontlines of immunity. Here, we developed a mathematical model of the complement system composed of 670 ordinary differential equations with 328 kinetic parameters, which describes all three complement pathways (alternative, classical, and lectin) and includes description of mannose-binding lectin, collectins, ficolins, factor H-related proteins, immunoglobulin M, and pentraxins. Additionally, we incorporate two pathogens: (type 1) complement susceptible pathogen and (type 2) Neisseria meningitidis located in either nasopharynx or bloodstream. In both cases, we generate time profiles of the pathogen surface occupied by complement components and the membrane attack complex (MAC). Our model shows both pathogen types in bloodstream are saturated by complement proteins, whereas MACs occupy <<1.0% of the pathogen surface. Conversely, the MAC production in nasopharynx occupies about 1.5-10% of the total N. meningitidis surface, thus making nasal MAC levels at least about eight orders of magnitude higher. Altogether, we predict complement-imbalance, favoring overactivation, is associated with nasopharynx homeostasis. Conversely, orientating toward complement-balance may cause disruption to the nasopharynx homeostasis. Thus, for sporadic meningococcal disease, our model predicts rising nasal levels of complement regulators as early infection biomarkers.
Keywords: Neisseria meningitidis; complement system; computational systems biology; predictive modeling; predictive network biology; protein network.
Conflict of interest statement
Conflict of Interest: The authors declare that the research was conducted in the absence of any commercial or financial relationships that could be construed as a potential conflict of interest.
Figures
Similar articles
-
Complement-pentraxins synergy: Navigating the immune battlefield and beyond.Biomed Pharmacother. 2023 Dec 31;169:115878. doi: 10.1016/j.biopha.2023.115878. Epub 2023 Nov 11. Biomed Pharmacother. 2023. PMID: 37952357 Review.
-
Complement C5a Receptor 1 Exacerbates the Pathophysiology of N. meningitidis Sepsis and Is a Potential Target for Disease Treatment.mBio. 2018 Jan 23;9(1):e01755-17. doi: 10.1128/mBio.01755-17. mBio. 2018. PMID: 29362231 Free PMC article.
-
The emerging role of complement lectin pathway in trypanosomatids: molecular bases in activation, genetic deficiencies, susceptibility to infection, and complement system-based therapeutics.ScientificWorldJournal. 2013;2013:675898. doi: 10.1155/2013/675898. Epub 2013 Feb 21. ScientificWorldJournal. 2013. PMID: 23533355 Free PMC article. Review.
-
Common Genetic Variants in the Complement System and their Potential Link with Disease Susceptibility and Outcome of Invasive Bacterial Infection.J Innate Immun. 2020;12(2):131-141. doi: 10.1159/000500545. Epub 2019 Jul 3. J Innate Immun. 2020. PMID: 31269507 Free PMC article. Review.
-
Complement interactions with the pathogenic Neisseriae: clinical features, deficiency states, and evasion mechanisms.FEBS Lett. 2020 Aug;594(16):2670-2694. doi: 10.1002/1873-3468.13760. Epub 2020 Mar 3. FEBS Lett. 2020. PMID: 32058583 Review.
Cited by
-
Mathematical Modeling of Complement Pathway Dynamics for Target Validation and Selection of Drug Modalities for Complement Therapies.Front Pharmacol. 2022 Apr 19;13:855743. doi: 10.3389/fphar.2022.855743. eCollection 2022. Front Pharmacol. 2022. PMID: 35517827 Free PMC article.
-
Modelling and analysis of the complement system signalling pathways: roles of C3, C5a and pro-inflammatory cytokines in SARS-CoV-2 infection.PeerJ. 2023 Sep 20;11:e15794. doi: 10.7717/peerj.15794. eCollection 2023. PeerJ. 2023. PMID: 37744234 Free PMC article.
-
Unravelling the impact of SARS-CoV-2 on hemostatic and complement systems: a systems immunology perspective.Front Immunol. 2025 Jan 13;15:1457324. doi: 10.3389/fimmu.2024.1457324. eCollection 2024. Front Immunol. 2025. PMID: 39885991 Free PMC article.
-
Complement system in Anti-CD20 mAb therapy for cancer: A mini-review.Int J Immunopathol Pharmacol. 2023 Jan-Dec;37:3946320231181464. doi: 10.1177/03946320231181464. Int J Immunopathol Pharmacol. 2023. PMID: 37357623 Free PMC article. Review.
-
The Factor H protein family: The switchers of the complement alternative pathway.Immunol Rev. 2023 Jan;313(1):25-45. doi: 10.1111/imr.13166. Epub 2022 Nov 16. Immunol Rev. 2023. PMID: 36382387 Free PMC article. Review.
References
-
- Nicod LP. Lung defences: an overview. Eur Respir Rev. (2005) 14:45–50. doi: 10.1183/09059180.05.00009501 - DOI
Grants and funding
LinkOut - more resources
Full Text Sources
Miscellaneous