. 2022 Jan 15;25(2):103778.
doi: 10.1016/j.isci.2022.103778. eCollection 2022 Feb 18.

Hybridization underlies localized trait evolution in cavefish

Affiliations

Hybridization underlies localized trait evolution in cavefish

Rachel L Moran et al. iScience. .

Abstract

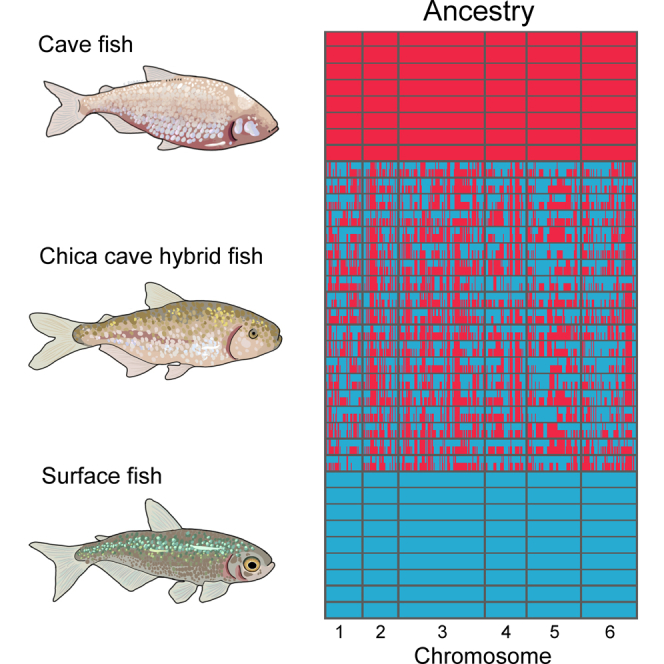
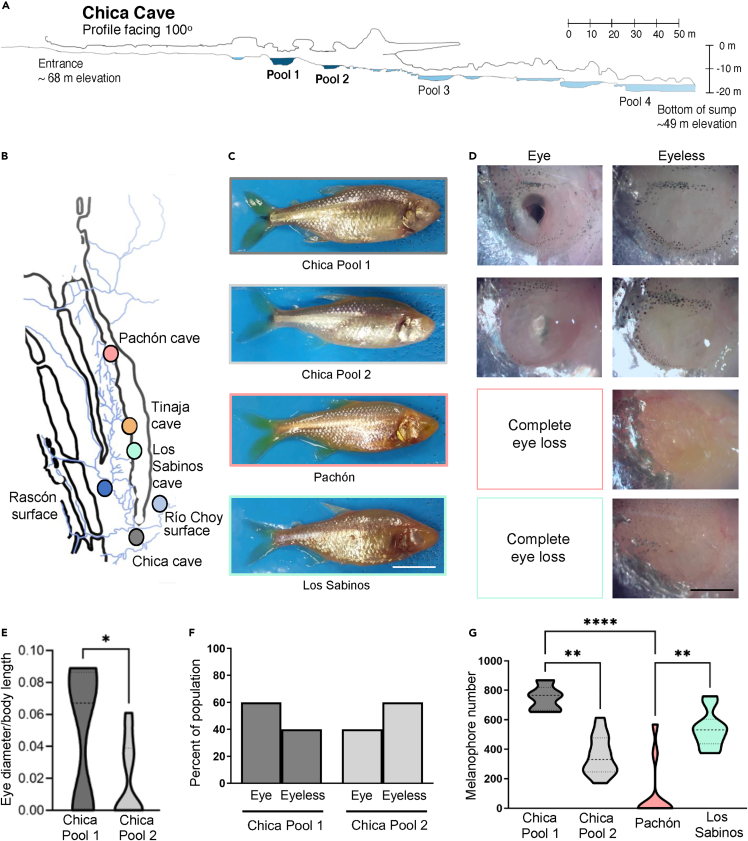
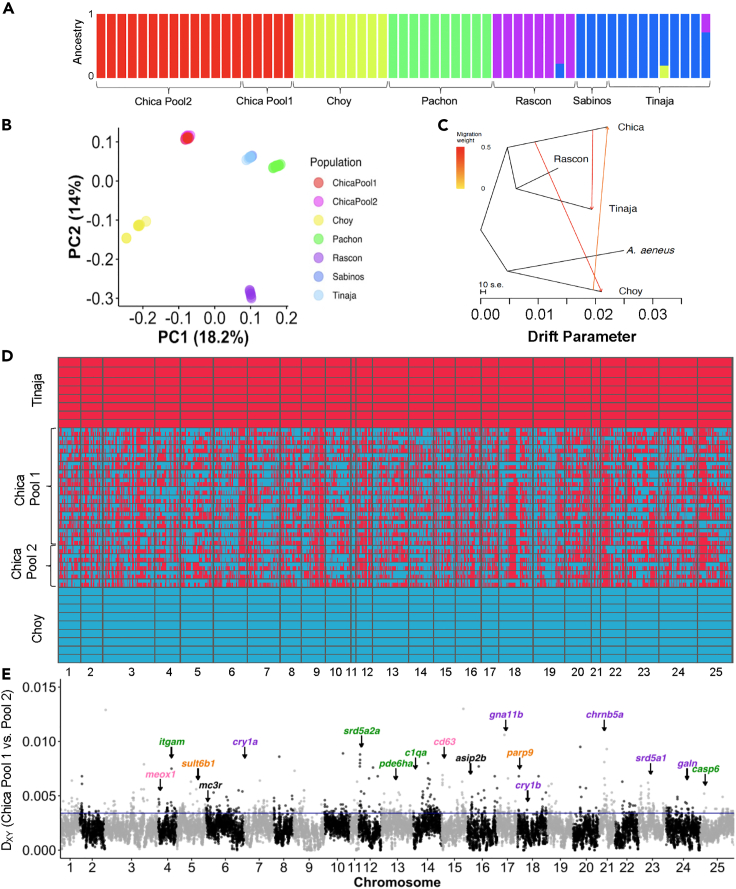
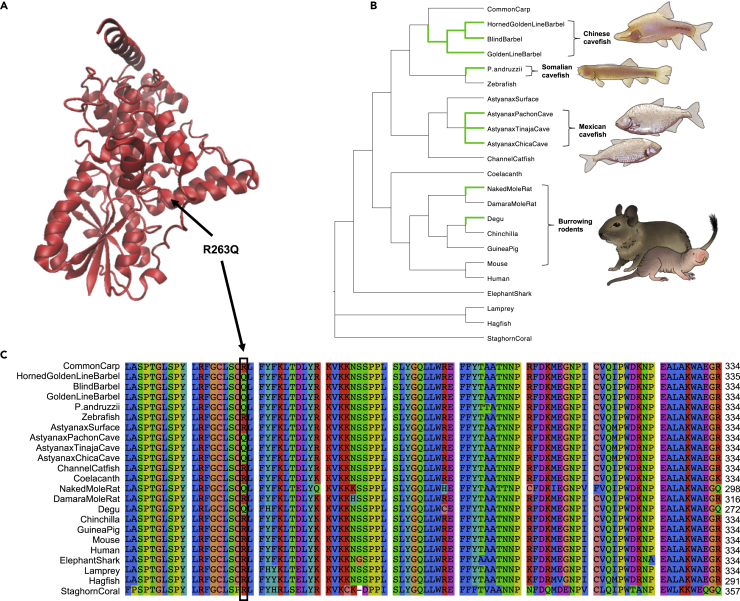
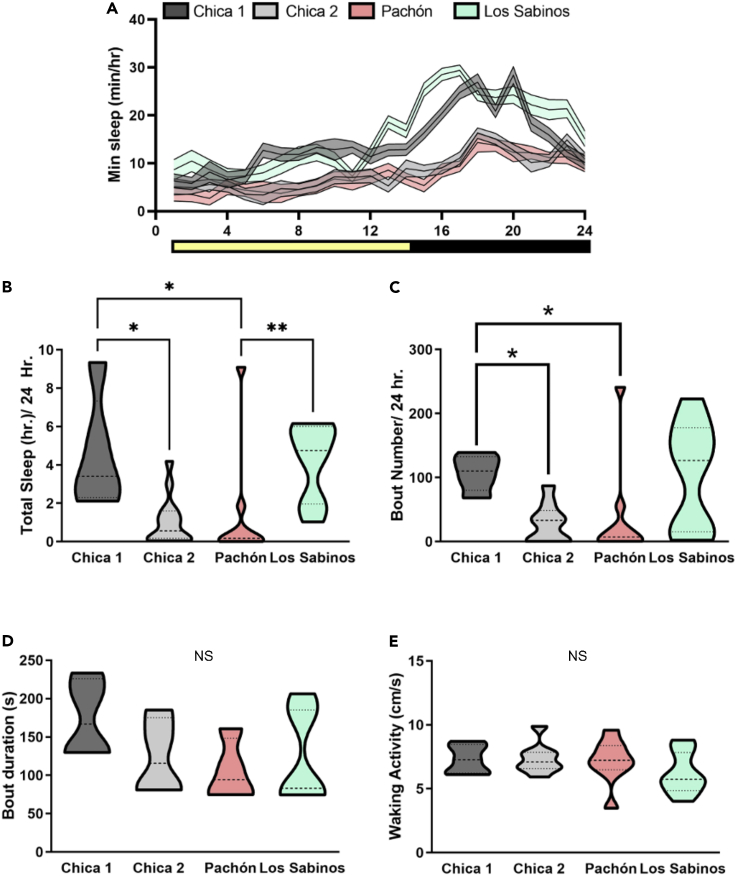
Introgressive hybridization may play an integral role in local adaptation and speciation (Taylor and Larson, 2019). In the Mexican tetra Astyanax mexicanus, cave populations have repeatedly evolved traits including eye loss, sleep loss, and albinism. Of the 30 caves inhabited by A. mexicanus, Chica cave is unique because it contains multiple pools inhabited by putative hybrids between surface and cave populations (Mitchell et al., 1977), providing an opportunity to investigate the impact of hybridization on complex trait evolution. We show that hybridization between cave and surface populations may contribute to localized variation in traits associated with cave evolution, including pigmentation, eye development, and sleep. We also uncover an example of convergent evolution in a circadian clock gene in multiple cavefish lineages and burrowing mammals, suggesting a shared genetic mechanism underlying circadian disruption in subterranean vertebrates. Our results provide insight into the role of hybridization in facilitating phenotypic evolution.

Keywords: Aquatic biology; Aquatic science; Evolutionary biology.


Conflict of interest statement

The authors declare no competing interests.

Figures

None
Graphical abstract
Figure 1
Figure 1
Collection locations and variation in morphological traits within and between cave populations (A) Map of Chica cave, modified with permission from (Elliott, 2015). Pool one and Pool two are colored dark blue. (B) Collection locations for cave and surface populations. For the two surface populations, the collection location for Río Choy is represented by a light blue circle and the collection location for Rascón is represented by a dark blue circle. (C) Representative images of wild-caught fish. Scale bar denotes 1 cm. (D) Representative images of eye morphology variations in Chica Pools one and two and complete eye loss in wild-caught Pachón and Los Sabinos cave populations. There are no eyed fish present in Pachón and Los Sabinos populations. (E) Eye diameter is reduced in Chica pool two fish compared to pool 1 (p < 0.05∗, Unpaired t-test, t = 1.88, df = 17). Eye size was corrected to body length. (F) Eye morphology in Chica fish. Chica Pool 1: observed 60% eye (n = 9), 40% no eye (n = 6). Chica Pool 2: observed 40% eye (n = 2), 60% no eye (n = 3). (G) Pigment quantification from combined melanophore counts on standard anatomical markers following (Stahl et al., 2018) (i.e., caudal fin area, adipose fin area, dorsal area, eye cup area, anal fin area, infra-orbital area; see Figure S1) corrected for body length. Differences in melanin pigmentation are present among different populations (p < 0.001, KW statistic = 23.53, Kruskal–Wallis test with Dunn′s multiple comparison test: Chica 1 vs. Chica 2, p < 0.01∗∗; Chica 1 vs. Pachón, p < 0.001∗∗∗∗; Pachón vs. Los Sabinos, p < 0.01∗∗). NS: Not significant. See also Figures S1 and S4.
Figure 2
Figure 2
Genetic relationship between cave and surface populations, hybrid ancestry within Chica cave, and genetic divergence between Chica Pool one and Pool 2. (A) ADMIXTURE barplot showing ancestry proportions for K = 5. (B) Biplot of scores for the first two PCs from PCA on 678,637 SNPs. Note that individuals from Chica cave Pool one and Pool two overlap, and individuals from Tinaja cave and Los Sabinos cave overlap. (C) TreeMix tree with three migration events and rooted with the outgroup, A. aeneus. New lineage surface population (Río Choy) groups with A. aeneus, and old lineage surface (Rascón) and caves (Chica and Tinaja) all group together. Migration events are present between Chica cave and the geographically close surface population, Río Choy, and between Tinaja and Chica caves. Note arrow does not necessarily denote the directionality of migration events. (D) Local ancestry derived from surface (Río Choy, blue) versus cave (Tinaja, red) parental populations in hybrid fish from Chica cave. Each row represents a diploid individual with two haplotypes stacked on top of one another. (E) Absolute genetic divergence (Dxy) between fish from Chica cave Pool one versus Pool two in 50 kb windows across the genome. Of the windows with exceptionally high genetic divergence between pools (Dxy values >95th percentile), 50.96% (371 out of 728) contained a higher proportion of sites derived from the parental cave lineage (i.e., Tinaja) in Pool 2, whereas 39.56% (288 out of 728) had a higher proportion of sites derived from the parental cave lineage in Pool 1. Locations are indicated for several top candidate genes with high divergence between Chica pools and biological functions related to sleep and circadian cycle (purple), eye morphology and function (green), metabolism (orange), and pigmentation (pink), or that are pleiotropically involved in two or more of these pathways (black) (see Table S4). The 95th percentile (Dxy = 0.0034) is delimited by a horizontal line. See also Tables S1–S3 and S4 and Figures S2 and S3.
Figure 3
Figure 3
Convergent evolution in CRY1A across cavefish and other subterranean vertebrates (A) Model of Astyanax mexicanus Pachón cavefish CRY1A protein based on the crystal structure of mouse CRY1 (PDB: 6kx7). The model for the A. mexicanus Pachón cavefish protein was generated with SWISS-MODEL and the comic structure was visualized with VMD (version 1.9.4). The location of R263Q (in the α10 within the FAD-binding pocket) is indicated with an arrow. This image was made with VMD/NAMD/BioCoRE/JMV/other software support. VMD/NAMD/BioCoRE/JMV/ is developed with NIH support by the Theoretical and Computational Biophysics group at the Beckman Institute, University of Illinois at Urbana-Champaign. (B) Species tree for 23 animal species, selected to include subterranean lineages and their epigean relatives (based on the species tree available from Ensembl release 102 and (Colli et al., 2009; Patterson and Upham, 2014; Yang et al., 2016)). Branches where the R263Q mutation has evolved are highlighted in green. Illustrations depict S. anshuiensis (Chinese cavefish), P. andruzzii (Somalian cavefish), A. mexicanus (Mexican cavefish; Pachón cavefish top, Tinaja cavefish bottom), O. degus (degu), and H. glaber (naked mole-rat). (C) Section of multiple sequence alignment for CRY1 orthologs spanning sites 187–289 in the A. mexicanus CRY1A protein. The arginine to glutamine mutation at Astyanax site 263 is indicated with a black outline.
Figure 4
Figure 4
Sleep variation between and within wild-caught A. mexicanus cave populations (A) Twenty-four hour sleep profiles in Chica Pool 1, Chica Pool 2, Pachón, and Los Sabinos fish. (B) Total sleep duration is variable among different populations of wild-caught fish (Kruskal–Wallis test, p < 0.001∗∗, KW statistic = 17.55). Chica Pool two fish sleep significantly less than Chica Pool one fish (Dunn′s multiple comparison, p < 0.05∗). Wild-caught Pachón cavefish sleep significantly less than Chica Pool 1 (Dunn′s multiple comparison, p < 0.05∗). (C) Number of sleep bouts is variable in different cave populations (Kruskal–Wallis test, p < 0.05, KW statistic = 10.62. Chica Pool two and Pachón fish have reduced sleep bout numbers compared to Chica Pool 1 (Dunn′s multiple comparison, Chica Pool 2, p < 0.05∗, Pachón, p < 0.05∗). (D) Sleep bout duration is not significantly altered in any population of cavefish (Kruskal–Wallis test, p > 0.34, KW statistic = 3.46). (E) Waking activity is not altered among cave populations (Kruskal–Wallis test, p > 0.3, KW statistic = 3.65). NS: Not significant.

References

    1. Alexander D.H., Novembre J., Lange K. Fast model-based estimation of ancestry in unrelated individuals. Genome Res. 2009;19:1655–1664. doi: 10.1101/gr.094052.109. - DOI - PMC - PubMed
    1. Aspiras A.C., Rohner N., Martineau B., Borowsky R.L., Tabin C.J. Melanocortin 4 receptor mutations contribute to the adaptation of cavefish to nutrient-poor conditions. Proc. Natl. Acad. Sci. U.S.A. 2015;112:9668–9673. doi: 10.1073/pnas.1510802112. - DOI - PMC - PubMed
    1. Van der Auwera G.A., Carneiro M.O., Hartl C., Poplin R., Del Angel G., Levy-Moonshine A., Jordan T., Shakir K., Roazen D., Thibault J., et al. From FastQ data to high confidence variant calls: the Genome Analysis Toolkit best practices pipeline. Curr. Protoc. Bioinformatics. 2013;43:11.10.1–11.10.33. - PMC - PubMed
    1. Avise J.C., Selander R.K. Evolutionary genetics of cave-dwelling fishes of the genus astyanax. Evolution. 1972;26:1–19. - PubMed
    1. Beale A., Guibal C., Tamai T.K., Klotz L., Cowen S., Peyric E., Reynoso V.H., Yamamoto Y., Whitmore D. Circadian rhythms in Mexican blind cavefish Astyanax mexicanus in the lab and in the field. Nat. Commun. 2013;4:2769. doi: 10.1038/ncomms3769. - DOI - PubMed

LinkOut - more resources