. 2022 Mar 15;11(3):bio058893.
doi: 10.1242/bio.058893. Epub 2022 Mar 8.

Effect of heterogeneous substrate adhesivity of follower cells on speed and tension profile of leader cells in primary keratocyte collective cell migration

Affiliations

Effect of heterogeneous substrate adhesivity of follower cells on speed and tension profile of leader cells in primary keratocyte collective cell migration

Madhura Chakraborty et al. Biol Open. .

Abstract

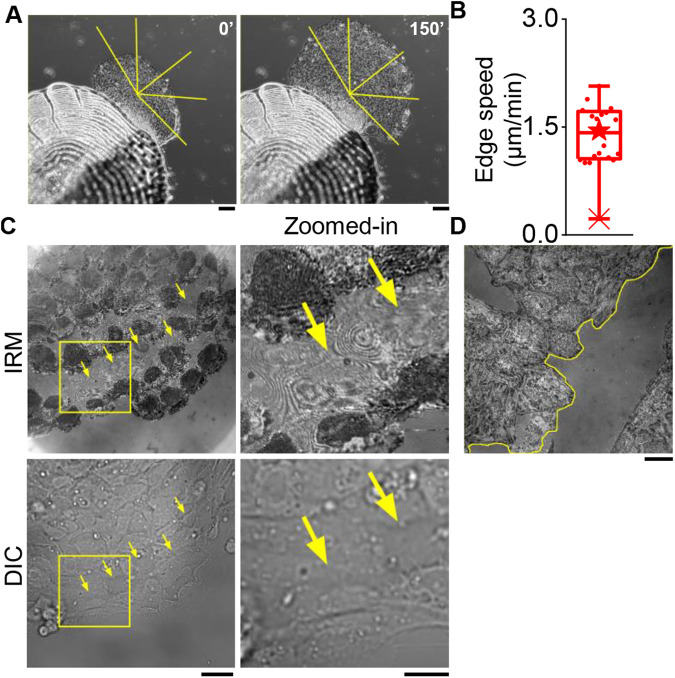
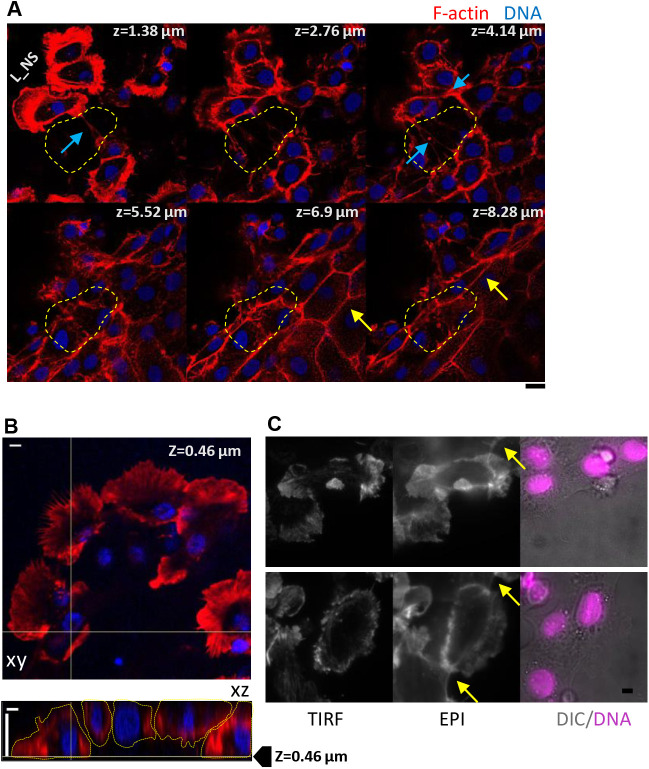
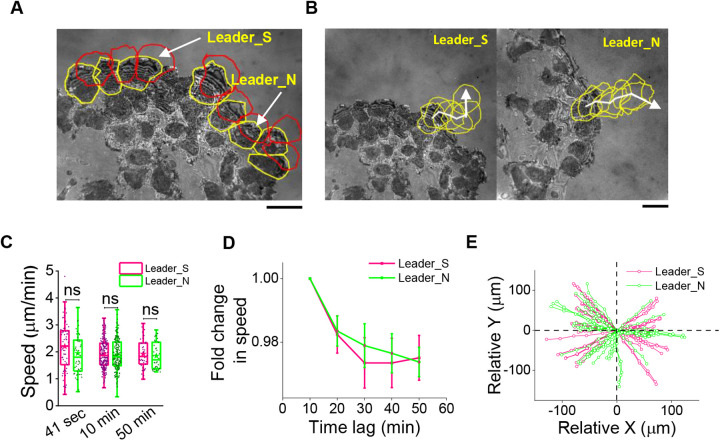
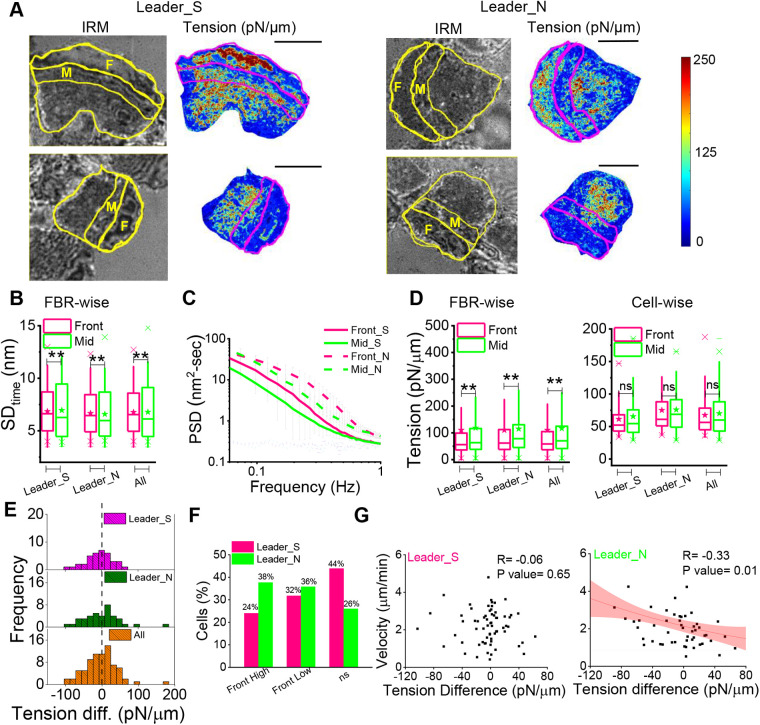
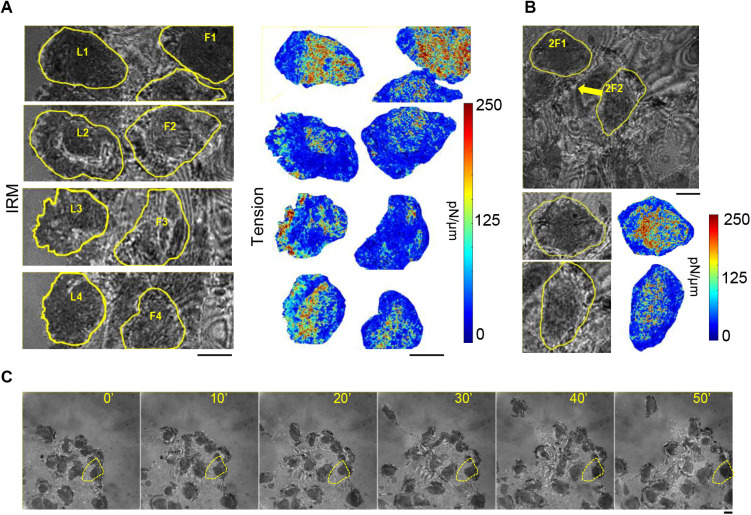
In single keratocyte motility, membrane tension is reported to be high at cell-fronts and believed to establish front coherence. To understand role of membrane mechanics in collective cell migration, we study membrane height fluctuations in cell sheets from fish scales using interference reflection microscopy (IRM). We report the monolayer to have cells lacking substrate adhesion and show that such 'non-sticky' cells can form bridges between leader cells and far-away follower cells. Do such interactions alter motility and membrane mechanics in such leaders? We find non-significant, but reduced speed for leaders with 'non-sticky' followers in comparison to other leaders. Cells show high phenotypic variability in their membrane fluctuation tension profiles. On average, this tension is found to be lower at cell fronts than the mid-section. However, leaders with non-sticky followers are more prone to display higher tension at their front and have a negative correlation between cell speed and front-mid tension difference. Thus, we conclude that intracellular tension gradients are heterogeneous in cell sheets and substrate adhesivity of followers can control the coupling of the gradient to cell speed.

Keywords: Adhesion; Collective cell migration; Membrane fluctuations; Tension gradient.


Conflict of interest statement

Competing interests The authors declare no competing or financial interests.

Figures

Fig. 1.
Fig. 1.
Adhesion profile of keratocyte cell sheets from fish scales and HeLa monolayer. (A) Representative images of increase in size of keratocyte cell sheet emerging out of fish scales. Scale bars: 100 µm. (B) Speed of expansion of the cell sheet as shown in A. (C) Left: IRM and corresponding DIC images of an edge of a cell sheet. Right: Zoomed-in views of an internal region as marked out in dashed yellow rectangle in C, left. Arrows indicate cells that show fringes in IRM but similar pattern as others in DIC. (D) IRM image of a HeLa monolayer with a wound marked in yellow dashed line. Scale bars: 10 µm. Nsheets=4 from four independent experiments.
Fig. 2.
Fig. 2.
Heterogeneous substrate adhesivity and cell brides. (A) Representative selected z-slices of a 3D scan (z step=0.46 µm) of a section of cell sheet with the F-actin labelled with Phalloidin Alexa Fluor 568 (red) and DNA labelled with DAPI (blue). L_NS denotes the three leader cells that lack immediate followers. For the bottom-most cell, the space devoid of follower at lower z-planes (till 4.14 µm) is marked out with a dashed line. Blue arrows point out the cell–cell connections formed between cells spaces far away or at higher planes (only). Yellow arrows point to tight epithelial-like cell–cell connections even for cells that are not visible at lower planes. (B) Projections (top: xy, bottom: xz) of similar section as in A. XY projection is scanned at z=0.46 µm above glass and shows lack of followers for leaders moving towards top and left. XZ scan highlights formation of cell bridge. Cell outlines are guides to eye to follow the lack of substrate-attachment of central cells and proper cell–cell connections at higher z planes. (C) Representative images of F-actin labelled cells imaged at <100 nm depth using TIRF. Yellow arrows in epifluorescence image of same cells show concave edges of connected cells at higher z-planes. Scale bar: 5 µm. Scans are representative of 75 edges scanned from nine cell sheets in three independent experiments.
Fig. 3.
Fig. 3.
Comparison of average speeds over different time-lags. (A) Representative image of an edge of a cell sheet with yellow lines overlaid around leader cells whose immediate followers are well adhered to the substrate. Red lines outline positions of same cells after 10 min. (B) Outlining typical mobility of the two kinds of leader cells every 10 min for 50 min. (C) Speed calculated from time intervals of 41 s (left), 10 min (center) and 50 min (right). For time interval – 41 s: Ncells=66, 53 for Leader_S and Leader_N, respectively, from seven independent experiments. For 10–50 min time intervals: Ncells=67, 60 for Leader_S and Leader_N from eight independent experiments. (D) Fold change in speed calculated using different time-lags. Leader_N cells fall slower but the difference from Leader_S cells is statistically not significant. Trajectory plots of Leader_S and Leader_N cells (x vs y coordinate at different time points) when translated to (0,0). Statistical analysis was performed using Mann–Whitney U-test. ns denotes P-value>0.05. * denotes P-value<0.05. Scale bars: 10 µm.
Fig. 4.
Fig. 4.
Gradient of fluctuations and tension in leaders. (A) Representative IRM images and corresponding tension maps of leader cells (Leader_S and Leader_N) with the front region and the middle region outlined and marked as F and M, respectively. (B) Comparison of SDtime between the front and mid FBRs among Leader_S, Leader_N and all leaders. Leader_S NFront-FBRs=33,654 NMid-FBRs=24,285; Ncells=66; Leader_N NFront-FBRs=27,381 NMid-FBRs=20,253; Ncells=53. (C) Average PSD of front- and mid-regions of leaders followed by sticky cells (Leader_S) and leaders followed by non-sticky cells (Leader_N); Ncells=4; (D) Left: FBR wise comparison of tension of front and mid regions among multiple leaders and clubbed together (Leader_S front=15,440, mid=14,413; Leader_N front=11,624 mid=15,316 regions). Right: Cell wise comparison of tension of front and mid regions among multiple leaders and clubbed together (Leader_S=66, Leader_N=53 cells). (E) Distribution of tension difference between front- and mid-regions among the different population of leaders. (F) Correlation of tension difference between the front- and mid-part of each cell, with its speed calculated over a time interval of 41 s. The Pearson correlation coefficient (R) and P-value are mentioned. Sampling was done from seven independent experiments. Statistical analysis was performed using Mann–Whitney U-test and correlation test was performed using Pearson as well Spearman correlation method. ns denotes P-value>0.05, *P-value<0.05, **P-value<0.001. Scale bars: 10 μm.
Fig. 5.
Fig. 5.
Tension profile in deeper layers. (A) Left: Representative IRM images of edge of a cell sheet with yellow outlines of leaders marked as L1-L4 and 1st layer of followers marked as F1-F4. Right: tension maps of the same. (B) Top: IRM image of two second layers of followers marked as 2F1 and 2F2 and the direction of migration denoted by yellow arrows. Bottom: Corresponding tension maps showing enhanced membrane tension in mid and rear portion. (C) Representative images of a cell edge followed for 50 min (representative of seven independent experiments) with yellow lines outline a follower that remains ‘sticky’ for the complete period. Scale bars: 10 μm.

References

    1. Ananthakrishnan, R. and Ehrlicher, A. (2007). The forces behind cell movement. Int. J. Biol. Sci. 3, 303-317. 10.7150/ijbs.3.303 - DOI - PMC - PubMed
    1. Anon, E., Serra-Picamal, X., Hersen, P., Gauthier, N. C., Sheetz, M. P., Trepat, X. and Ladoux, B. (2012). Cell crawling mediates collective cell migration to close undamaged epithelial gaps. Proc. Natl. Acad. Sci. USA 109, 10891-10896. 10.1073/pnas.1117814109 - DOI - PMC - PubMed
    1. Barnhart, E. L., Allard, J., Lou, S. S., Theriot, J. A. and Mogilner, A. (2017). Adhesion-dependent wave generation in crawling cells HHS Public Access. Curr. Biol. 27, 27-38. 10.1016/j.cub.2016.11.011 - DOI - PMC - PubMed
    1. Batchelder, E. L., Hollopeter, G., Campillo, C., Mezanges, X., Jorgensen, E. M., Nassoy, P., Sens, P. and Plastino, J. (2011). Membrane tension regulates motility by controlling lamellipodium organization. Proc. Natl. Acad. Sci. USA 108, 11429-11434. 10.1073/pnas.1010481108 - DOI - PMC - PubMed
    1. Biswas, A., Alex, A. and Sinha, B. (2017). Mapping cell membrane fluctuations reveals their active regulation and transient heterogeneities. Biophys. J. 113, 1768-1781. 10.1016/j.bpj.2017.08.041 - DOI - PMC - PubMed

Publication types