. 2022 Feb 1;11(2):21.
doi: 10.1167/tvst.11.2.21.

Axial Stretching of Vessels in the Retinal Vascular Plexus With 3D OCT-Angiography

Affiliations

Axial Stretching of Vessels in the Retinal Vascular Plexus With 3D OCT-Angiography

Julian Johannes Kuhlmann et al. Transl Vis Sci Technol. .

Abstract

Purpose: The purpose of this study is to describe and quantify the nonpathological axial stretching in the retinal vascular plexus in three-dimensional (3D) optical coherence tomography angiography (OCTA) images.

Methods: The 3D vascular network underneath the inner limiting membrane of OCTA volumes was labeled as ground truth (GT) data. To analyze the cross-section area of the vessels the width and depth of the vessels in the GT data were computed and an elliptical quotient was proposed to quantify the axial stretching.

Results: A total of 21 3D OCTA volumes were labeled. It was found that the vessels in 3D OCTA images are stretched in the direction of the A-Scan by a factor of 2.46 ± 1.82 with a median of 2.24. Furthermore, a larger cross-section area leads to higher axial stretching.

Conclusions: The elliptical shape of the cross-section area of the vessel does not match with the expected pathology of the vascular network in the human eye. Therefore a correction of the volume data before a 3D analysis is recommended.

Translational relevance: This work gives a systematic insight to the stretched shape of vessels in 3D OCTA images and is relevant for further clinical research analyzing the 3D vascular network.


Conflict of interest statement

Disclosure: J.J. Kuhlmann, None; K. Rothaus, None; X. Jiang, None; B. Heimes-Bussmann, None; H. Faatz, None; M. Book, None; D. Pauleikhoff, None

Figures

Figure 1.
Figure 1.
2D example to determine the vessel width. Left: Labeled ground truth. Middle: Skeletonized ground truth. Right: Illustration for determining the vessel diameter in 2D with the current skeleton pixel (red), the circular area (blue and green), and the overlap of circle and vessel (green). Thirty-seven overlapping pixels with a circle diameter of dcircle = 11px resulting in a vessel diameter of dv=ndcircle=3.36px.
Figure 2.
Figure 2.
Exemplary illustration of the proposed elliptical quotient.
Figure 3.
Figure 3.
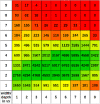
Distribution of width (rows) and depth (columns) in voxels for all skeleton voxels. ddepth = 1vx, since we cannot label or measure a depth smaller than one voxel. Since the OCTA image is not isotropic, this effect is further increased by the resolution of 9.87 µm per voxel in the x- and y-axis and 12.54 µm per voxel in the z-axis. Therefore, we will use the elliptical quotient as introduced in section 2.3 to better describe this behavior.
Figure 4.
Figure 4.
Box plot and the mean value (orange curve) of the elliptical quotient εq with the cross-section area of the vessel in voxels (rounded up) in the x-axis, the elliptical quotient in the y-axis. Black baseline for expected εq = 1.
Figure 5.
Figure 5.
Top: z-slice (parallel to the ILM) of the vascular network. Bottom: B-scan of the OCTA (corresponds to the blue line in the top image) with two examples for vessels with a high elliptical quotient (left εq = 4.14, right εq = 4.19).
Figure 6.
Figure 6.
Comparison of three other OCTA device manufacturers: Slice of a 3D OCTA images captured with the “Zeiss PlexElite” (left, 10 µm in the x-axis and 19.5 µm in z-axis per voxel), the “Heidelberg Engineering's SPECTRALIS OCTA” (middle, 19.5 µm in the x-axis and 12.2 µm in z-axis per voxel), and the “ZEISS CIRRUS OCT with AngioPlex” (right, 11 µm in the x-axis and 3.9 µm in z-axis per voxel). Note the elongated, elliptical shaped, vascular structures marked by the red arrows that are higher than the expected axial stretching caused by the differences in axial resolution.
Figure 7.
Figure 7.
Simplified, not true to scale, representation of the OCT/OCTA imaging technique for a vessel (black circle) with a double reflection in lateral direction.

References

    1. Spaide RF, Fujimoto JG, Waheed NK, Sadda SR, Staurenghi G. Optical coherence tomography angiography. Progr Retinal Eye Res. 2018; 64: 1–55. - PMC - PubMed
    1. Jia Y, Tan O, Tokayer J, et al. .. Split-spectrum amplitude-decorrelation angiography with optical coherence tomography. Opt Express. 2012; 20: 4710–4725. - PMC - PubMed
    1. El-Baz A, Jiang X, Suri JS, eds. Biomedical Image Segmentation: Advances and Trends. Boca Raton: CRC Press, 2016.
    1. Eladawi N, Elmogy M, Ghazal M, et al. .. Early signs detection of diabetic retinopathy using optical coherence tomography angiography scans based on 3D multi-path convolutional neural network. In: 2019 IEEE International Conference on Image Processing (ICIP). 2019: 1390–1394.
    1. Ma Y, Hao H, Xie J, et al. .. ROSE: A retinal OCT-angiography vessel segmentation dataset and new model. IEEE Transactions on Medical Imaging. 2021; 40: 928–939. - PubMed

Publication types

MeSH terms