Personalized Surgical Transfusion Risk Prediction Using Machine Learning to Guide Preoperative Type and Screen Orders
- PMID: 35147666
- PMCID: PMC9177553
- DOI: 10.1097/ALN.0000000000004139
Personalized Surgical Transfusion Risk Prediction Using Machine Learning to Guide Preoperative Type and Screen Orders
Abstract
Background: Accurate estimation of surgical transfusion risk is essential for efficient allocation of blood bank resources and for other aspects of anesthetic planning. This study hypothesized that a machine learning model incorporating both surgery- and patient-specific variables would outperform the traditional approach that uses only procedure-specific information, allowing for more efficient allocation of preoperative type and screen orders.
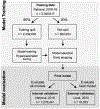
Methods: The American College of Surgeons National Surgical Quality Improvement Program Participant Use File was used to train four machine learning models to predict the likelihood of red cell transfusion using surgery-specific and patient-specific variables. A baseline model using only procedure-specific information was created for comparison. The models were trained on surgical encounters that occurred at 722 hospitals in 2016 through 2018. The models were internally validated on surgical cases that occurred at 719 hospitals in 2019. Generalizability of the best-performing model was assessed by external validation on surgical cases occurring at a single institution in 2020.
Results: Transfusion prevalence was 2.4% (73,313 of 3,049,617), 2.2% (23,205 of 1,076,441), and 6.7% (1,104 of 16,053) across the training, internal validation, and external validation cohorts, respectively. The gradient boosting machine outperformed the baseline model and was the best- performing model. At a fixed 96% sensitivity, this model had a positive predictive value of 0.06 and 0.21 and recommended type and screens for 36% and 30% of the patients in internal and external validation, respectively. By comparison, the baseline model at the same sensitivity had a positive predictive value of 0.04 and 0.144 and recommended type and screens for 57% and 45% of the patients in internal and external validation, respectively. The most important predictor variables were overall procedure-specific transfusion rate and preoperative hematocrit.
Conclusions: A personalized transfusion risk prediction model was created using both surgery- and patient-specific variables to guide preoperative type and screen orders and showed better performance compared to the traditional procedure-centric approach.
Copyright © 2022, the American Society of Anesthesiologists. All Rights Reserved.
Conflict of interest statement
Conflicts of interest: The authors declare no competing interests. BLH is consulting director of the ACS-NSQIP for the American College of Surgeons. TK has consulting relationships with Pfizer Inc. and Elsevier that are unrelated to this work.
Figures


Comment in
-
Moving from "Surgeries" to Patients: Progress and Pitfalls While Using Machine Learning to Personalize Transfusion Prediction.Anesthesiology. 2022 Jul 1;137(1):9-12. doi: 10.1097/ALN.0000000000004250. Anesthesiology. 2022. PMID: 35657729 No abstract available.
-
Personalized Surgical Transfusion Risk Prediction: Comment.Anesthesiology. 2023 Jan 1;138(1):117-118. doi: 10.1097/ALN.0000000000004398. Anesthesiology. 2023. PMID: 36512717 Free PMC article. No abstract available.
-
Personalized Surgical Transfusion Risk Prediction: Reply.Anesthesiology. 2023 Jan 1;138(1):118-119. doi: 10.1097/ALN.0000000000004399. Anesthesiology. 2023. PMID: 36512722 No abstract available.
-
Personalized Surgical Transfusion Risk Prediction: Comment.Anesthesiology. 2023 Jan 1;138(1):116-117. doi: 10.1097/ALN.0000000000004397. Anesthesiology. 2023. PMID: 36512726 No abstract available.
References
-
- American Society of Anesthesiologists Task Force on Perioperative Blood Management: Practice guidelines for perioperative blood management: an updated report by the American Society of Anesthesiologists Task Force on Perioperative Blood Management*. Anesthesiology 2015; 122:241–75 - PubMed
-
- Friedman BA: An analysis of surgical blood use in United States hospitals with application to the maximum surgical blood order schedule. Transfusion (Paris) 1979; 19:268–78 - PubMed
-
- Dexter F, Ledolter J, Davis E, Witkowski TA, Herman JH, Epstein RH: Systematic Criteria for Type and Screen Based on Procedure’s Probability of Erythrocyte Transfusion. Anesthesiology 2012; 116:768–78 - PubMed
-
- Frank SM, Rothschild JA, Masear CG, Rivers RJ, Merritt WT, Savage WJ, Ness PM: Optimizing Preoperative Blood Ordering with Data Acquired from an Anesthesia Information Management System. Anesthesiology 2013; 118:1286–97 - PubMed
-
- Woodrum CL, Wisniewski M, Triulzi DJ, Waters JH, Alarcon LH, Yazer MH: The effects of a data driven maximum surgical blood ordering schedule on preoperative blood ordering practices. Hematology 2017; 22:571–7 - PubMed

