. 2022 Mar 8;18(3):1359-1381.
doi: 10.1021/acs.jctc.1c00590. Epub 2022 Feb 11.

Enhancing Sampling of Water Rehydration on Ligand Binding: A Comparison of Techniques

Affiliations

Enhancing Sampling of Water Rehydration on Ligand Binding: A Comparison of Techniques

Yunhui Ge et al. J Chem Theory Comput. .

Abstract

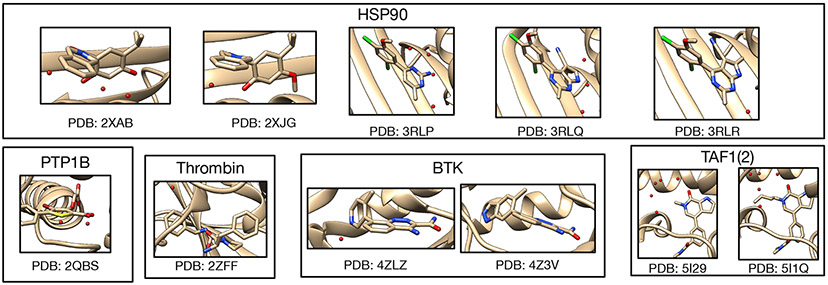
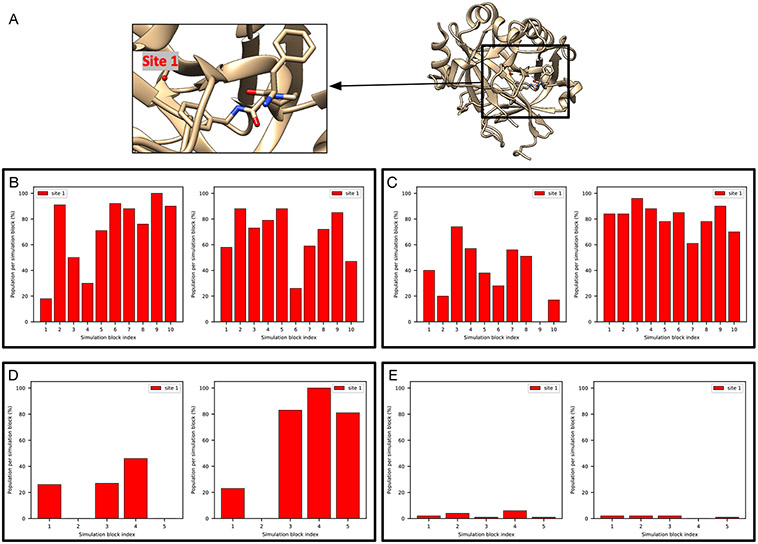
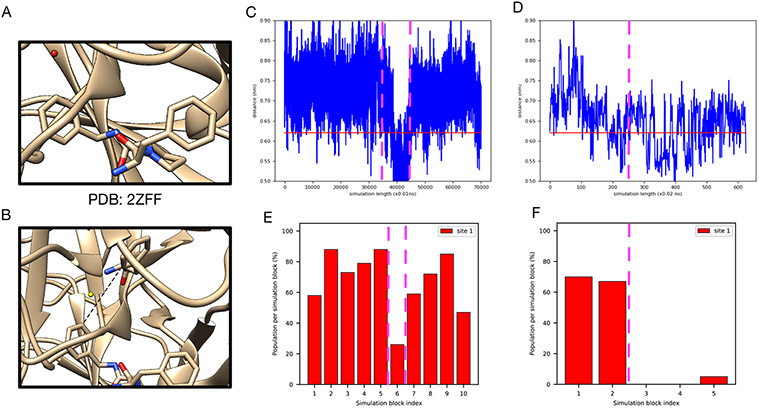
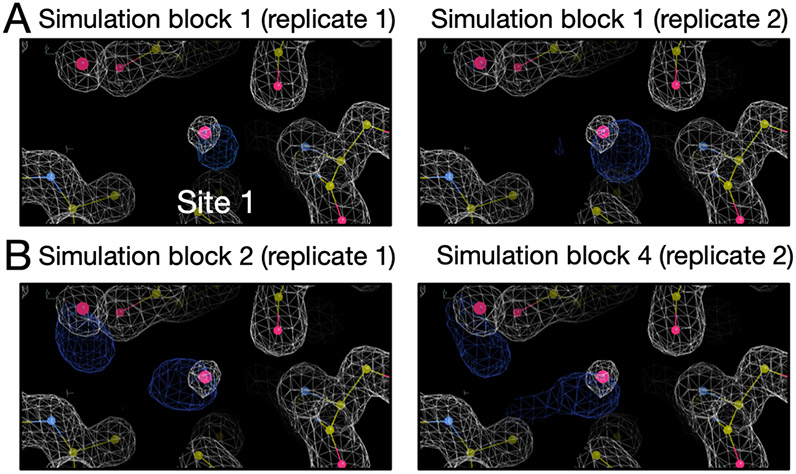
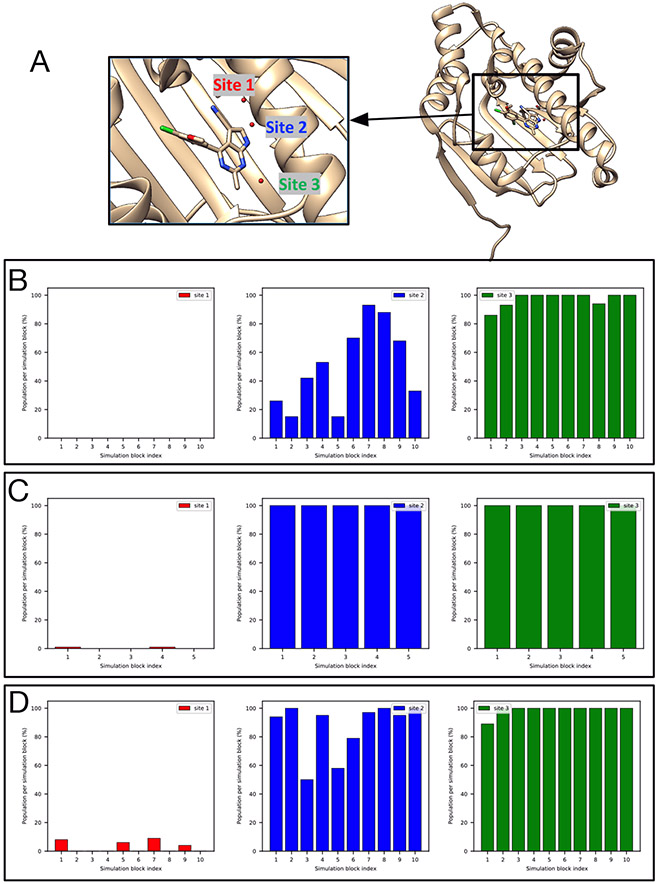
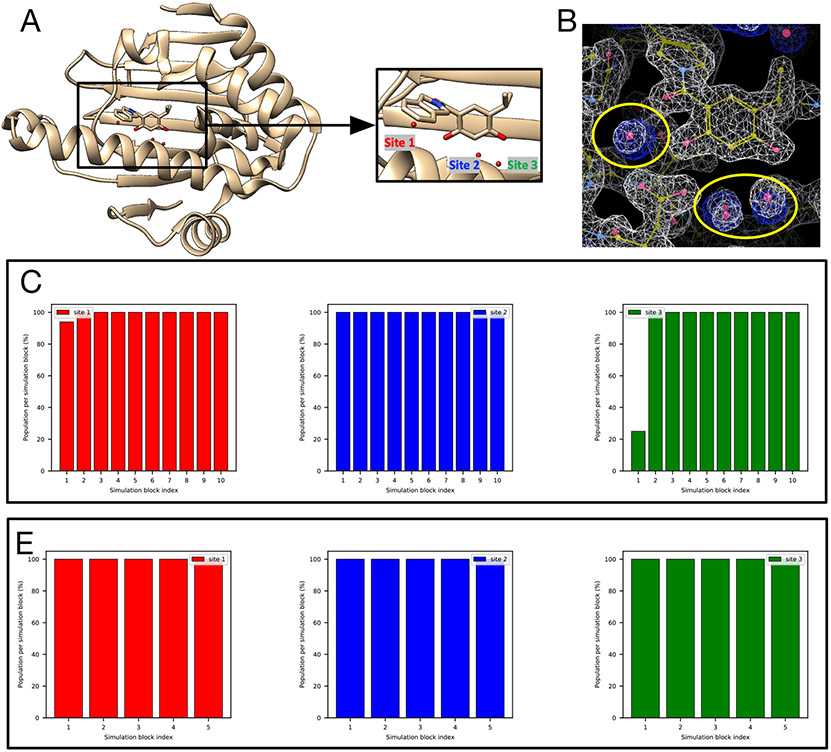
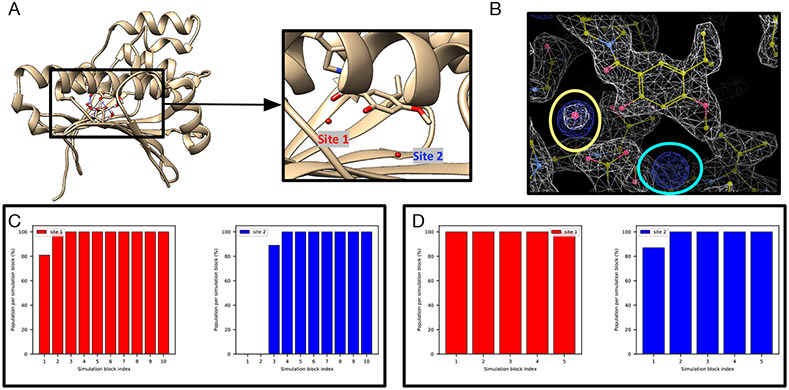
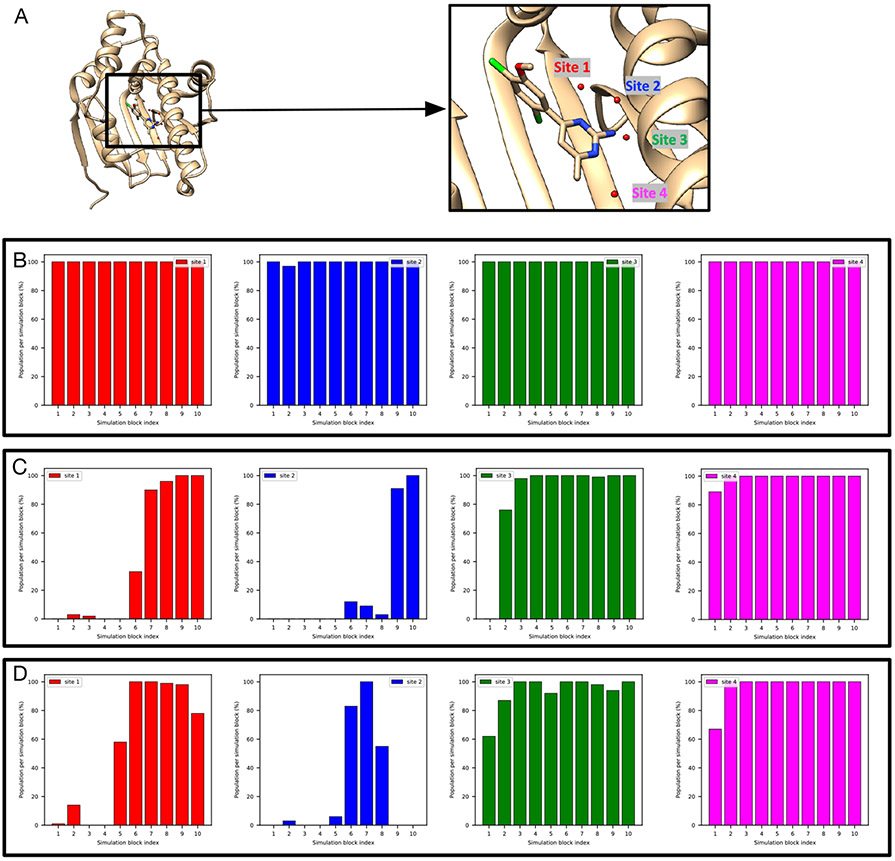
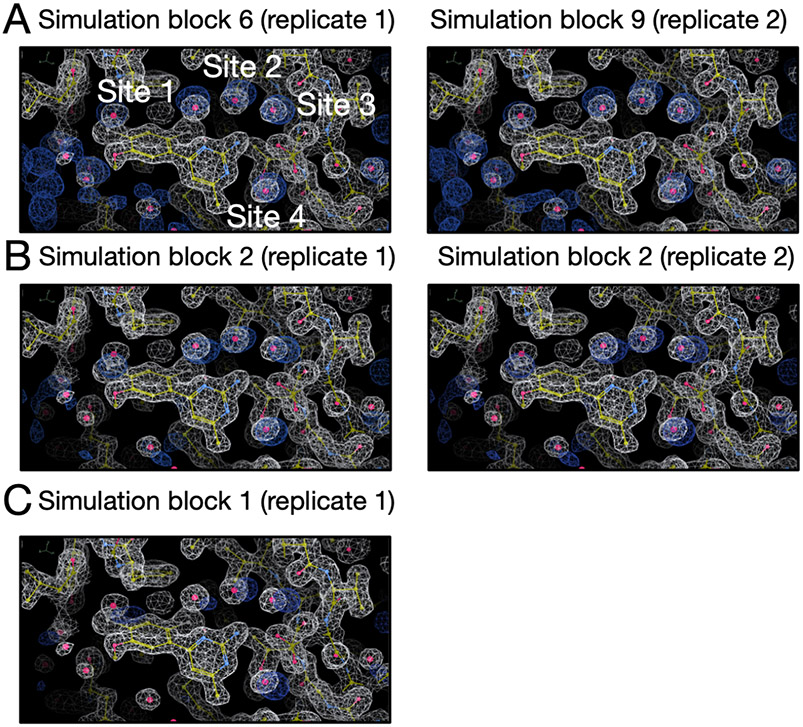
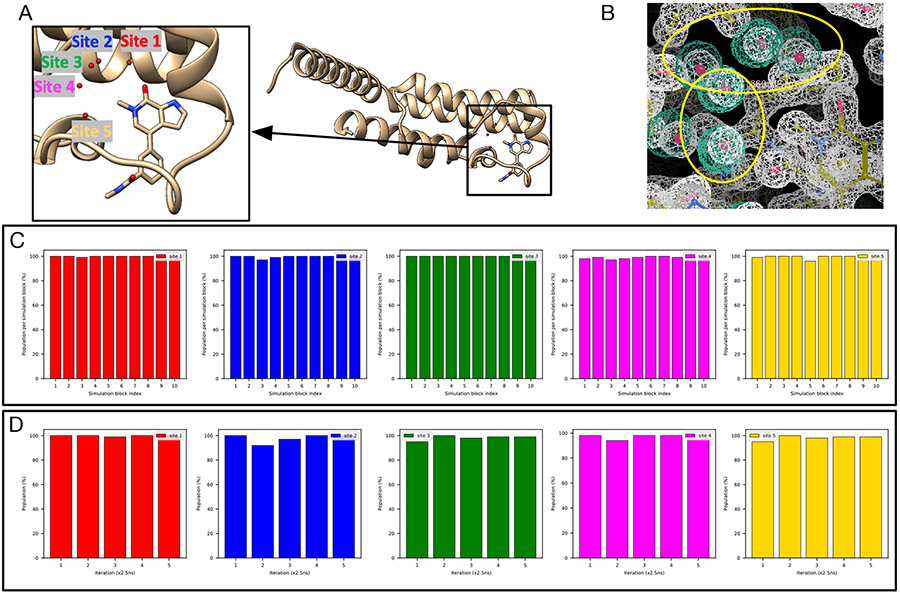
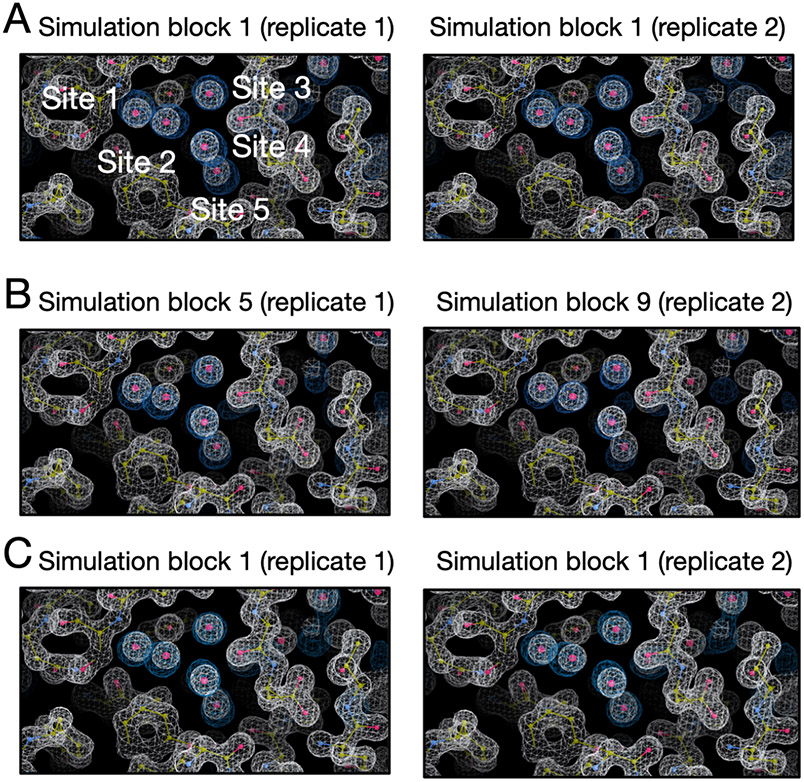
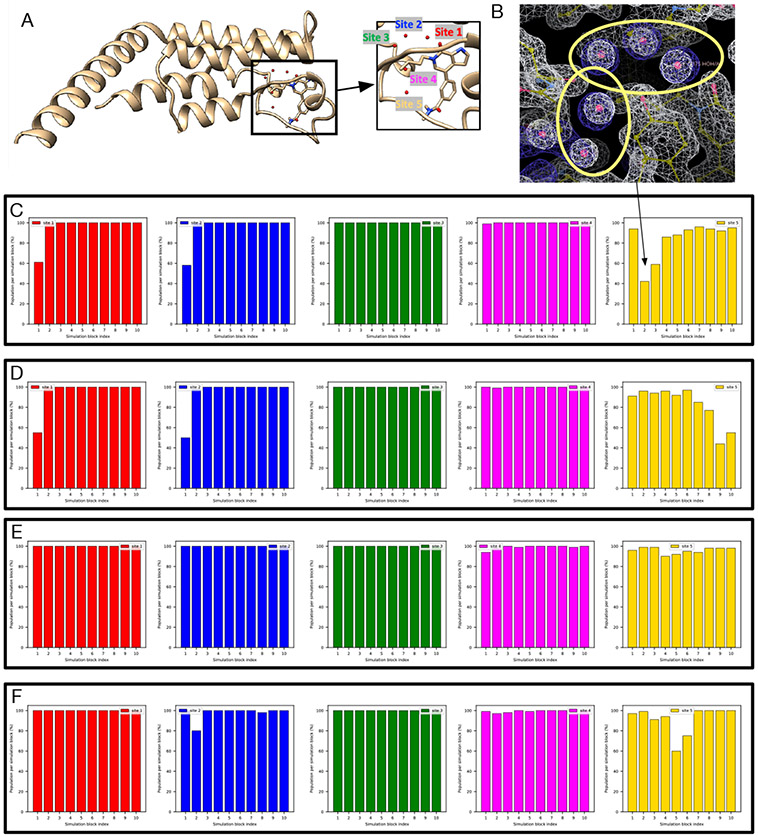
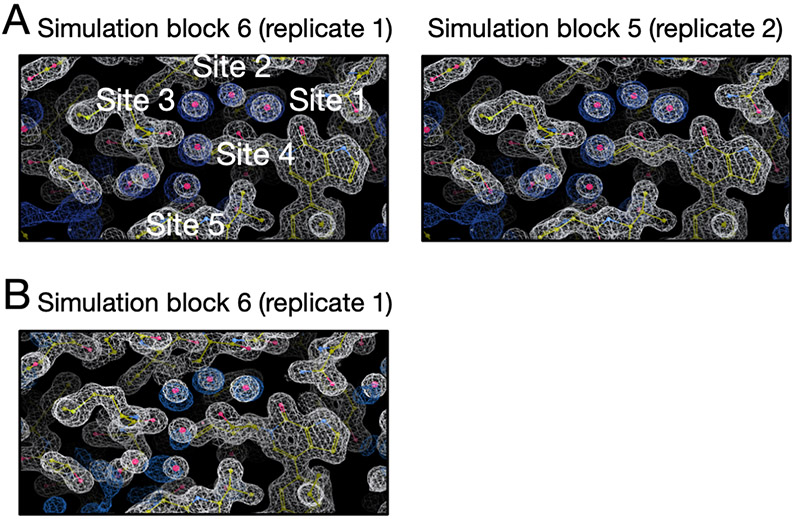
Water often plays a key role in protein structure, molecular recognition, and mediating protein-ligand interactions. Thus, free energy calculations must adequately sample water motions, which often proves challenging in typical MD simulation time scales. Thus, the accuracy of methods relying on MD simulations ends up limited by slow water sampling. Particularly, as a ligand is removed or modified, bulk water may not have time to fill or rearrange in the binding site. In this work, we focus on several molecular dynamics (MD) simulation-based methods attempting to help rehydrate buried water sites: BLUES, using nonequilibrium candidate Monte Carlo (NCMC); grand, using grand canonical Monte Carlo (GCMC); and normal MD. We assess the accuracy and efficiency of these methods in rehydrating target water sites. We selected a range of systems with varying numbers of waters in the binding site, as well as those where water occupancy is coupled to the identity or binding mode of the ligand. We analyzed the rehydration of buried water sites in binding pockets using both clustering of trajectories and direct analysis of electron density maps. Our results suggest both BLUES and grand enhance water sampling relative to normal MD and grand is more robust than BLUES, but also that water sampling remains a major challenge for all of the methods tested. The lessons we learned for these methods and systems are discussed.


Figures

Figure 1:
Figure 1:
All 11 protein-ligand systems studied in this work and their hydration sites (red spheres) and their PDB IDs.
Figure 2:
Figure 2:
Examples of water occupancy and electron density maps for success cases. (A) Bar graphs show the water occupancy of a target hydration site in a single simulation. In this case we consider a simulation successful if the occupancy of the target water site is within 5% of 100% in a single simulation block. If successful, we check the force evaluations required to achieve this, including the number of evaluations used in equilibration. (B) The calculated electron density map of water molecules from simulation data (magenta) and the experimental determined density map (2Fo-Fc map) (white).
Figure 3:
Figure 3:
BLUES/MD/grand simulations can rehydrate both target sites (Site1: red, Site 2: blue) in (A) the PTP1B system (PDB: 2QBS). Bar graphs show the water occupancy of target sites in a single (B) BLUES simulation, (C) normal MD simulation, and (D) grand simulation. In all simulations, the ordered water molecules were removed prior to simulations. The number of force evaluations for one simulation block in (B-D) is 1.4 million, 35 million, and 1.4 million. Position restraints on the protein and ligand heavy atoms were applied in (B) and (D).
Figure 4:
Figure 4:
Ligand motion blocks insertion of water molecules in the target site of a TAF1(2) system (PDB: 5I1Q). Snapshots extracted from (A) grand simulation and (B) MD simulation. No restraints were used in either simulation. The crystallographic pose is shown in blue and simulation snapshots are shown in tan. Bar graphs show the water occupancy of Site 2 in a single (A)grand simulation, (B) MD simulation.
Figure 5:
Figure 5:
It is challenging to rehydrate the target site (red) in (A) The thrombin system (PDB: 2ZFF). Bar graphs show the water occupancy of the target site in (B) unbiased MD simulations with ordered water molecules removed prior to simulations, (C) unbiased MD simulations with ordered water molecules retained prior to simulations, (D) grand simulations and (E) grand simulations with position restraints on heavy atoms of the protein and all atoms of the ligand. All ordered water molecules were removed prior to grand simulations in (D-E).
Figure 6:
Figure 6:
A correlation between the distance between the protein and ligand and the success of water insertion was observed in (A) the thrombin system (the target water site shown in red). (B) The atoms selected to compute distance between the protein and ligand. The distance change during (C) unbiased MD and (D) grand simulations (no restraints used). Bar graphs show the water occupancy of target hydration site in a single (E) unbiased MD and (F) grand simulation (no restraints used). The horizontal lines in (C) and (D) highlight the distance in the crystal structure (PDB: 2ZFF). The dashed vertical lines highlight the simulation block(s) in (C)-(D) and their corresponding occupancies in (E)-(F).
Figure 7:
Figure 7:
Calculated electron densities (blue) from simulations compared to the experimental densities (white) of the thrombin system (PDB: 2ZFF). The target site is labeled. We only show the simulation block when we first observe a good agreement between the calculated and experimental density. Both grand and MD simulations can reproduce the experimental electron densities for the target site. Panel A and B are results from grand and MD simulations, respectively. The left and right columns are results from two replicates for each simulation technique. The number of force evaluations for one simulation block in replicate 1 in panel B is 35 million. The number of force evaluations for one simulation block in other panels is 1.4 million.
Figure 8:
Figure 8:
None of our simulations could rehydrate Site 1 (red), though they could rehydrate Sites 2-3 (blue, green) in (A) The HSP90 system (PDB: 3RLQ). Bar graphs show the water occupancy of target sites in a single (B) BLUES simulation (with ordered water molecules removed prior to simulation), (C) grand simulation, and (D) unbiased MD simulation.
Figure 9:
Figure 9:
Both BLUES and grand simulations can rehydrate all three target sites (Site 1: red, Site 2: blue, Site 3: green) in (A) the HSP90 system (PDB: 2XAB). (B) The calculated electron density map (blue) overlaps with the experimental electron density (2FoFc) map (white). The target hydration sites are circled. The calculation is based on a BLUES simulation trajectory where all target sites have occupancies of 100%. Bar graphs show the water occupancy of target sites in a single (C) BLUES simulation, (D) grand simulation.
Figure 10:
Figure 10:
Both BLUES and grand simulations can rehydrate the target site (red) in (A) The HSP90 system (PDB: 2XJG). Our results also suggest another favorable site near the binding site in which no waters are deposited in the crystal structure. (B) The calculated electron density map (blue) overlaps with the experimental electron density (2FoFc) map (white). The target hydration site is circled in yellow and the extra site is circled in cyan. The calculation is based on a BLUES simulation trajectory. Bar graphs show the water occupancy of target sites in a single (C) BLUES simulation, and (D) grand simulation. The number of force evaluations of each simulation block in (C-D) is 1.4 million.
Figure 11:
Figure 11:
It is more challenging to rehydrate Site 1-2 (red, blue) than Site 3-4 (green, magenta) in BLUES simulations of (A) the HSP90 system (PDB: 3RLP). Bar graphs show the water occupancy of target sites in a single (B) BLUES simulation (all ordered water molecules were retained prior to simulations), (C-D) BLUES simulations (all ordered water molecules were removed prior to simulations).
Figure 12:
Figure 12:
Calculated electron densities (blue) from simulations compared to the experimental densities (white) of the HSP90 system (PDB: 3RLP). Target sites are labeled. We only show the simulation block in which we first observe a good agreement between the calculated and experimental density. All simulations can reproduce the experimental electron densities for target sites but MD simulations can only achieve it in one replicate. Among all simulation techniques, BLUES is the most expensive one to achieve success in this case. Panel A, B and C are results from BLUES, grand and MD simulations, respectively. The left and right columns are results from two replicates for each simulation technique.
Figure 13:
Figure 13:
Both BLUES and grand simulations suggest high occupancies (close to 100%) for Site 1-5 (red, blue, green, magenta, yellow) in (A) the TAF1(2) system (PDB: 5I29). (B) The calculated electron density map (blue) overlaps with the experimental electron density (2FoFc) map (white). The target hydration sites are circled. The calculation is based on a BLUES simulation trajectory where all target sites have occupancies of 100%. Bar graphs show the water occupancy of target sites in a single (C) BLUES simulation and (D) grand simulation.
Figure 14:
Figure 14:
Calculated electron densities (blue) from simulations compared to the experimental densities (white) of the TAF1(2) system (PDB: 5I29). Target sites are labeled. We only show the simulation block when we first observe a good agreement between the calculated and experimental density. All simulations can reproduce the experimental electron densities for target sites but MD simulations are more expensive to achieve it. Panel A, B and C are results from BLUES, MD and grand simulations, respectively. The left and right columns are results from two replicates for each simulation technique. The number of force evaluation for each simulation block is 1.4 million in this analysis.
Figure 15:
Figure 15:
BLUES simulations return converged occupancies for all target sites (Site 1: red, Site 2: blue, Site 3: green, Site 4: magenta, Site 5: yellow) in (A) The TAF1(2) system (PDB: 5I1Q). (B) The calculated electron density map (blue) overlaps with the experimental electron density (2FoFc) map (white). The target hydration sites are circled. The calculation is based on a BLUES simulation trajectory shown in (C). Bar graphs show the water occupancy of target sites in BLUES simulations with ordered water molecules (C-D) removed and (E-F) retained prior to simulations.
Figure 16:
Figure 16:
Calculated electron densities (blue) from simulations compared to the experimental densities (white) of the TAF1(2) system (PDB: 5I1Q). Target sites are labeled. We only show the simulation block when we first observe a good agreement between the calculated and experimental density. Both BLUES replicates can reproduce the experimental electron densities for target sites but only one replicate of grand simulations can achieve this. Panel A and B are results from BLUES and grand simulations, respectively. The left and right columns are results from two replicates for each simulation technique. The number of force evaluation for each simulation block is 1.4 million in this analysis.
Figure 17:
Figure 17:
Calculated electron densities (blue) from simulations compared to the experimental densities (white) of the BTK system (PDB: 4ZLZ). The target site is labeled. We only show the simulation block when we first observe a good agreement between the calculated and experimental density. All simulations can reproduce the experimental electron densities. Panel A, B and C are results from BLUES, grand and MD simulations, respectively. The left and right columns are results from two replicates for each simulation technique. The number of force evaluation for each simulation block is 1.4 million in this analysis.

Similar articles

Cited by

References

    1. Ball P Water as an Active Constituent in Cell Biology. Chem. Rev 2008, 108, 74–108. - PubMed
    1. Levy Y; Onuchic JN Water Mediation in Portein Folding and Molecular Recognition. Annu. Rev. Biophys. Biomol. Struct 2006, 35, 389–415. - PubMed
    1. Ernst JA; Clubb RT; Zhou H-X; Gronenborn AM; Clore GM Demonstration of positionally disordered water within a protein hydrophobic cavity by NMR. Science 1995, 267, 1813–1817. - PubMed
    1. Meyer E Internal Water Molecules and H-Bonding in Biological Macromolecules: A Review of Structural Features with Functional Implications. Protein Sci. 1992, 1, 1543–1562. - PMC - PubMed
    1. Nittinger E; Schneider N; Lange G; Rarey M Evidence of Water Molecules—A Statistical Evaluation of Water Molecules Based on Electron Density. J. Chem. Inf. Model 2015, 55, 771–783. - PubMed