. 2022 Feb 11;8(6):eabj1262.
doi: 10.1126/sciadv.abj1262. Epub 2022 Feb 11.

Versatile ginsenoside Rg3 liposomes inhibit tumor metastasis by capturing circulating tumor cells and destroying metastatic niches

Affiliations

Versatile ginsenoside Rg3 liposomes inhibit tumor metastasis by capturing circulating tumor cells and destroying metastatic niches

Jiaxuan Xia et al. Sci Adv. .

Abstract

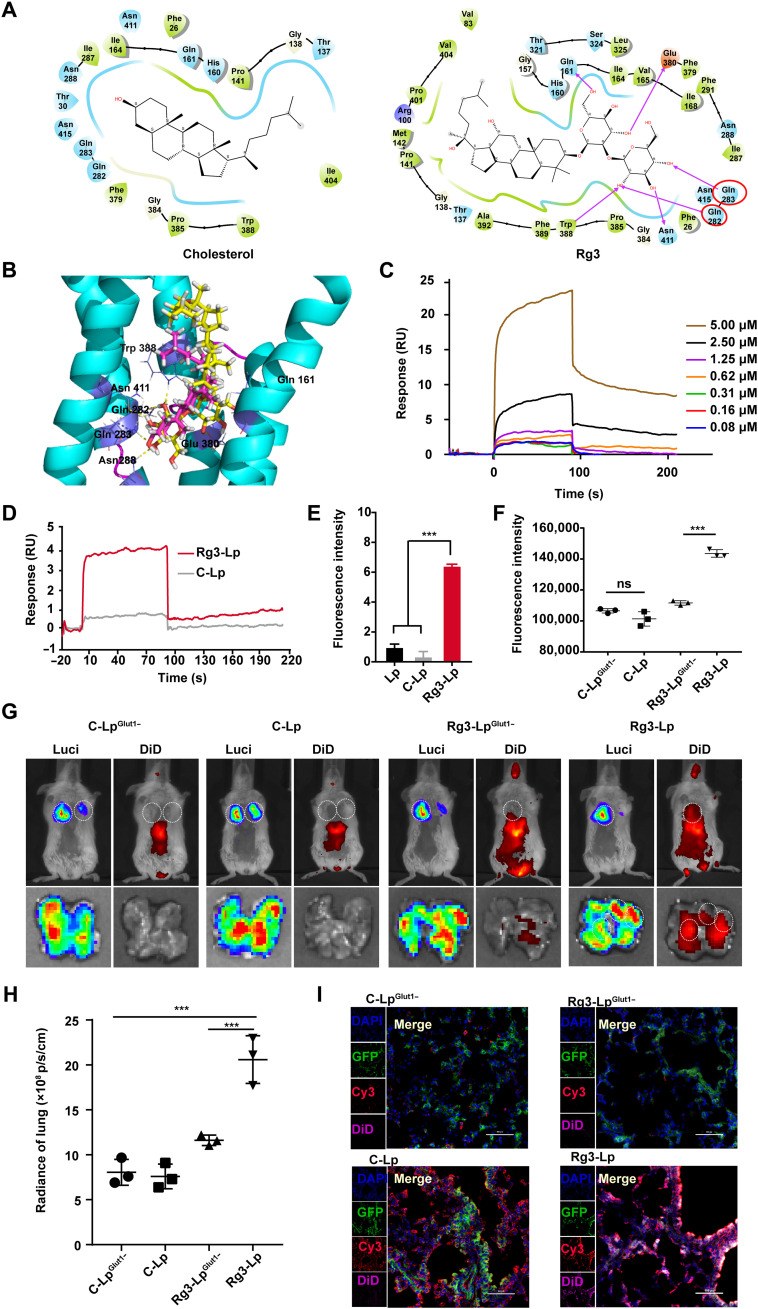
Limited circulating tumor cells (CTCs) capturing efficiency and lack of regulation capability on CTC-supportive metastatic niches (MNs) are two main obstacles hampering the clinical translation of conventional liposomes for the treatment of metastatic breast cancers. Traditional delivery strategies, such as ligand modification and immune modulator co-encapsulation for nanocarriers, are inefficient and laborious. Here, a multifunctional Rg3 liposome loading with docetaxel (Rg3-Lp/DTX) was developed, in which Rg3 was proved to intersperse in the phospholipid bilayer and exposed its glycosyl on the liposome surface. Therefore, it exhibited much higher CTC-capturing efficiency via interaction with glucose transporter 1 (Glut1) overexpressed on CTCs. After reaching the lungs with CTCs, Rg3 inhibited the formation of MNs by reversing the immunosuppressive microenvironment. Together, Rg3-Lp/DTX exhibited excellent metastasis inhibition capacity by CTC ("seeds") neutralization and MN ("soil") inhibition. The strategy has great clinical translation prospects for antimetastasis treatment with enhanced therapeutic efficacy and simple preparation process.


Figures

Fig. 1.
Fig. 1.. Schematic diagram of Rg3-Lp/DTX preparation and its inhibiting mechanism on lung metastasis of TNBC.
(A) Preparation of Rg3-Lp/DTX by thin-film hydration method. (B) Because Rg3 extends its glucose moieties out of the surface of the liposome, Rg3-Lp/DTX can accurately capture CTCs through Glut1-Rg3 interaction. After reaching metastatic lesions with the disseminated CTCs, Rg3 can inhibit C─C chemokine ligand 2 (CCL2) secretion of tumor cells and thus prevent the recruitment of MDSCs and TAMs, destroy the formation of MNs, and promote the immune surveillance of tumor cells by cytotoxic T lymphocytes (CTLs).
Fig. 2.
Fig. 2.. Preparation and characterization of C-Lp/DTX and Rg3-Lp/DTX.
(A) Size distribution of C-Lp/DTX and Rg3-Lp/DTX. (B) Morphology of C-Lp/DTX and Rg3-Lp/DTX. Scale bars, 100 nm. (C) The vivid interaction between Rg3 and DSPC. Rg3 and DSPC were represented by stick and surface map as purple and green color, respectively; the water phase was omitted for the simplicity of display. (D) Typical coordinations of Rg3 with DSPC lipids and water molecules (H2O) in 3D (left) (Rg3: purple; PC: green; H2O: O in red and H in white sticks; hydrogen bond interactions: red dotted lines) and 2D (right) (Rg3: blue; PC: brown; H2O: single red dot; hydrogen bond interactions: green dotted lines) models. The rough coordinates were defined by setting the z axis as the membrane’s normal line, and Z = 0 means the center of the membrane bilayer. (E) Pyrene micropolarity I1/I3 (378/383) in pure liposomes (Lp), C-Lp, and Rg3-Lp. (F) Fluorescence anisotropy of DPH obtained from Lp, C-Lp, and Rg3-Lp. (G) Release stability of Rg3-Lp/DTX and C-Lp/DTX in 10% fetal bovine serum (FBS). All data are represented as means ± SD; n = 3; *P < 0.05, **P < 0.01, and ***P < 0.001.
Fig. 3.
Fig. 3.. Precise CTC-targeting ability of Rg3-Lp.
(A) Quantitative analysis of cellular uptake of 1,19-dioctadecyl-3,3,39,39-tetramethylindodicarbocyanine perchlorate (DiD)–loaded C-Lp (C-Lp/DiD) or Rg3-Lp (Rg3-Lp/DiD) by circulating 4T1 cells and RBCs. (B) Representative confocal laser scanning microscope (CLSM) images of cellular uptake of C-Lp/DiD or Rg3-Lp/DiD by circulating 4T1 cells and RBCs. Scale bars, 50 μm. Inset scale bars, 10 μm. (C) Representative 10 min of IVFC results after intravenous injection of CFSE-4T1 cells and the following Rg3-Lp/DiD or C-Lp/DiD. (D) Representative confocal intravital microscopy (IVM) images of the mice ear blood vessels after intravenous injection of CFSE-4T1 cells and the following C-Lp/DiD or Rg3-Lp/DiD. (E) In vivo fluorescent and BLI images of the mice and ex vivo fluorescent and BLI images of various organs at 4 hours after the injection of Luc-4T1 cells and DiD-loaded liposomes. (F) Semiquantification of the fluorescent signals in lung tissues excised from mice with early metastatic lesions. n = 3; ***P < 0.001. ns, not significant.
Fig. 4.
Fig. 4.. Targeting of Rg3-Lp and C-Lp to already formed lung metastasis and cellular uptake of Rg3-Lp and C-Lp in static 4T1 cells.
(A) In vivo fluorescence imaging of the mice with TNBC lung metastasis at 1, 2, 4, 8, 12, and 24 hours after administration with C-Lp/DiD (top) and Rg3-Lp/DiD (bottom) and in vivo BLI image of the same mice in each group at 24 hours after administration of DiD-labeled liposomes (the sites marked by the white dashed box are the corresponding lung metastasis lesions according to the BLI images). (B) Ex vivo fluorescent and BLI images of isolated mice organs. (C) Semiquantification of fluorescent signals in major organs excised from lung metastasis–bearing mice. (D) Representative immunofluorescence (IF) images of frozen lung slices from mice with TNBC lung metastasis. Blue: DAPI for staining cell nucleus; green: GFP-4T1 cells; red: Glut1; and purple: DiD-loaded liposomes. Scale bars, 20 μm. (E) Quantitative analysis of cellular uptake of C-Lp/C6 and Rg3-Lp/C6 in static 4T1 cells with or without pretreatment of different Glut1 inhibitors. n = 3; *P < 0.05, **P < 0.01, and ***P < 0.001.
Fig. 5.
Fig. 5.. Active targeting mechanisms of Rg3-Lp to tumor cells.
(A) Maps of Rg3-Glut1 and cholesterol-Glut1 interaction, the arrows represent H-bond interactions. (B) 3D overlay showing the interaction of Glut1 with Rg3 (bright yellow) and cholesterol (purple). The bright yellow dotted lines represent H-bond interactions between Rg3 and Glut1. (C) Binding kinetics of Rg3-Glut1. (D) Binding curves of Rg3-Lp and C-Lp (1.52 μM Rg3 or Chol) with immobilized Glut1. (E) WGA binding signal of Lp, C-Lp, and Rg3-Lp to identify the exposed glycosyl on the liposome membrane. (F) Flow cytometry analysis of cellular uptake of C-Lp/C6 and Rg3-Lp/C6 in normal and 4T1Glut1− cells. (G) In vivo and ex vivo fluorescent and BLI images of the mice at 4 hours after the sequential injection of Glut1-knockdown/normal Luc-4T1 cells and DiD-loaded liposomes. (H) Semiquantification of DiD signal in the lungs from the mice at 4 hours after the injection of Glut1-knockdown/normal Luc-4T1 cells and DiD-loaded liposomes. (I) Representative IF images of the lung frozen slices from the mice at 4 hours after the injection of Glut1-knockdown/normal Luc-4T1 cells and DiD-loaded liposomes. Blue: DAPI for staining cell nucleus; green: GFP-labeled 4T1 cells; red: Glut1; and purple: DiD-loaded liposomes. Scale bars, 100 μm. n = 3; ***P < 0.001. ns, not significant.
Fig. 6.
Fig. 6.. Cellular cytotoxicity and apoptosis effect of the liposomes.
(A) In vitro cytotoxicity assay of different formulations on 4T1 cells after 48 hours of co-incubation (n = 6). (B) Percentages of early, late, and total apoptosis of 4T1 cells and leukocytes in blood/4T1 mixture after different treatment. (C) WB analysis of NF-κB p65, Bax, and Bcl2 expression in 4T1 cells after different treatments. (D) Quantification of WB protein levels by group. n = 3; ***P < 0.001.
Fig. 7.
Fig. 7.. Effect of Rg3-Lp/DTX on lung metastasis and survival time of mice.
(A) Schematic design of TNBC lung metastasis therapy. (B) Metastasis progression curves depicted from in vivo BLI signal intensity (n = 4). (C) Quantitative analysis of total BLI signals detected in isolated lungs at the end of the treatment (n = 4). (D) BLI images of lung metastasis at different time points in the mice treated with various drugs and ex vivo lung BLI images at the end point (n = 4). (E) Survival time of the mice in various groups displayed as Kaplan-Meier curves (n = 5). (F) Quantification of metastasis node numbers of excised lungs from the mice in different groups (n = 5). **P < 0.01 and ***P < 0.001.
Fig. 8.
Fig. 8.. Differential regulation of lung metastasis niches treated with various drugs.
(A) WB identification and comparison of p-STAT3 and STAT3 expression in 4T1 cells after different treatment. (B) Semiquantitative results of the relative level of p-STAT3 and STAT3 in 4T1 cells obtained in WB assays. (C) Gene expression of CCL2 in 4T1 cells treated with different drugs determined by qPCR. Concentration of CCL2 in 4T1-CM (D) and metastatic lung tissues (E) after different treatment measured by ELISA. (F) The migration ability of TAMs when incubated with 4T1-CM pretreated with different formulations. (G) Flow cytometry analysis of lung-infiltrating Gr1 high CD11b + granulocytic (G-MDSC) and Gr1int CD11b + monocytic (M-MDSC). (H) TAM populations (CD45+/F4/80+/CD206+) in lung tissues detected by flow cytometry. (I) Histogram analysis of CD4+ and CD8+ lymphocytes in mice treated with Rg3-Lp/DTX, control groups, and PBS group. (J) Full scanning images of hematoxylin and eosin (H&E), p-STAT3, CCL2, MDSC (Gr1-red and CD11b-green) and TAM (F4/80-red and CD206-green) staining of lung tissues of the mice treated with different drugs and the zoomed-in images of p-STAT3 and CCL2 staining of lung tissues from the full-scan images in each group (the black box represents the field of view selected for magnification). Scale bars, 5 mm for full scanning images and 0.2 mm for magnified images. n = 3; *P < 0.05, **P < 0.01, and ***P < 0.001.

Similar articles

Cited by

References

    1. Balayla J., Tulandi T., Buckett W., Holzer H., Steiner N., Shrem G., Volodarsky-Perel A., Outcomes of ovarian stimulation and fertility preservation in breast cancer patients with different hormonal receptor profiles. J. Assist. Reprod. Genet. 37, 913–921 (2020). - PMC - PubMed
    1. Mantovani A., Inflaming metastasis. Nature 457, 36–37 (2009). - PubMed
    1. Bianchini G., Balko J. M., Mayer I. A., Sanders M. E., Gianni L., Triple-negative breast cancer: Challenges and opportunities of a heterogeneous disease. Nat. Rev. Clin. Oncol. 13, 674–690 (2016). - PMC - PubMed
    1. Nguyen D. X., Bos P. D., Massagué J., Metastasis: From dissemination to organ-specific colonization. Nat. Rev. Cancer 9, 274–284 (2009). - PubMed
    1. Massagué J., Obenauf A. C., Metastatic colonization by circulating tumour cells. Nature 529, 298–306 (2016). - PMC - PubMed

Publication types