

Ionic heat dissipation in solid-state pores
- PMID: 35148181
- PMCID: PMC8836805
- DOI: 10.1126/sciadv.abl7002
Ionic heat dissipation in solid-state pores
Abstract
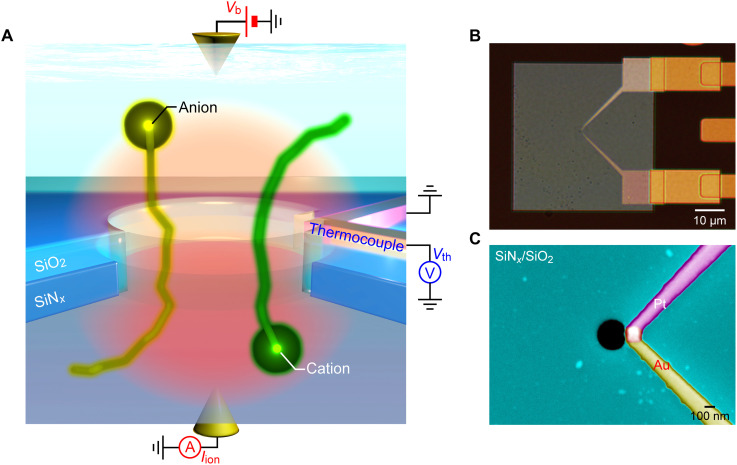
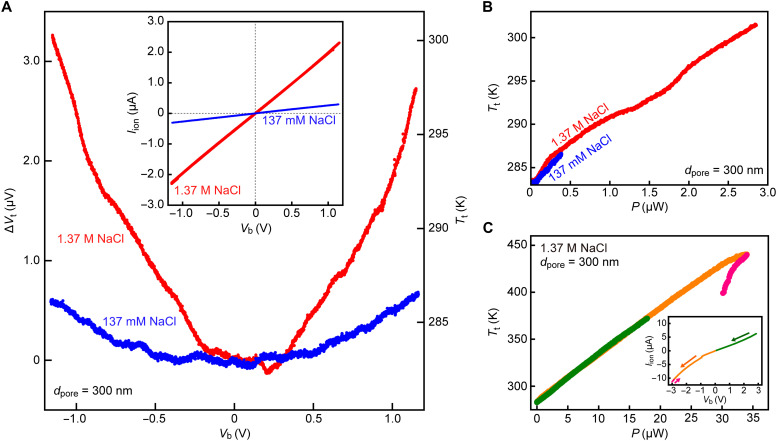
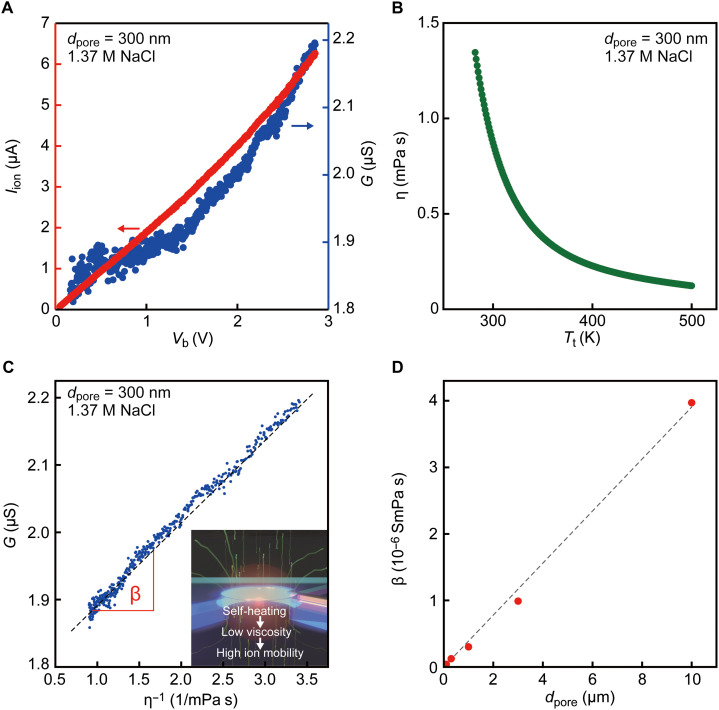
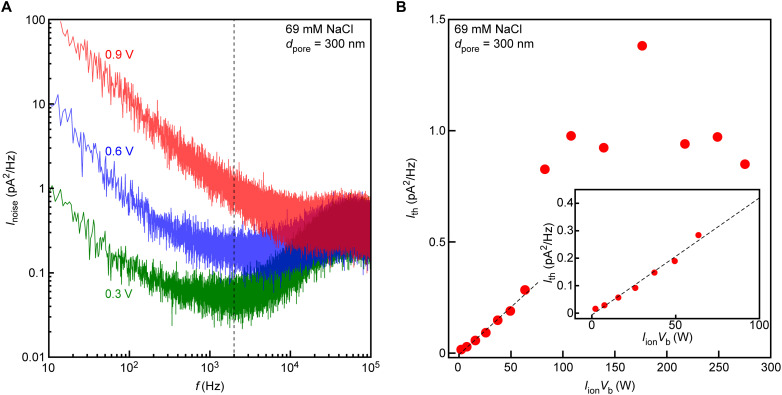
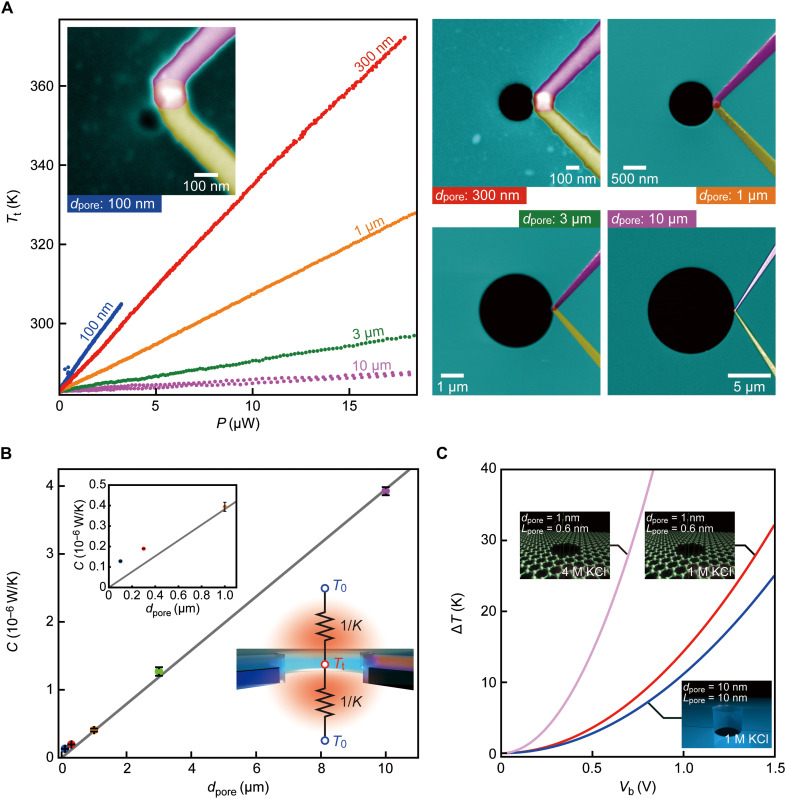
Energy dissipation in solid-state nanopores is an important issue for their use as a sensor for detecting and analyzing individual objects in electrolyte solution by ionic current measurements. Here, we report on evaluations of heating via diffusive ion transport in the nanoscale conduits using thermocouple-embedded SiNx pores. We found a linear rise in the nanopore temperature with the input electrical power suggestive of steady-state ionic heat dissipation in the confined nanospace. Meanwhile, the heating efficiency was elucidated to become higher in a smaller pore due to a rapid decrease in the through-water thermal conduction for cooling the fluidic channel. The scaling law suggested nonnegligible influence of the heating to raise the temperature of single-nanometer two-dimensional nanopores by a few kelvins under the standard cross-membrane voltage and ionic strength conditions. The present findings may be useful in advancing our understanding of ion and mass transport phenomena in nanopores.
Figures
Similar articles
-
Salt Gradient Control of Translocation Dynamics in a Solid-State Nanopore.Anal Chem. 2021 Dec 14;93(49):16700-16708. doi: 10.1021/acs.analchem.1c04342. Epub 2021 Dec 3. Anal Chem. 2021. PMID: 34860500
-
Nanotechnological selection.Nanotechnology. 2013 Jan 18;24(2):020201. doi: 10.1088/0957-4484/24/2/020201. Epub 2012 Dec 14. Nanotechnology. 2013. PMID: 23242125
-
Voltage-Rectified Current and Fluid Flow in Conical Nanopores.Acc Chem Res. 2016 Nov 15;49(11):2605-2613. doi: 10.1021/acs.accounts.6b00395. Epub 2016 Sep 30. Acc Chem Res. 2016. PMID: 27689816
-
Asymmetric ion transport through ion-channel-mimetic solid-state nanopores.Acc Chem Res. 2013 Dec 17;46(12):2834-46. doi: 10.1021/ar400024p. Epub 2013 May 28. Acc Chem Res. 2013. PMID: 23713693 Review.
-
Self-assembling organic nanotubes with precisely defined, sub-nanometer pores: formation and mass transport characteristics.Acc Chem Res. 2013 Dec 17;46(12):2856-66. doi: 10.1021/ar400030e. Epub 2013 Apr 18. Acc Chem Res. 2013. PMID: 23597055 Review.
Cited by
-
The Electric Field in Solid State Nanopores Causes Dissociation of Strong Biomolecular Interactions.Nano Lett. 2025 Jun 18;25(24):9654-9661. doi: 10.1021/acs.nanolett.5c01447. Epub 2025 May 19. Nano Lett. 2025. PMID: 40389804 Free PMC article.
-
Promoting in-situ stability of hydroxide exchange membranes by thermally conductive network for durable water electrolysis.Nat Commun. 2025 Jan 22;16(1):934. doi: 10.1038/s41467-025-56262-6. Nat Commun. 2025. PMID: 39843436 Free PMC article.
-
Transmembrane voltage-gated nanopores controlled by electrically tunable in-pore chemistry.Nat Commun. 2025 Feb 5;16(1):1089. doi: 10.1038/s41467-025-56052-0. Nat Commun. 2025. PMID: 39910030 Free PMC article.
References
-
- Li J., McMullan C., Branton D., Aziz M. J., Golovchenko J. A., Ion-beam sculpting at nanometre length scales. Nature 412, 166–169 (2001). - PubMed
-
- Dekker C., Solid-state nanopores. Nat. Nanotechnol. 2, 209–215 (2007). - PubMed
-
- Branton D., Deamer D. W., Marziali A., Bayley H., Benner S. A., Bulter T., Di Ventra M., Garaj S., Hibbs A., Huang X., Jovanovich S. B., Krstic P. S., Lindsay S., Ling X. S., Mastrangelo C. H., Meller A., Oliver J. S., Pershin Y. V., Ramsey J. M., Riehn R., Soni G. V., Tabard-Cossa V., Wanunu M., Wiggin M., Schloss J. A., The potential and challenges of nanopore sequencing. Nat. Biotechnol. 26, 1146–1153 (2008). - PMC - PubMed
-
- Drndic M., Sequencing with graphene pores. Nat. Nanotechnol. 9, 743 (2014). - PubMed
LinkOut - more resources
Full Text Sources
