. 2022 Feb 11;7(68):eabf2846.
doi: 10.1126/sciimmunol.abf2846. Epub 2022 Feb 11.

SLAMF7 engagement superactivates macrophages in acute and chronic inflammation

Affiliations

SLAMF7 engagement superactivates macrophages in acute and chronic inflammation

Daimon P Simmons et al. Sci Immunol. .

Abstract

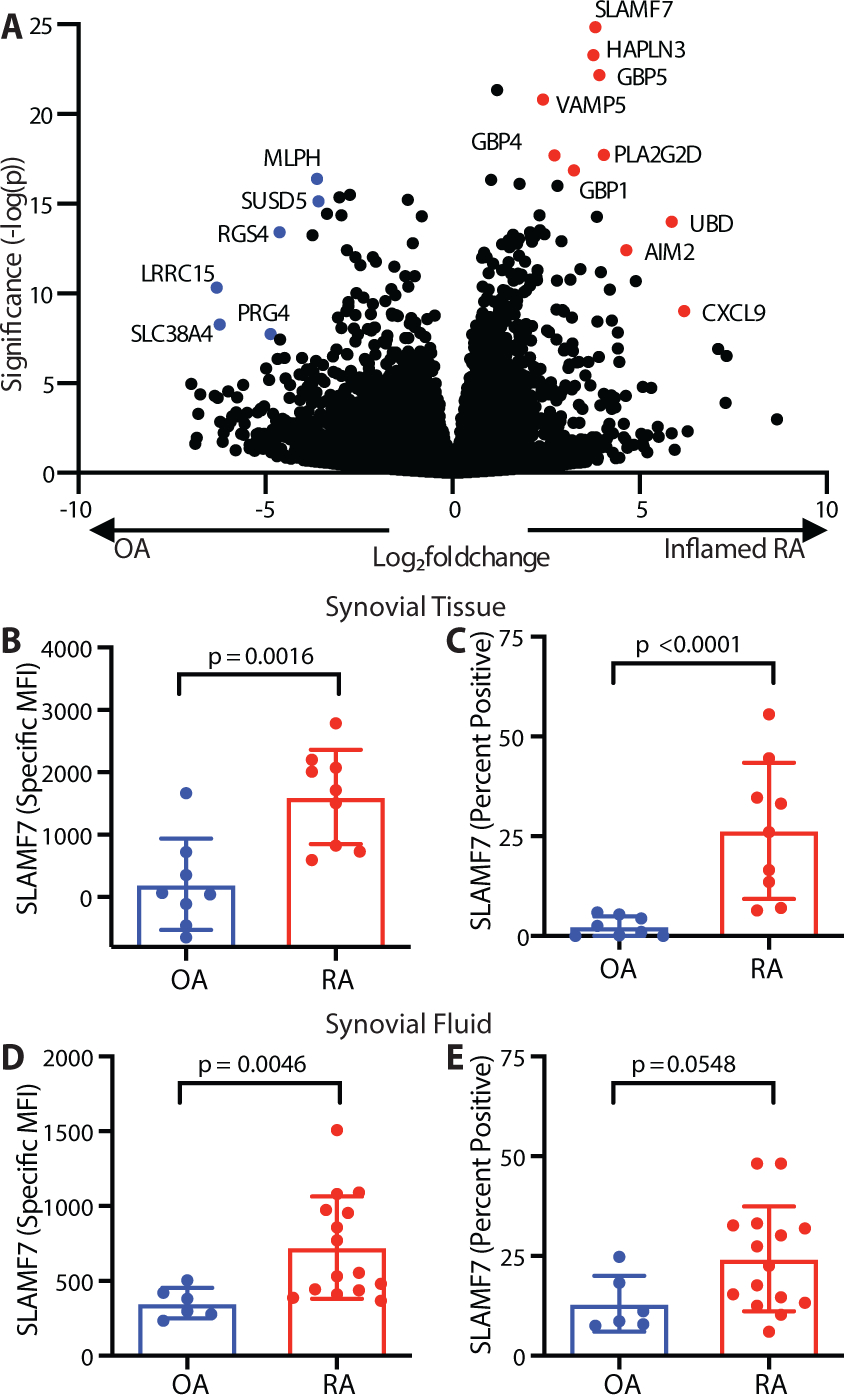
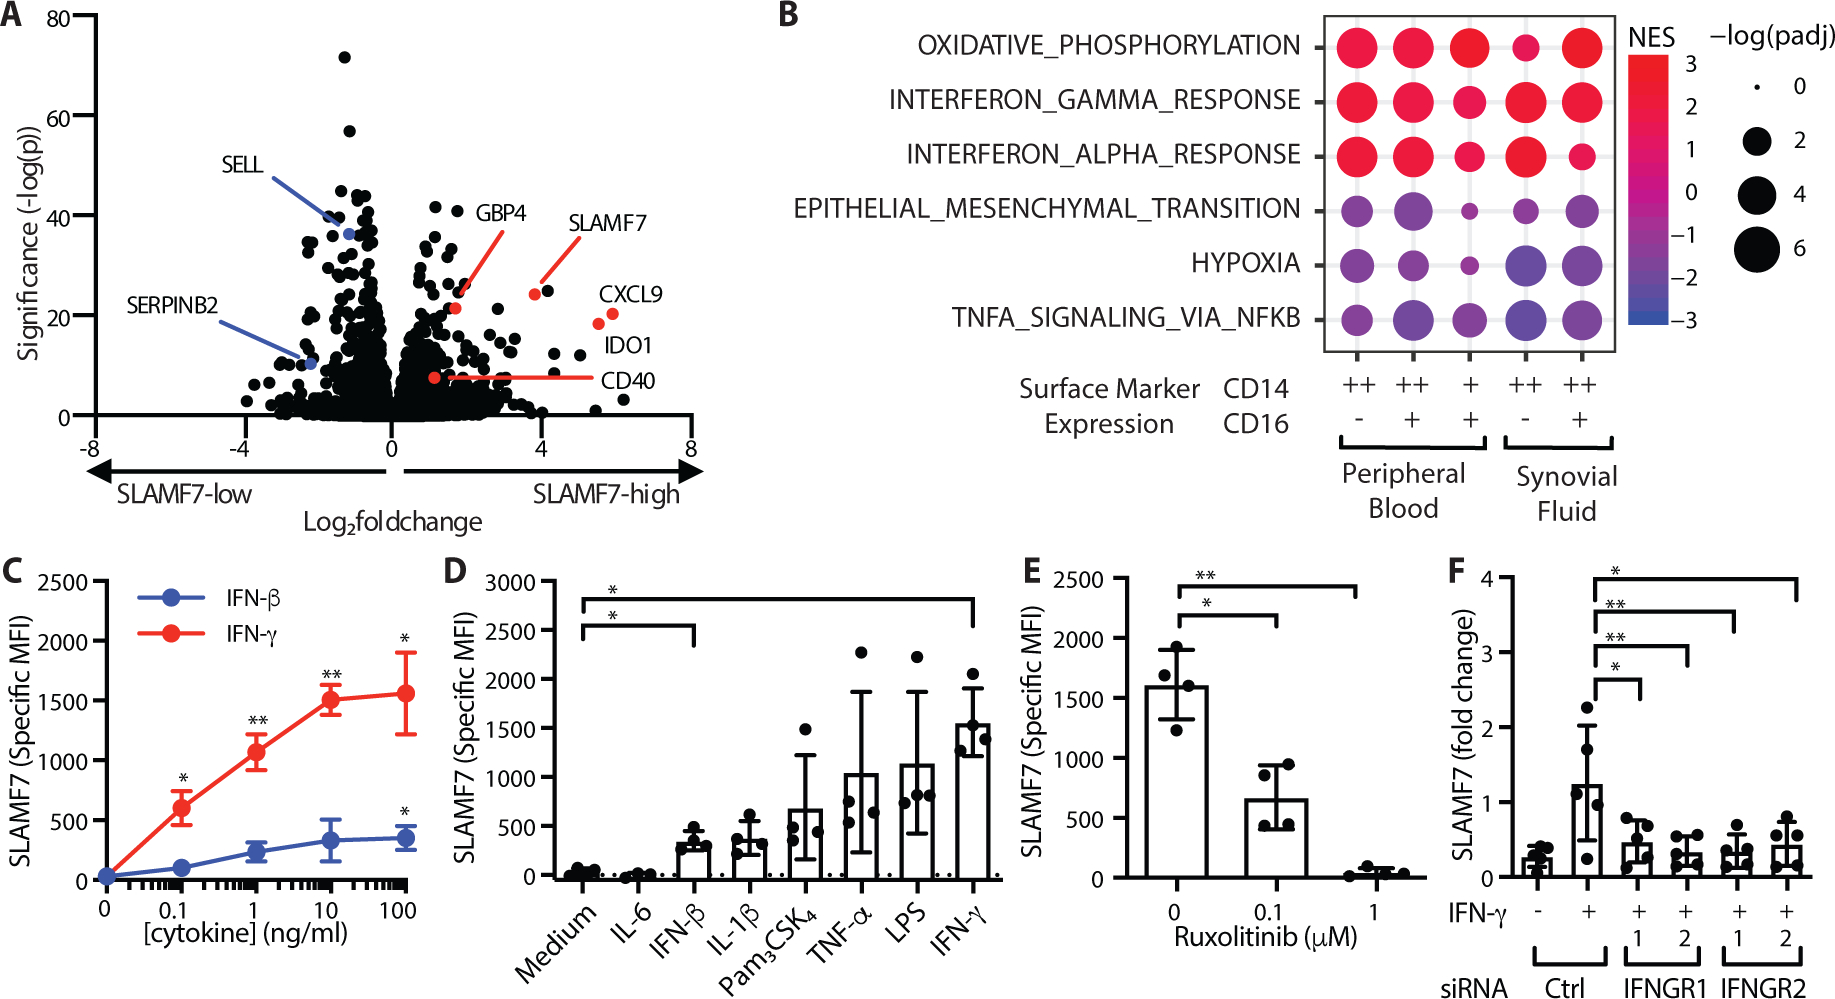
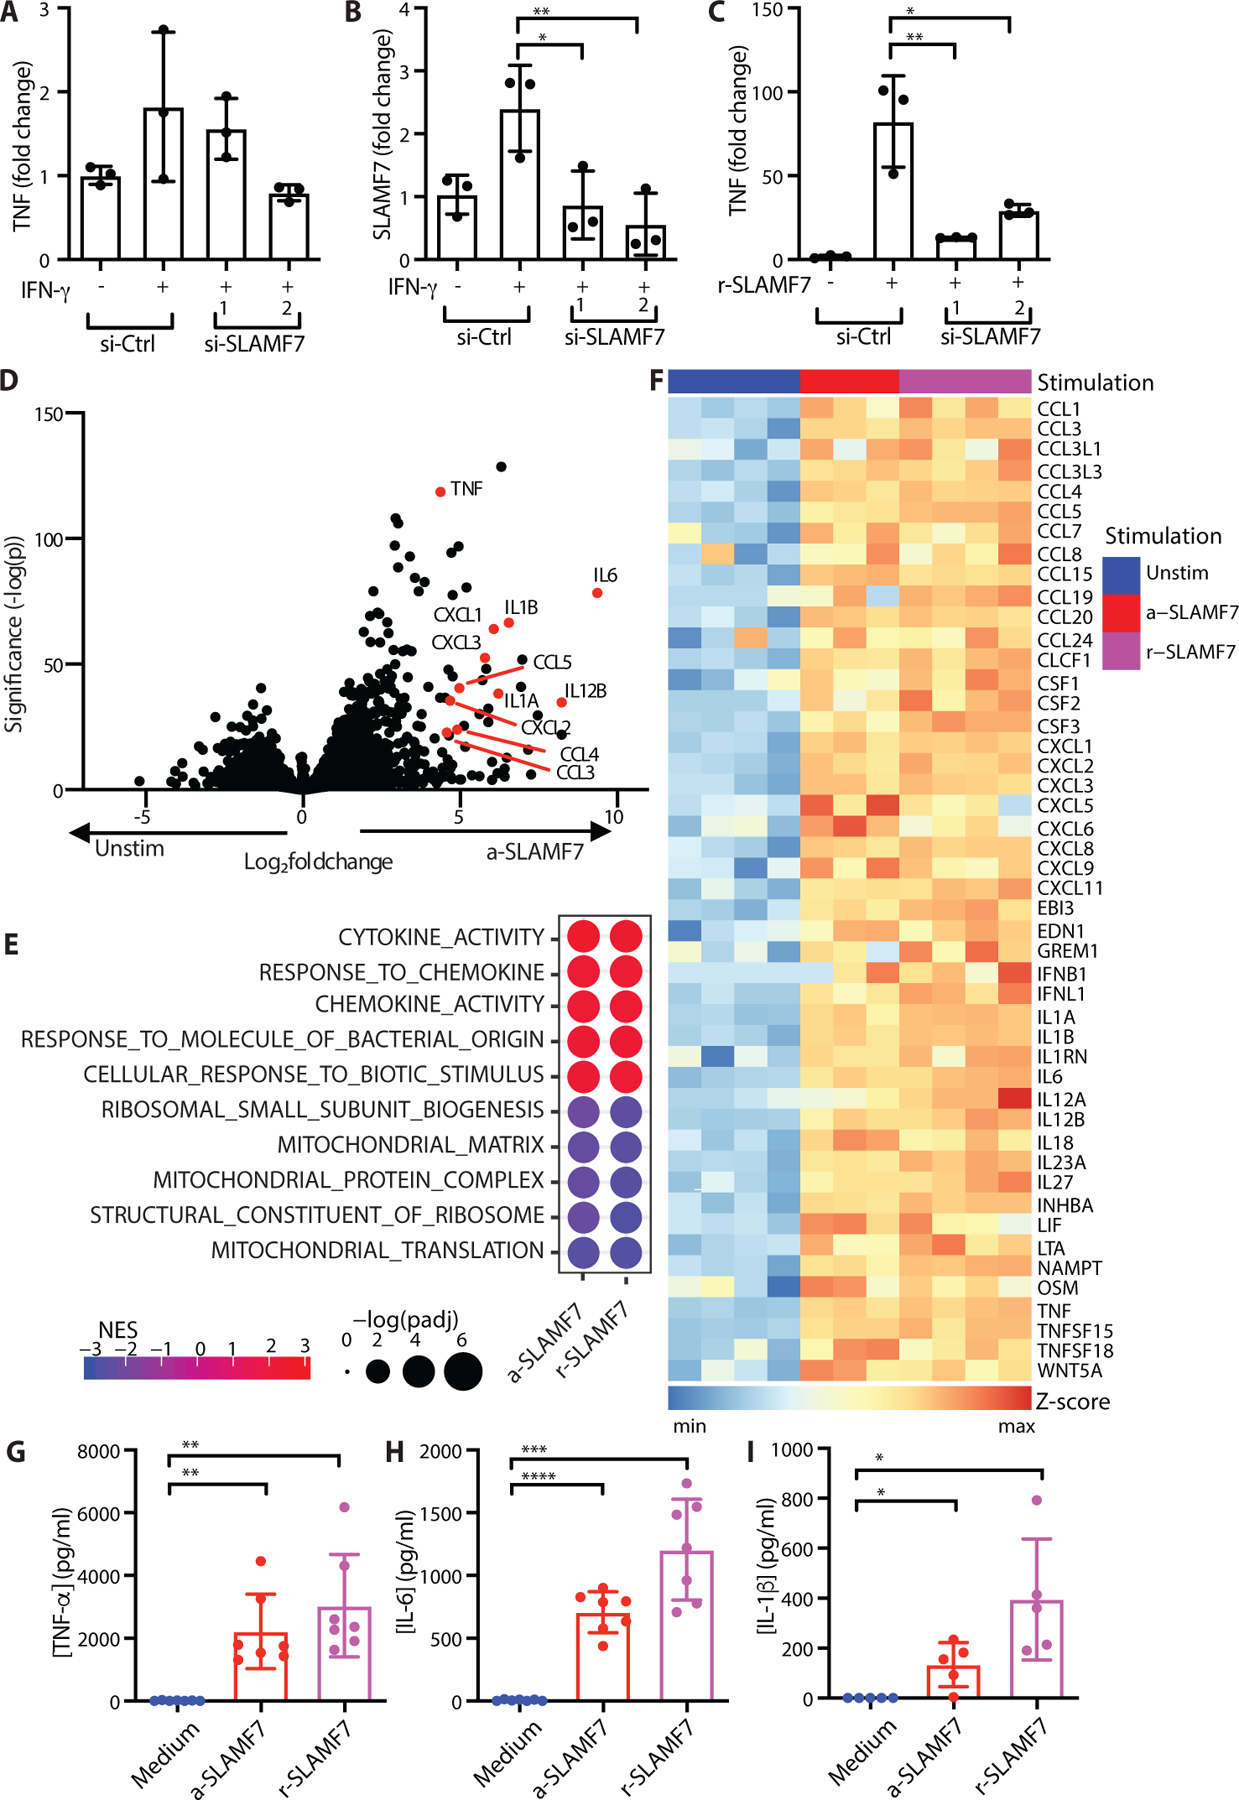
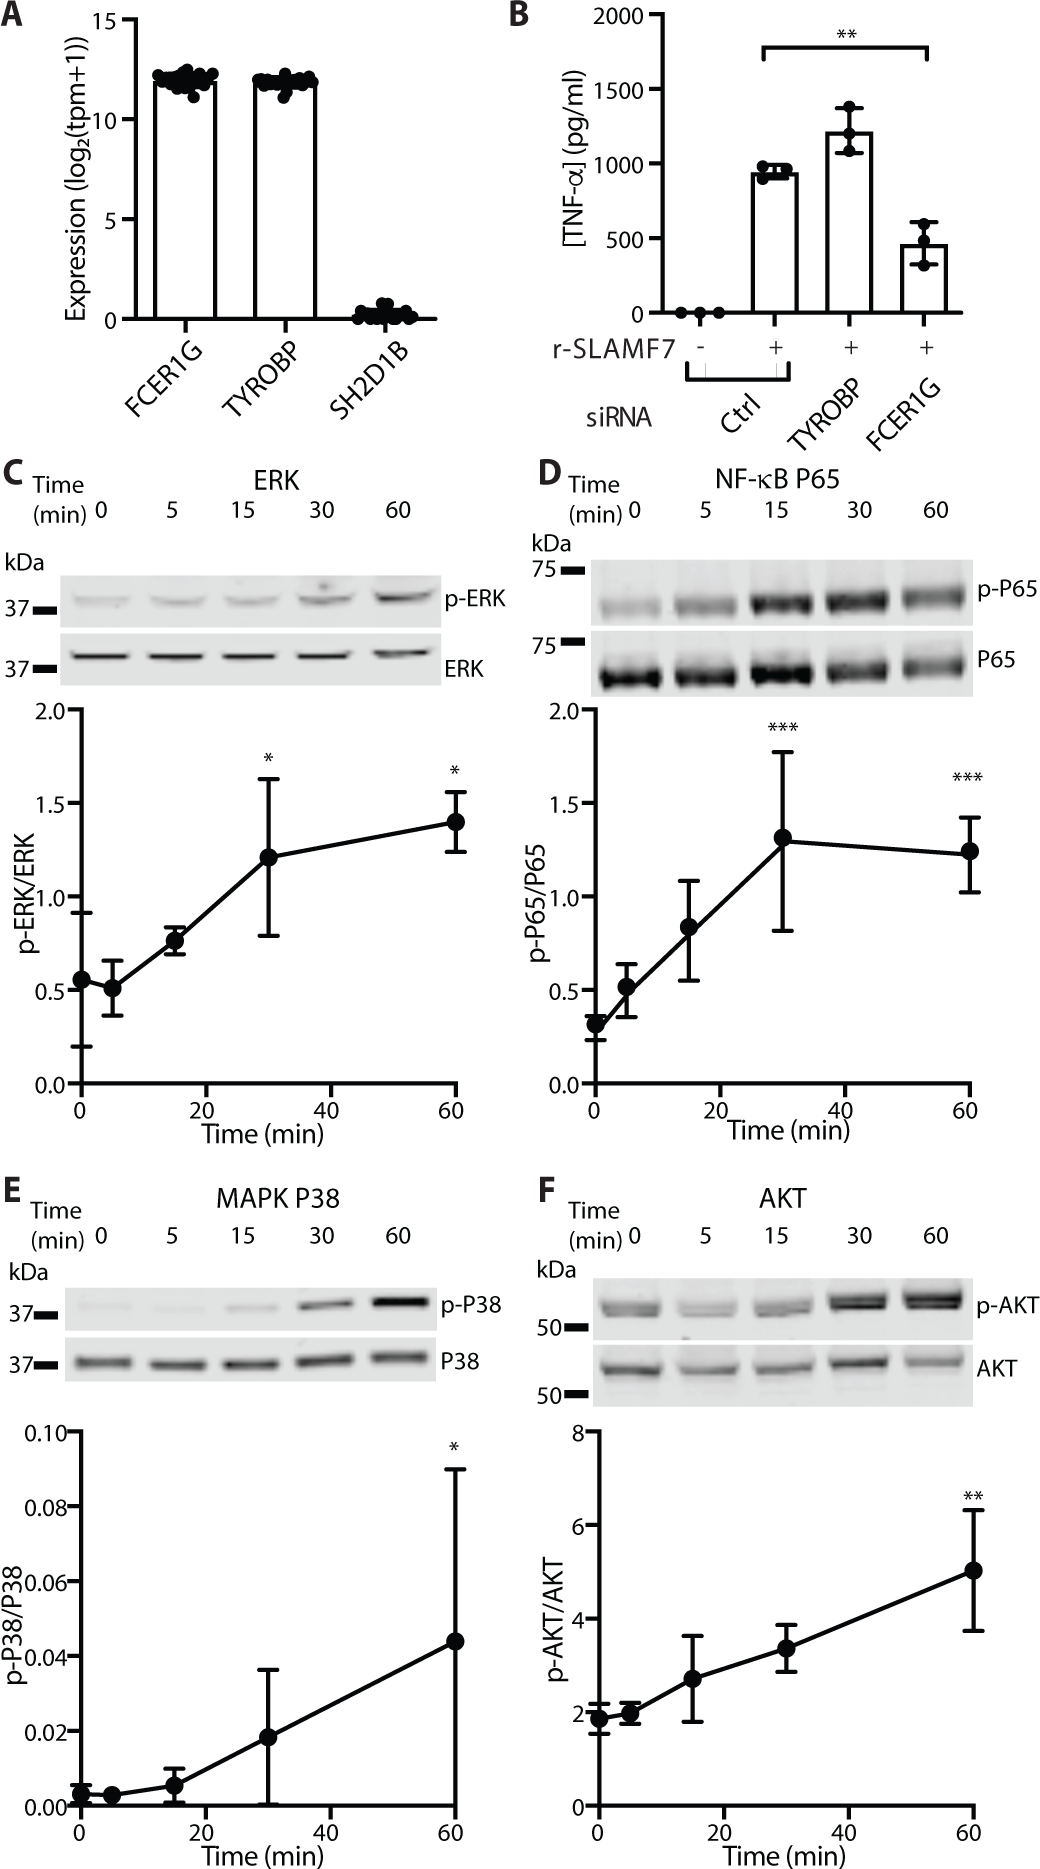
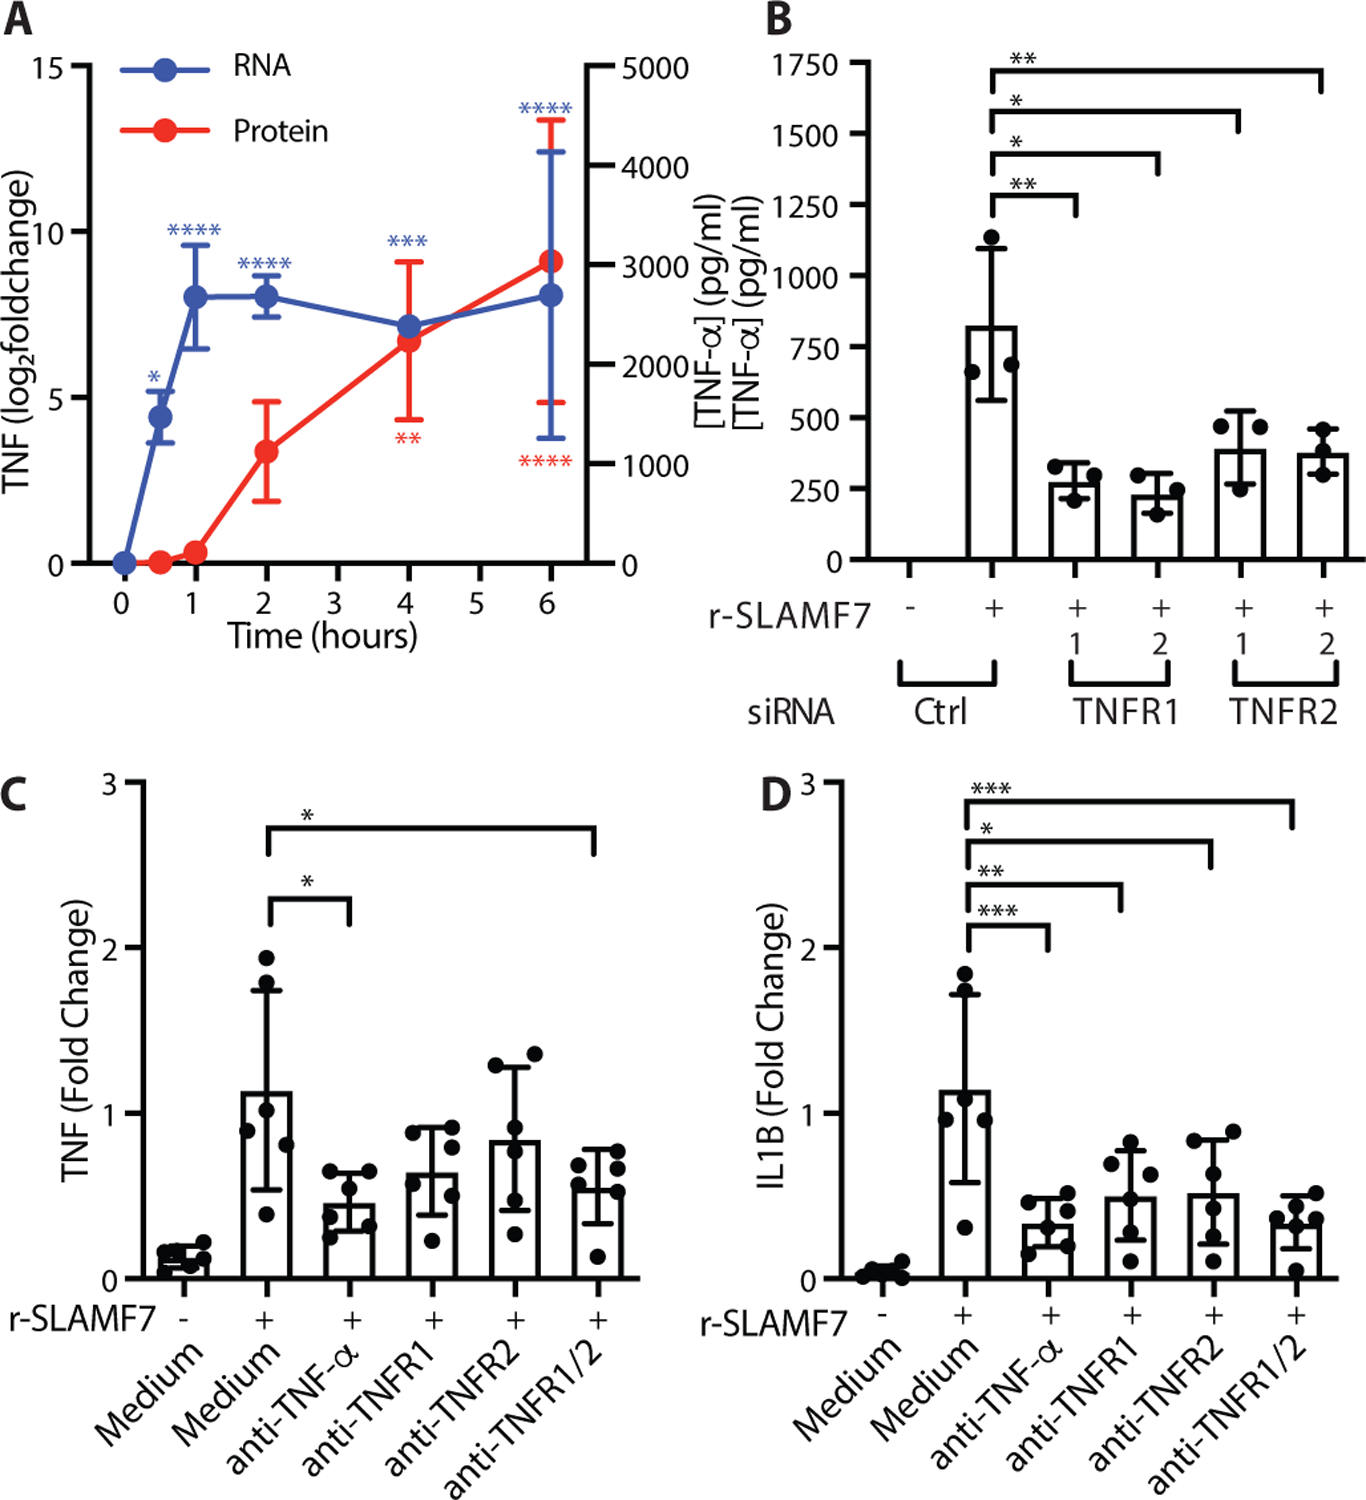
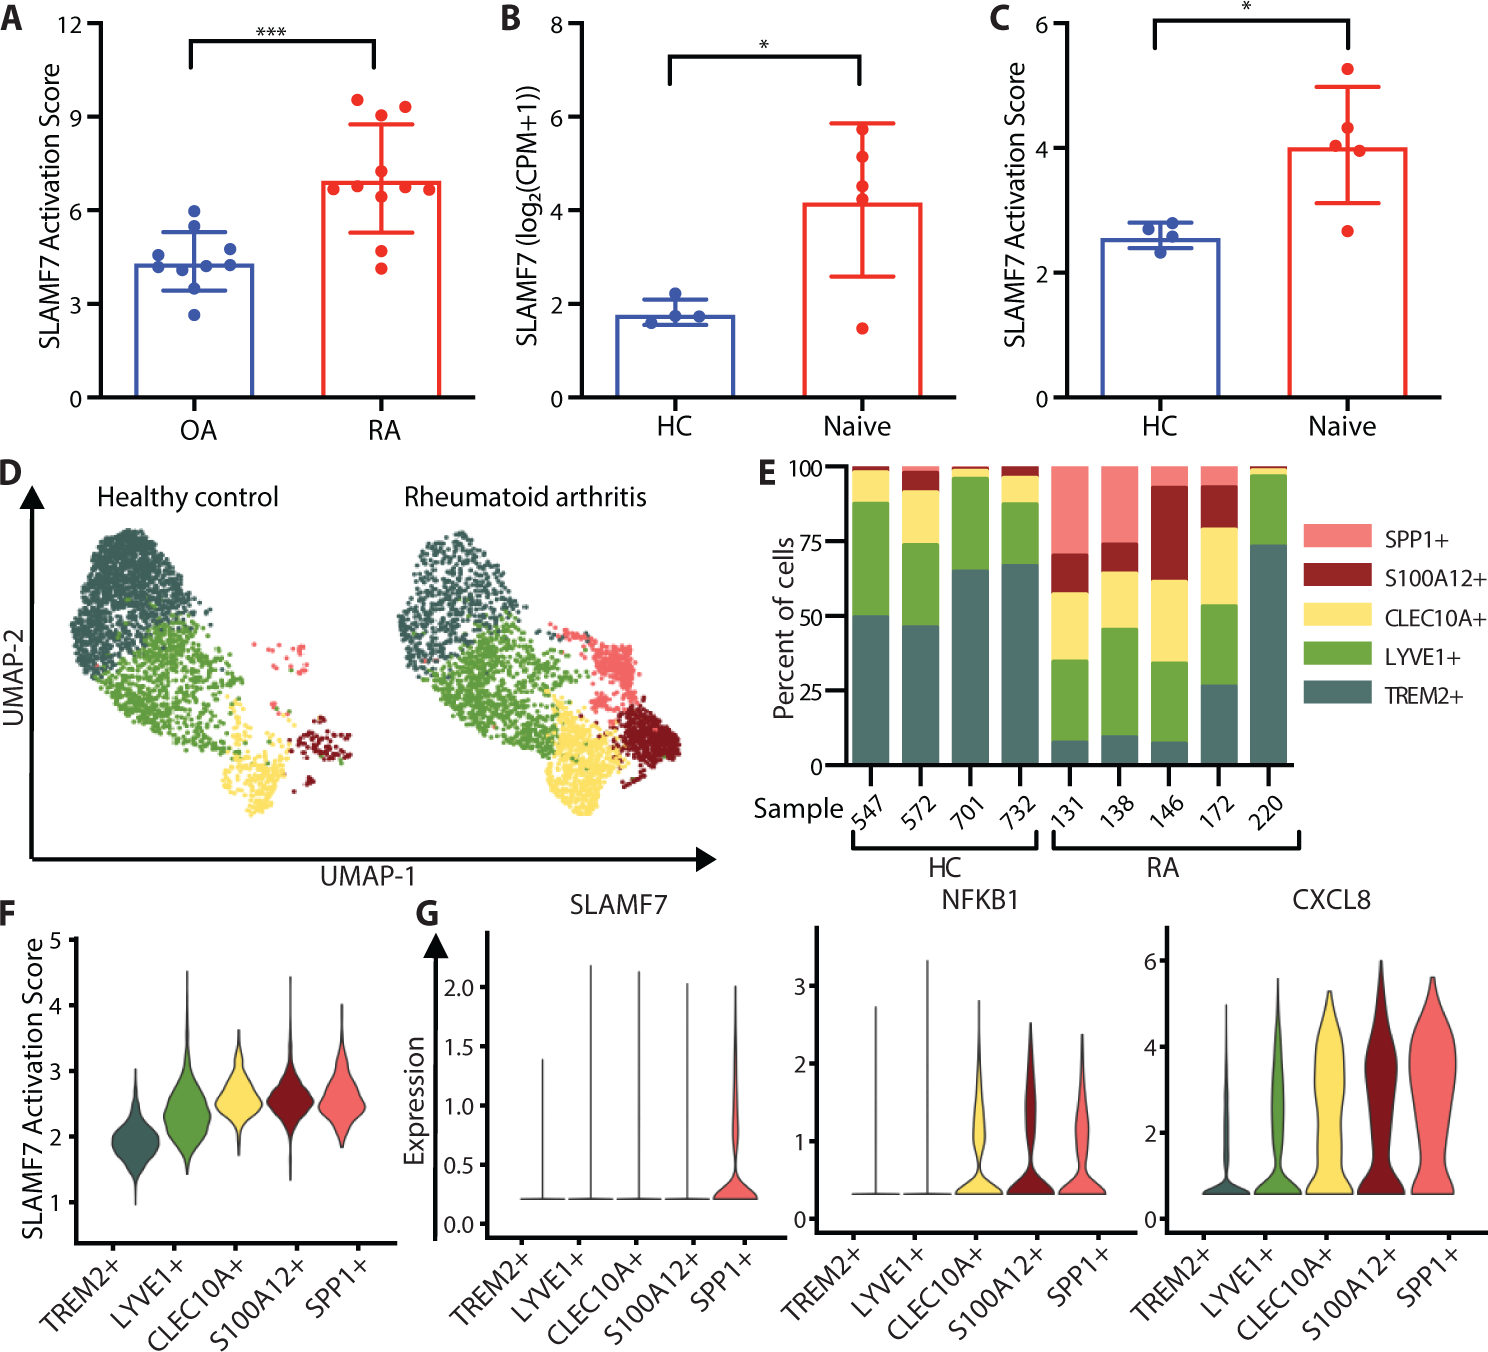
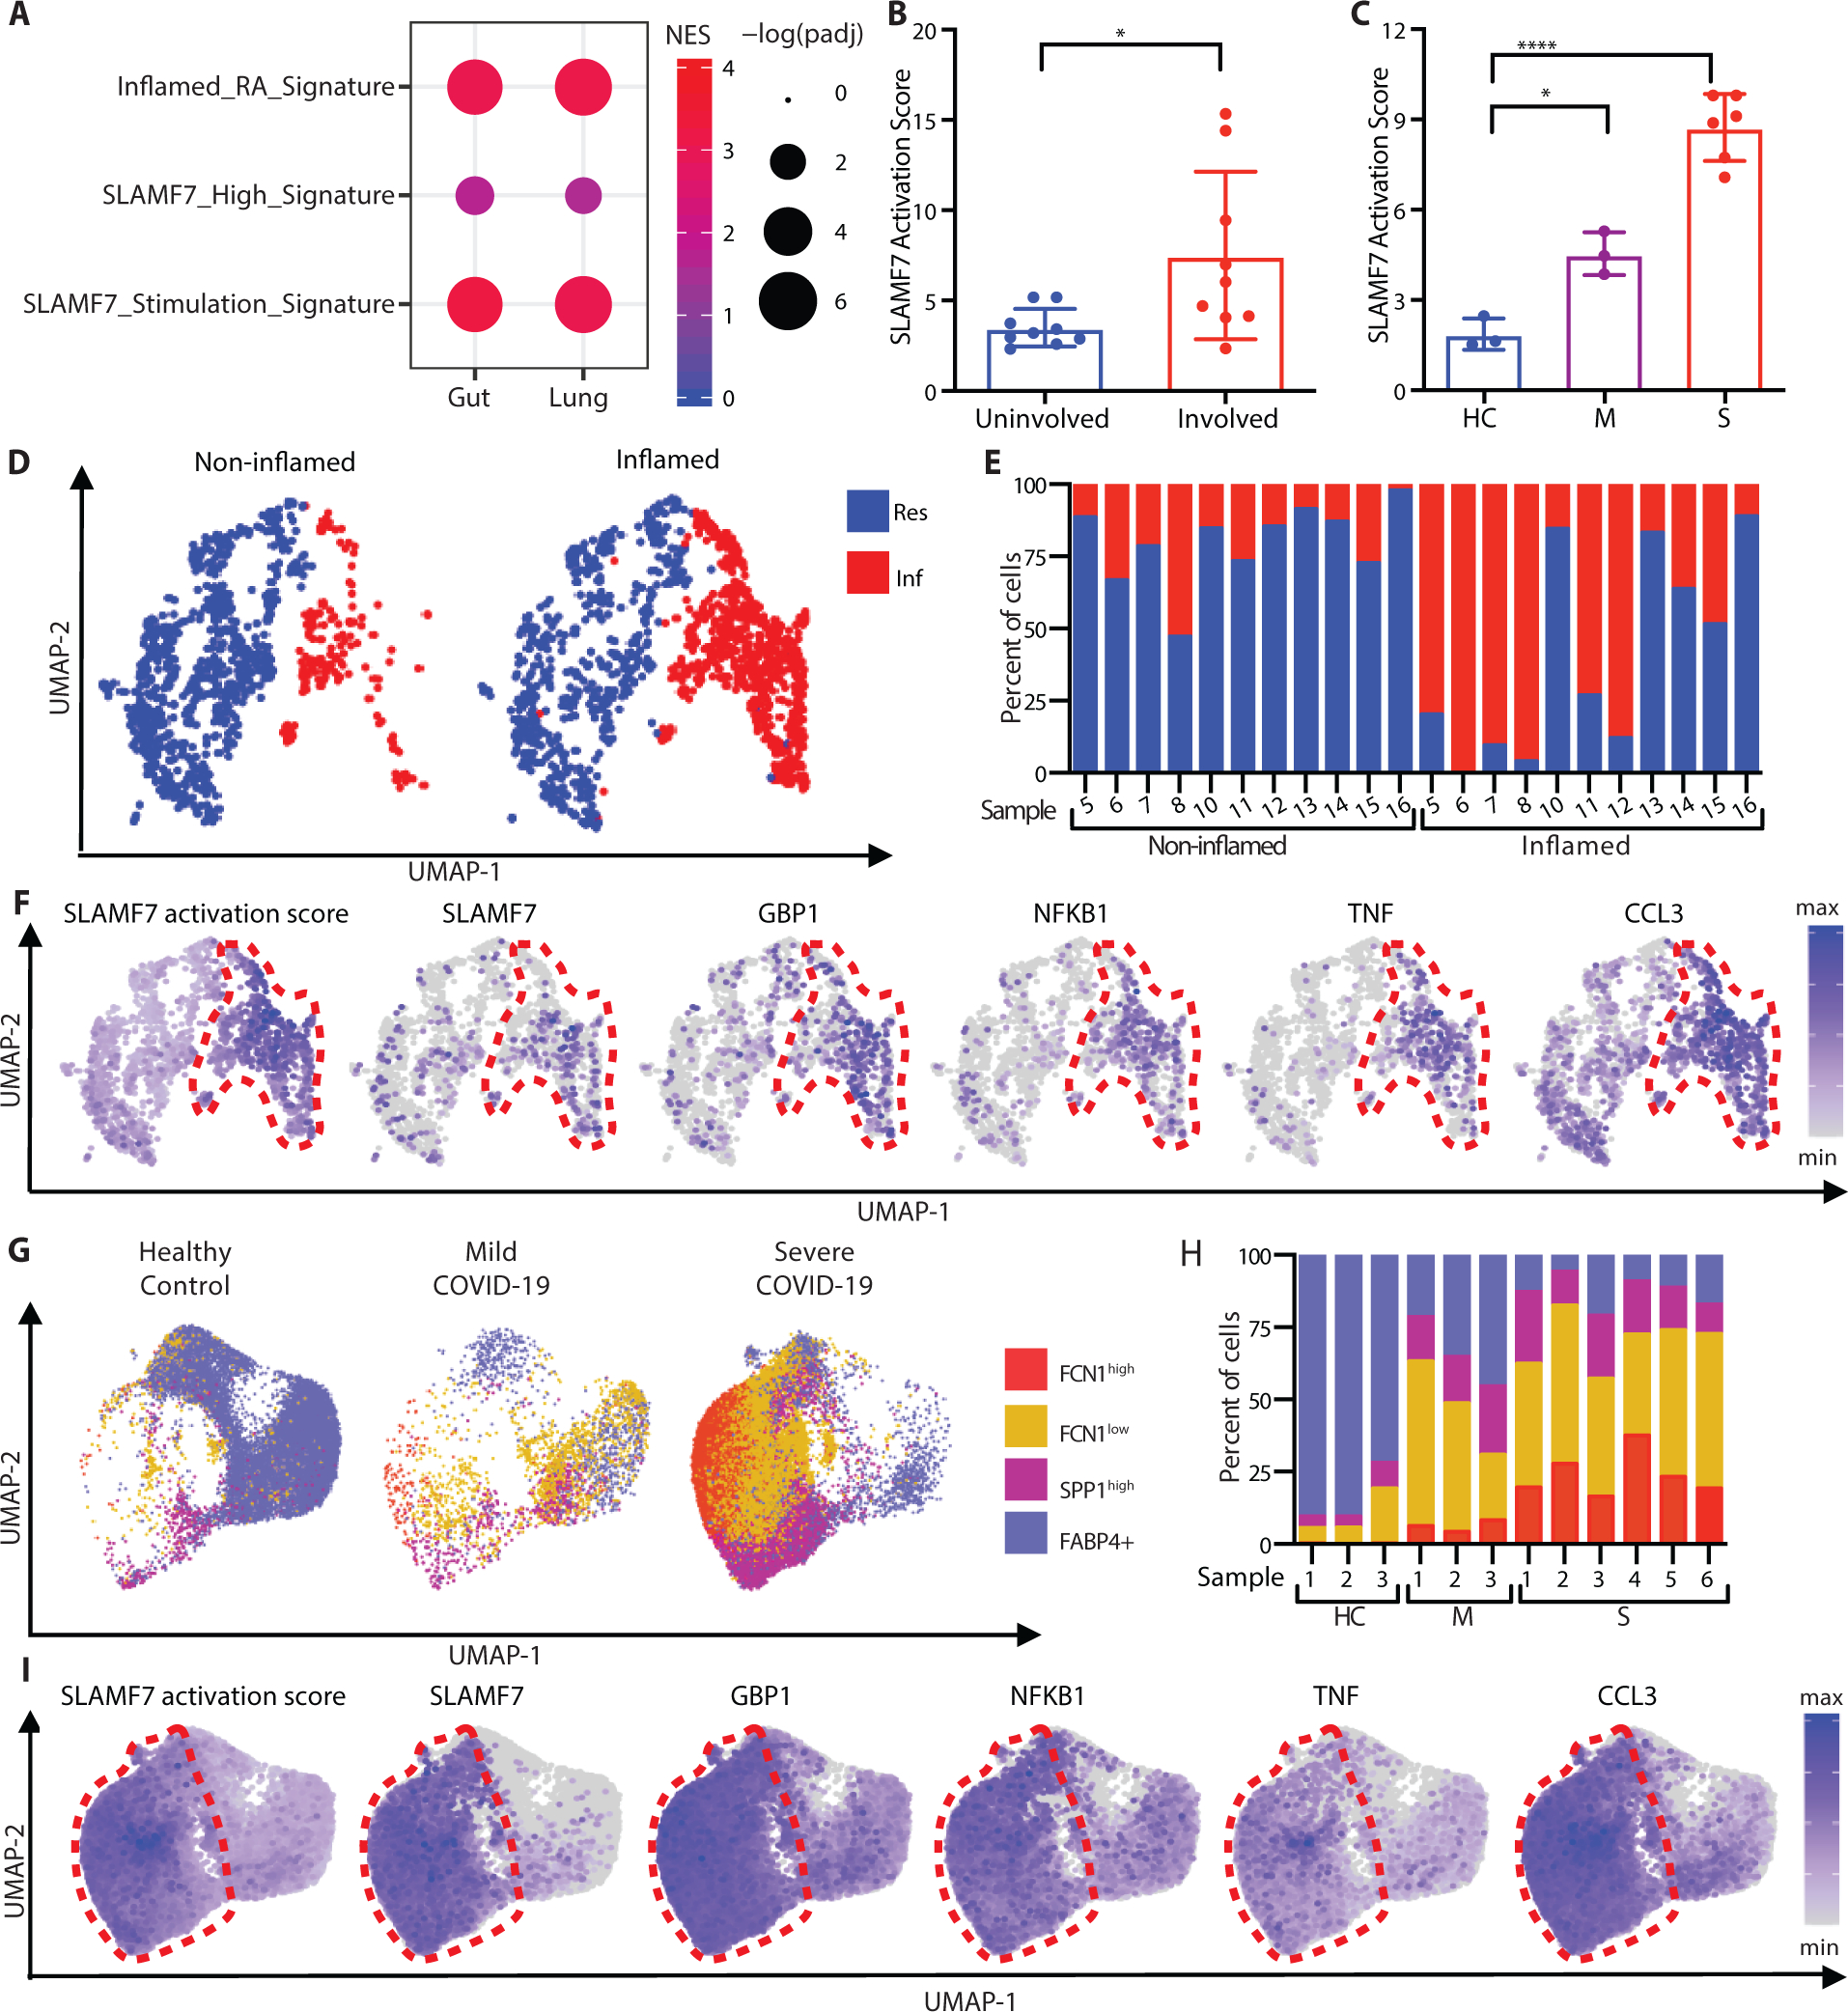
Macrophages regulate protective immune responses to infectious microbes, but aberrant macrophage activation frequently drives pathological inflammation. To identify regulators of vigorous macrophage activation, we analyzed RNA-seq data from synovial macrophages and identified SLAMF7 as a receptor associated with a superactivated macrophage state in rheumatoid arthritis. We implicated IFN-γ as a key regulator of SLAMF7 expression and engaging SLAMF7 drove a strong wave of inflammatory cytokine expression. Induction of TNF-α after SLAMF7 engagement amplified inflammation through an autocrine signaling loop. We observed SLAMF7-induced gene programs not only in macrophages from rheumatoid arthritis patients but also in gut macrophages from patients with active Crohn's disease and in lung macrophages from patients with severe COVID-19. This suggests a central role for SLAMF7 in macrophage superactivation with broad implications in human disease pathology.


Conflict of interest statement

Competing interests: Authors declare no competing interests.

Figures

Figure 1.
Figure 1.. Marked upregulation of SLAMF7 on macrophages from inflamed synovial tissue.
A) Differential gene expression in bulk RNA-seq of synovial tissue macrophages from patients with inflamed RA (n=11) compared to OA (n=10) (15). B) Specific MFI for SLAMF7 and C) percent of macrophages expressing SLAMF7 in synovial tissue from patients with OA (n=8) or RA (n=9). D) Specific MFI for SLAMF7 and E) percent of macrophages expressing SLAMF7 in synovial fluid from patients with OA (n=6) or RA (n=15). Data represent mean ± SD. The Mann-Whitney test was used for statistical comparisons. OA, osteoarthritis; RA, rheumatoid arthritis.
Figure 2.
Figure 2.. SLAMF7 is a key feature of IFN-γ potentiated macrophages.
A) Differential gene expression in SLAMF7-high versus SLAMF7-low CD14+CD16- cells from peripheral blood (n=12). B) Gene set enrichment analysis for Hallmark Pathways in SLAMF7-high compared to SLAMF7-low myeloid populations from synovial fluid and peripheral blood. C) Specific MFI for SLAMF7 on macrophages incubated with different doses of IFN-γ or IFN-β. D) Specific MFI for SLAMF7 on macrophages incubated with 100 ng/ml of cytokines or TLR agonists. IFN-β and IFN-γ results are the same as the 100 ng/ml dose in panel C. E) Macrophages were incubated with ruxolitinib or DMSO prior to IFN-γ treatment (10 ng/ml), and the specific MFI for SLAMF7 was measured after 16h. Data in C-E represent mean ± SD of 4 donors. F) Macrophages were treated with a siRNA control or siRNA targeting IFNGR1 or IFNGR2, then potentiated with IFN-γ (5–10 ng/ml) for 24h. SLAMF7 was quantified relative to macrophages treated with control siRNA only. Data represent mean ± SD of 5 donors. Statistics were calculated using the one-way ANOVA with Dunnett’s multiple comparisons test. NES, normalized expression score; Ctrl, control; *, p ≤ 0.05; ** p ≤ 0.01.
Figure 3.
Figure 3.. Engagement of SLAMF7 triggers an inflammatory program.
A-C) Macrophages were treated with siRNA control or siRNA targeting SLAMF7. They were then potentiated with IFN-γ (10 ng/ml) for 24 hours. A) TNF or B) SLAMF7 expression was quantified relative to macrophages treated with control siRNA only by RT-PCR. C) After potentiation with IFN-γ, macrophages were stimulated with r-SLAMF7 (100 ng/ml) for 2.5h, and TNF was quantified relative to macrophages treated with control siRNA and IFN-γ only by RT-PCR. Data represent mean ± SD of triplicate samples in an experiment representative of at least 2 independent experiments. D-I) Macrophages were potentiated with IFN-γ (10 ng/ml) for 24 hours prior to treatment with a-SLAMF7 (10 μg/ml) or r-SLAMF7 (1 μg/ml) for 4h. D) Differential gene expression for macrophages incubated with a-SLAMF7 (n=3 donors) compared to macrophages treated with only IFN-γ (n=4 donors). E) Gene set enrichment analysis for macrophages after stimulation with a-SLAMF7 or r-SLAMF7 showing the top and bottom 5 GO categories for macrophages after SLAMF7 engagement. F) Heatmap showing z-scores for gene expression values of differentially expressed genes in the msigdb GO:cytokine activity gene set for IFN-γ pre-treated macrophages without additional stimulation (n=4 donors), stimulated with a-SLAMF7 (n=3 donors), or with r-SLAMF7 (n=4 donors). G) Secreted TNF-α, and H) secreted IL-6 after macrophage incubation with a-SLAMF7 or r-SLAMF7 (n=7 donors). I) Release of IL-1β after macrophage incubation with a-SLAMF7 or r-SLAMF7 for 4h followed by treatment with nigericin (10 μM) for 30m (n=5 donors). Data represent mean ± SD. Statistics were calculated with the one-way ANOVA, using Dunnett’s multiple comparisons test. Unstim, unstimulated; a-SLAMF7, anti-SLAMF7 antibody; r-SLAMF7, recombinant SLAMF7 protein; si-Ctrl, control siRNA; si-SLAMF7, siRNA against SLAMF7; NES, normalized expression score; *, p ≤ 0.05; **, p ≤ 0.01; ***, p ≤ 0.001; ****, p ≤ 0.0001.
Figure 4.
Figure 4.. SLAMF7 engagement drives an inflammatory signaling cascade.
A) Gene expression in bulk RNA-seq of synovial tissue macrophages from patients with arthritis from AMP (n=21 donors) (15). B) Macrophages were treated with siRNA control, or siRNA targeting TYROBP or FCER1G. Cells were potentiated with IFN-γ (5 ng/ml) for 24 hours, then stimulated with r-SLAMF7 (100 ng/ml) for 4 hours. Secreted TNF-α was measured by ELISA. Data represent mean ± SD of triplicate wells from an experiment representative of at least 2 independent experiments. C-F) Macrophages were potentiated with IFN-γ (10 ng/ml) for 24h, then stimulated with r-SLAMF7 (100 ng/ml) for the times indicated. Representative Western blots and densitometry quantification for C) ERK and phospho-ERK, D) P65 and phospho-P65, E) MAPK P38 and phospho-MAPK P38, and F) AKT and phospho-AKT. Data represent mean ± SD of at least 3 donors. Statistics were calculated using the one-way ANOVA with Dunnett’s multiple comparisons test. *, p ≤ 0.05; **, p ≤ 0.01; r-SLAMF7, recombinant SLAMF7 protein; tpm, transcripts per million.
Figure 5.
Figure 5.. SLAMF7 amplifies macrophage activation through a TNF-α autocrine loop.
A) Macrophages were potentiated with IFN-γ (10 ng/ml) for 24h, then stimulated with r-SLAMF7 (500 ng/ml). TNF RNA was measured at each time point relative to unstimulated cells (blue) by RT-PCR and secreted TNF-α protein was measured by ELISA (red). Data represent mean ± SD of four donors. B) Macrophages were treated with siRNA control or siRNA targeting TNFR1 (TNFRSF1A) or TNFR2 (TNFRSF1B), potentiated with IFN-γ (5 ng/ml) for 16–18h, and stimulated with r-SLAMF7 (100 ng/ml) for 3h. TNF-α was measured by ELISA. Data represent mean ± SD of triplicate wells from an experiment representative of at least 3 independent experiments. C-D) Macrophages were potentiated with IFN-γ (10 ng/ml) for 24h, treated with antibodies for 30m, and stimulated with r-SLAMF7 (100 ng/ml) for 8h. RT-PCR was used to quantify C) TNF and D) IL1B relative to macrophages without antibody pre-treatment. Data represent mean ± SD of 6 donors. Statistics were calculated using the one-way ANOVA with Dunnett’s multiple comparisons test. *, p ≤ 0.05; **, p ≤ 0.01; ***, p ≤ 0.001; ****, p ≤ 0.0001; r-SLAMF7, recombinant SLAMF7 protein.
Figure 6.
Figure 6.. SLAMF7 super-activated macrophages drive inflammation in rheumatoid arthritis.
A) SLAMF7 activation score for bulk RNA-seq data on synovial macrophages from patients with OA (n=10) or RA (n=11) (15). B) SLAMF7 expression and C) SLAMF7 activation score for pseudobulk RNA-seq data for synovial macrophages from healthy controls (n=4) or untreated RA patients (n=5) (18). Data in A-C represent mean ± SD. D) UMAP plot of macrophage clusters from synovial tissues of healthy controls or patients with untreated RA. E) Percent of macrophages from each donor assigned to each cluster. F) Violin plot showing the SLAMF7 Activation Score in different macrophage populations. G) Violin plots showing gene expression of synovial macrophage populations. The t-test was used for statistical comparisons. OA, osteoarthritis; RA, rheumatoid arthritis; HC, healthy control; Naive, untreated treatment-naive rheumatoid arthritis; CPM, counts per million; *, p ≤ 0.05; ***, p ≤ 0.001.
Figure 7.
Figure 7.. SLAMF7 super-activated macrophages drive inflammation in inflammatory bowel disease and COVID-19 infection.
A) Gene set enrichment analysis comparing gene expression from macrophages from inflamed ileal tissues in patients with Crohn’s disease or lungs of patients with severe COVID-19 with the “Inflamed RA Macrophage Signature”, the “SLAMF7-High Macrophage Signature” and the “Macrophage SLAMF7 Stimulation Signature.” B) SLAMF7 activation score for macrophages from non-inflamed (n=9) and inflamed ileal tissues (n=9) (8). C) SLAMF7 activation score for bronchoalveolar lavage macrophages from healthy controls (n=3), or individuals with mild (n=3) or severe COVID-19 (n=6) (20). Data in B-C represent mean ± SD. D) UMAP plot of macrophage clusters from involved and uninvolved ileal tissues. E) Percent of macrophages from each donor assigned to each cluster. F) UMAP plots showing gene expression of ileal macrophage populations. G) UMAP plot of bronchoalveolar lavage macrophage populations. H) Percent of macrophages from each donor assigned to each population. I) UMAP plots showing gene expression for bronchoalveolar lavage macrophage populations. The paired t-test was used to compare inflamed and non-inflamed gut tissues, and the one-way ANOVA with Dunnett’s multiple comparisons test was used to compare mild and severe COVID-19 to healthy controls. NES, normalized expression score; Res, Resident macrophage cluster; Inf, Inflammatory macrophage cluster; HC, healthy control; M, mild COVID-19; S, severe COVID-19; *, p ≤ 0.05; **, p ≤ 0.01; ****, p < 0.0001.

References

    1. Shi C, Pamer EG, Monocyte recruitment during infection and inflammation. Nature reviews. Immunology. 11, 762–74 (2011). - PMC - PubMed
    1. Nathan C, Ding A, Nonresolving Inflammation. Cell. 140 (2010), pp. 871–882. - PubMed
    1. Mulherin D, Fitzgerald O, Bresnihan B, Synovial tissue macrophage populations and articular damage in rheumatoid arthritis. Arthritis and rheumatism. 39, 115–24 (1996). - PubMed
    1. Misharin A. v, Cuda CM, Saber R, Turner JD, Gierut AK, Haines GK, Berdnikovs S, Filer A, Clark AR, Buckley CD, Mutlu GM, Budinger GRS, Perlman H, Nonclassical Ly6C(−) monocytes drive the development of inflammatory arthritis in mice. Cell reports. 9, 591–604 (2014). - PMC - PubMed
    1. Smiljanovic B, Grützkau A, Sörensen T, Grün JR, Vogl T, Bonin M, Schendel P, Stuhlmüller B, Claussnitzer A, Hermann S, Ohrndorf S, Aupperle K, Backhaus M, Radbruch A, Burmester GR, Häupl T, Synovial tissue transcriptomes of long-standing rheumatoid arthritis are dominated by activated macrophages that reflect microbial stimulation. Scientific reports. 10, 7907 (2020). - PMC - PubMed

Publication types

MeSH terms

Substances