. 2022 Feb 11;18(2):e1009805.
doi: 10.1371/journal.pcbi.1009805. eCollection 2022 Feb.

A computationally tractable birth-death model that combines phylogenetic and epidemiological data

Affiliations

A computationally tractable birth-death model that combines phylogenetic and epidemiological data

Alexander Eugene Zarebski et al. PLoS Comput Biol. .

Abstract

Inferring the dynamics of pathogen transmission during an outbreak is an important problem in infectious disease epidemiology. In mathematical epidemiology, estimates are often informed by time series of confirmed cases, while in phylodynamics genetic sequences of the pathogen, sampled through time, are the primary data source. Each type of data provides different, and potentially complementary, insight. Recent studies have recognised that combining data sources can improve estimates of the transmission rate and the number of infected individuals. However, inference methods are typically highly specialised and field-specific and are either computationally prohibitive or require intensive simulation, limiting their real-time utility. We present a novel birth-death phylogenetic model and derive a tractable analytic approximation of its likelihood, the computational complexity of which is linear in the size of the dataset. This approach combines epidemiological and phylodynamic data to produce estimates of key parameters of transmission dynamics and the unobserved prevalence. Using simulated data, we show (a) that the approximation agrees well with existing methods, (b) validate the claim of linear complexity and (c) explore robustness to model misspecification. This approximation facilitates inference on large datasets, which is increasingly important as large genomic sequence datasets become commonplace.


Conflict of interest statement

The authors have declared that no competing interests exist.

Figures

Fig 1
Fig 1. Birth-death model of transmission and observation.
The process can be observed in several ways leading to different data types. (A) The transmission process produces a binary tree (the transmission tree) where an infection corresponds to a λ-event and a branch node and ceasing to be infectious corresponds to a μ-, ψ- or ω-event and a leaf node. (B) The number of lineages in the transmission tree through time, ie the prevalence of infection, and the number of lineages in the reconstructed tree, known as the lineages through time (LTT) plot, Ki. (C) The tree reconstructed from the sequenced samples: ψ-events. The pathogen sequences allow the phylogeny connecting the infections and the timing of λ-events to be inferred. The unsequenced, ω-events form the point process on the horizontal axis. (D) Multiple ψ-events can be aggregated into a single ρ-event, such as the one at time r2. This loses information due to the discretization of the observation time, indicated by the dashed line segment. The same approach is used to aggregate ω-events into a single ν-event, eg the observation made at time u2.
Fig 2
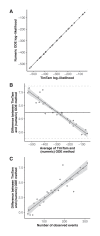
Fig 2. Likelihood comparison.
TimTam tends to overestimate the log-likelihood on larger datasets, but this tendency is small relative to the overall variability in the log-likelihoods across the simulations. (A) The log-likelihood evaluated using TimTam and the ODE approximation are in good agreement. (B) A Bland-Altman plot comparing the values from TimTam and the ODE approximation reveals that there is a small systematic difference in the methods. (C) TimTam appears to overestimate the log-likelihood on larger datasets but the relative error is small.
Fig 3
Fig 3. Log-likelihood evaluation time comparison.
The time required to evaluate our approximation, TimTam, scales better with the dataset size than the existing ODE approximation. The scatter plots indicates the average number of seconds required to evaluate the log-likelihood function for each dataset size. The left panel contains the results using our approximation, which has times growing approximately linearly with the dataset size. The right panel contains the results using the ODE approximation, which has times growing approximately quadratically with the dataset size. Solid lines show least squares fits. Note that the y-axes are on different scales. The overall scaling factor (but not the exponent of the fitted model) may be implementation dependent.
Fig 4
Fig 4. Simulation and aggregation.
The tips of the transmission tree are subsampled to reflect the observation process. (A) The full transmission tree of the simulated epidemic where green tips have been observed either as sequenced or unsequenced samples. (B) Bar chart showing the number of unobserved infections, the number of observed and potentially sequenced infections and the prevalence at the end of the simulation. (C) Time series of the number of cases after aggregation: the sequenced samples are aggregated into daily counts and the unsequenced occurrences are aggregated into weekly counts. Fig 5 shows the marginal posterior distributions using either the raw or aggregated data above.
Fig 5
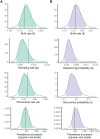
Fig 5. Posterior distributions.
The marginal posterior distributions of the parameters and the prevalence at the end of the simulation given the death rate, μ. (A) The marginal posterior distributions using the simulation data shown in Fig 4. (B) The marginal posterior distributions using the aggregated simulation data. Filled areas indicate 95% credible intervals. Vertical dashed lines indicate true parameter values where they exist (Table 1). There are no vertical lines for the scheduled observation probabilities because they are not well defined for this simulation.
Fig 6
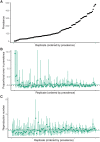
Fig 6. Simulation study results.
The bias in the estimators of the basic reproduction number, R0, and the prevalence is small and decreases with outbreak size. (A) The prevalence at the end of each of the simulations sorted into increasing order. (B) The proportional error in the prevalence estimate (ie a value of zero indicated by the dashed line corresponds to the true prevalence in that replicate). The solid green line is the mean of the point estimates. (C) The R0 point estimates and 95% CI for each replicate. The solid green line is the mean of the point estimates. The corresponding intervals for other parameters using the aggregated data are shown in Figs F–I in S1 Appendix.
Fig 7
Fig 7. Mean squared error of estimates decreases with larger datasets.
The mean squared error in the estimates of R0 under the posterior distribution decreases as the size of the dataset increases. The corresponding figure looking at the estimates of the prevalence, using both scheduled and aggregated data, is given as Fig J in S1 Appendix.

Similar articles

Cited by

References

    1. Brauer F, van den Driessche P, Wu J. Mathematical Epidemiology. Springer; 2008.
    1. Grassly NC, Fraser C. Mathematical models of infectious disease transmission. Nature Reviews Microbiology. 2008;6(6):477–487. doi: 10.1038/nrmicro1845 - DOI - PMC - PubMed
    1. Pybus OG, Rambaut A. Evolutionary analysis of the dynamics of viral infectious disease. Nature Reviews Genetics. 2009;10(8):540–550. doi: 10.1038/nrg2583 - DOI - PMC - PubMed
    1. Stadler T, Kouyos R, von Wyl V, Yerly S, Böni J, Bürgisser P, et al.. Estimating the Basic Reproductive Number from Viral Sequence Data. Molecular Biology and Evolution. 2011;29(1):347–357. doi: 10.1093/molbev/msr217 - DOI - PubMed
    1. Rasmussen DA, Ratmann O, Koelle K. Inference for Nonlinear Epidemiological Models Using Genealogies and Time Series. PLOS Computational Biology. 2011;7(8):1–11. doi: 10.1371/journal.pcbi.1002136 - DOI - PMC - PubMed

Publication types