. 2022 Nov 21;145(11):3999-4015.
doi: 10.1093/brain/awac055.

NCAM1 and GDF15 are biomarkers of Charcot-Marie-Tooth disease in patients and mice

Affiliations

NCAM1 and GDF15 are biomarkers of Charcot-Marie-Tooth disease in patients and mice

Matthew J Jennings et al. Brain. .

Abstract

Molecular markers scalable for clinical use are critical for the development of effective treatments and the design of clinical trials. Here, we identify proteins in sera of patients and mouse models with Charcot-Marie-Tooth disease (CMT) with characteristics that make them suitable as biomarkers in clinical practice and therapeutic trials. We collected serum from mouse models of CMT1A (C61 het), CMT2D (GarsC201R, GarsP278KY), CMT1X (Gjb1-null), CMT2L (Hspb8K141N) and from CMT patients with genotypes including CMT1A (PMP22d), CMT2D (GARS), CMT2N (AARS) and other rare genetic forms of CMT. The severity of neuropathy in the patients was assessed by the CMT Neuropathy Examination Score (CMTES). We performed multitargeted proteomics on both sample sets to identify proteins elevated across multiple mouse models and CMT patients. Selected proteins and additional potential biomarkers, such as growth differentiation factor 15 (GDF15) and cell free mitochondrial DNA, were validated by ELISA and quantitative PCR, respectively. We propose that neural cell adhesion molecule 1 (NCAM1) is a candidate biomarker for CMT, as it was elevated in Gjb1-null, Hspb8K141N, GarsC201R and GarsP278KY mice as well as in patients with both demyelinating (CMT1A) and axonal (CMT2D, CMT2N) forms of CMT. We show that NCAM1 may reflect disease severity, demonstrated by a progressive increase in mouse models with time and a significant positive correlation with CMTES neuropathy severity in patients. The increase in NCAM1 may reflect muscle regeneration triggered by denervation, which could potentially track disease progression or the effect of treatments. We found that member proteins of the complement system were elevated in Gjb1-null and Hspb8K141N mouse models as well as in patients with both demyelinating and axonal CMT, indicating possible complement activation at the impaired nerve terminals. However, complement proteins did not correlate with the severity of neuropathy measured on the CMTES scale. Although the complement system does not seem to be a prognostic biomarker, we do show complement elevation to be a common disease feature of CMT, which may be of interest as a therapeutic target. We also identify serum GDF15 as a highly sensitive diagnostic biomarker, which was elevated in all CMT genotypes as well as in Hspb8K141N, Gjb1-null, GarsC201R and GarsP278KY mouse models. Although we cannot fully explain its origin, it may reflect increased stress response or metabolic disturbances in CMT. Further large and longitudinal patient studies should be performed to establish the value of these proteins as diagnostic and prognostic molecular biomarkers for CMT.

Keywords: Charcot-Marie-Tooth disease (CMT); biomarker; mouse models; serum; translational‌.


Figures

Figure 1
Figure 1
Study design. (A) Schematic of mass spectrometry proteomic serum protein biomarker identification in human and mouse, and statistical analysis framework. (B) Progression of pathological and symptomatic neuropathy of mouse models, and time points of serum collection.
Figure 2
Figure 2
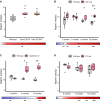
Serum Ncam1 analysis. (A) control (n = 7), GarsC201R (n = 5) and GarsP278KY (n = 5);(B) control (n = 6/4/3/6) versus Gjb1-null (n = 4/4/5/6); (C) control (n = 3/3/3) Hspb8K141N (n = 3/3/3); (D) control (n = 5/5/4) and C61 het (n = 3/4/4) mouse models, determined by ELISA quantification. Statistical significance indicated by Student’s t-test, where *P < 0.05, **P < 0.01.
Figure 3
Figure 3
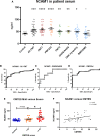
NCAM1 expression in patient sera, determined by ELISA quantification. (A) NCAM1 expression in healthy controls (n = 23); all CMT (n = 55), CMT1 (n = 39), PMP22d (CMT1A) (n = 24), CMT2 (n = 19), GARS/AARS (n = 9) neuropathy patients; and GNE myopathy patients (n = 39). NCAM1 ROC curves for: (B) CMT (all) versus control, AUC = 0.748 (95% CI; 0.627–0.869); (C) GARS/AARS versus control, AUC = 0.747 (95% CI; 0.578–0.914); (D) PMP22d versus control, AUC 0.797 (95% CI; 0.661–0.932). (E) NCAM1 in control (n = 23), mild (CMTES < 10, n = 16) and severe patients (CMTES ≥ 10, n = 28). (F) NCAM1 versus CMTES in CMT patients (n = 44). Statistical significance indicated by Student’s t-test, where *P < 0.05, **P < 0.01, ***P < 0.001, ****P < 0.0001.
Figure 4
Figure 4
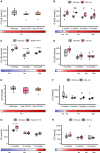
Serum complement C1q-B analysis in mice. (A) control (n = 7) GarsC201R (n = 5) and GarsP278KY (n = 5); (B) control (n = 6/4/3/6) and Gjb1-null (n = 4/4/5/6); (C) control (n = 3/3/3) and Hspb8K141N (n = 3/3/3); (D) control (n = 5/5/4) and C61 het (n = 3/4/4) mouse models. Serum complement C3 in: (E) control (n = 7) GarsC201R (n = 5) and GarsP278KY (n = 5); (F) control (n = 6/4/3/6) and Gjb1-null (n = 4/4/5/6); (G) control (n = 3/3/3) and Hspb8K141N (n = 3/3/3); (H) control (n = 5/5/4) and C61 het (n = 3/4/4) mouse models, by MRM-mass spectrometry. Statistical significance indicated by Student’s t-test, where *P < 0.05, **P < 0.01.
Figure 5
Figure 5
Serum complement C1q-B analysis in patients. Healthy controls (n = 12); all CMT (n = 43), CMT1 (n = 23), PMP22d (n = 17), CMT2 (n = 16) and GARS/AARS (n = 7) patients; and GNE myopathy patients serum complements (A) C1q-B and (B) C3. Correlation with CMTES of serum complements (C) C1q-B (n = 28) and (D) C3 (n = 28). Determined by MRM-mass spectrometry. Statistical significance indicated by Student’s t-test, where *P < 0.05, **P < 0.01.
Figure 6
Figure 6
Serum Gdf15 analysis in mice. (A) Controls (n = 7), GarsC201R (n = 3) and GarsP278KY (n = 2); (B) controls (n = 6/3/4/6) and Gjb1-null (n = 4/3/5/6); (C) control (n = 3/3/3) and Hspb8K141N (n = 4/3/3); (D) controls (n = 5/4/3) and C61 het (n = 3/4/4) mouse models determined by ELISA quantification. Statistical significance indicated by Student’s t-test, where *P < 0.05, **P < 0.01.
Figure 7
Figure 7
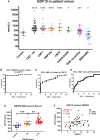
GDF15 expression in patient sera determined by ELISA quantification. (A) GDF15 expression in healthy controls (n = 14); all CMT (n = 49), CMT1 (n = 24), PMP22d (n = 19), CMT2 (n = 17) and GARS/AARS (n = 8) neuropathy patients; GNE myopathy (n = 39), BMD (n = 30) and DMD (n = 4) patients. GDF15 ROC curves for: (B) CMT (all) versus control, AUC = 0.972 (95% CI; 0.936–1); (C) GARS/AARS versus control, AUC = 0.960 (95% CI; 0.886–1); (D) PMP22d versus control, AUC 974 (95% CI; 0.912–1). (E) GDF15 in control, mild (CMTES < 10) and severe patients (CMTES ≥ 10). (F) GDF15 versus CMTES in CMT patients, with regression shown for all patients and a CMTES < 15 subset. Statistical significant indicated by Student’s t-test, where *P < 0.05, **P < 0.01, ***P < 0.001, ****P < 0.0001.
Figure 8
Figure 8
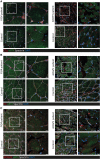
Complement components and NCAM1 are increased in skeletal muscle of CMT patients. Confocal microscopy detects more (A) complement C1q, (B) complement C3, and (C) NCAM1-positive structures in muscle biopsies of two patients with CMT due to pathogenic variants in FIG4 and GDAP1 compared to age- and sex-matched healthy controls (each in red). In contrast, muscle biopsies from healthy controls show more α-bungarotoxin (BTX, green) positive structures along the basement membrane (Spectrin, grey). Scale bars = 20 µm in overview scans, 10 µm in detail scans (indicated by white box).

References

    1. Skre H. Genetic and clinical aspects of Charcot-Marie-Tooth’s disease. Clin Genet. 1974;6(2):98–118. - PubMed
    1. Barreto LCLS, Oliveira FS, Nunes PS, et al. Epidemiologic study of Charcot-Marie-Tooth disease: A systematic review. Neuroepidemiology. 2016;46(3):157–165. - PubMed
    1. Fridman V, Bundy B, Reilly MM, et al. CMT subtypes and disease burden in patients enrolled in the inherited neuropathies consortium natural history study: a cross-sectional analysis. J Neurol Neurosurg Psychiatry. 2015;86(8):873–878. - PMC - PubMed
    1. Lupski JR, de Oca-Luna, Slaugenhaupt S, et al. DNA duplication associated with Charcot-Marie-Tooth disease type 1A. Cell 1991;66:219–232. - PubMed
    1. Timmerman V, Nelis E, Van Hul, et al. The peripheral myelin protein gene PMP-22 is contained within the Charcot-Marie-Tooth disease type 1A duplication. Nature genetics 1992;1:171–175. - PubMed

Publication types

Supplementary concepts