. 2022 Jul 29;145(7):2486-2506.
doi: 10.1093/brain/awab436.

Tubulin tyrosination regulates synaptic function and is disrupted in Alzheimer's disease

Affiliations

Tubulin tyrosination regulates synaptic function and is disrupted in Alzheimer's disease

Leticia Peris et al. Brain. .

Abstract

Microtubules play fundamental roles in the maintenance of neuronal processes and in synaptic function and plasticity. While dynamic microtubules are mainly composed of tyrosinated tubulin, long-lived microtubules contain detyrosinated tubulin, suggesting that the tubulin tyrosination/detyrosination cycle is a key player in the maintenance of microtubule dynamics and neuronal homeostasis, conditions that go awry in neurodegenerative diseases. In the tyrosination/detyrosination cycle, the C-terminal tyrosine of α-tubulin is removed by tubulin carboxypeptidases and re-added by tubulin tyrosine ligase (TTL). Here we show that TTL heterozygous mice exhibit decreased tyrosinated microtubules, reduced dendritic spine density and both synaptic plasticity and memory deficits. We further report decreased TTL expression in sporadic and familial Alzheimer's disease, and reduced microtubule dynamics in human neurons harbouring the familial APP-V717I mutation. Finally, we show that synapses visited by dynamic microtubules are more resistant to oligomeric amyloid-β peptide toxicity and that expression of TTL, by restoring microtubule entry into spines, suppresses the loss of synapses induced by amyloid-β peptide. Together, our results demonstrate that a balanced tyrosination/detyrosination tubulin cycle is necessary for the maintenance of synaptic plasticity, is protective against amyloid-β peptide-induced synaptic damage and that this balance is lost in Alzheimer's disease, providing evidence that defective tubulin retyrosination may contribute to circuit dysfunction during neurodegeneration in Alzheimer's disease.

Keywords: Alzheimer’s disease; dendritic spines; microtubule; neuron; tubulin.


Figures

Figure 1
Figure 1
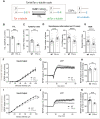
TTL reduction induces early memory defects and age-dependent alteration of synaptic plasticity. (A) Schematic representation of α-tubulin tyrosination/detyrosination cycle. CCPs = cytosolic carboxypeptidases. (B and C) Relative amount of TTL (normalized with GAPDH) and tyrosinated/detyrosinated tubulin ratio, in protein extracts from hippocampi of 3-month-old wild-type (WT) and TTL+/− mice. Graphs represents mean ± SEM. Mann–Whitney test, **P < 0.01, ****P < 0.0001. n = 10 independent experiments for each genotype. (D) Spontaneous alternation in Y-maze test. Total number of arm entries and percentage of alternance of 3-month-old WT and TTL+/− mice. Graph represents mean ± SEM. n = 28 for WT and TTL+/− mice. Student’s t-test, ***P < 0.001, ****P < 0.0001. (E) Novel Object Recognition test. Recognition index (time spent exploring the novel object minus the time spent exploring the two familiar objects, in seconds) of 3-month-old WT and TTL+/− mice, measured 1 h after familiarization. Mean ± SEM, n = 48 and 40 for WT and TTL+/− mice, respectively. Student’s t-test, ****P < 0.0001. (F) Input/output (I/O) curves of 3-month-old WT and TTL+/− mice slices. Curves were constructed by plotting mean fEPSPs slopes ± SEM as a function of stimulation intensity. Two-way ANOVA, Genotype × Stimulation intensity interaction is not significant [F(10,80) = 0,3845, P = 0.9500]. n = 5 slices from three WT mice and n = 5 slices from three TTL+/− mice. (G) LTP of 3-month-old WT and TTL+/− mice. Curves represent normalized mean of fEPSPs slopes ± SEM as a function of time before and after LTP induction. (H) Graph showing normalized mean of fEPSPs slopes ± SEM for the last 10 min of recording in WT and TTL+/− mice. Mann–Whitney test, ns = not significant (P = 0.8048). n = 7 slices from three WT mice and n = 7 slices from three TTL+/− mice. (I) Input/output (I/O) curves of 9-month-old WT and TTL+/− mice slices. Two-way ANOVA, Genotype × Stimulation intensity interaction [F(10,220) = 1,923, *P = 0.0433]. n = 12 slices from five WT mice and n = 12 slices from five TTL+/− mice. (J) LTP of 9-month-old WT and TTL+/− mice. (K) Graph showing normalized mean of fEPSPs slopes ± SEM for the last 10 min of recording in WT and TTL+/− mice. Mann–Whitney test, **P = 0.0021; n = 10 slices from four WT mice and n = 10 slices from four TTL+/− mice.
Figure 2
Figure 2
TTL reduction decreases dendritic spine density in vivo and in cultured neurons. (A) Confocal images showing representative examples of dendritic segments of cortical neurons from 4-month-old Thy1-eYFP-H wild-type (WT) and Thy1-eYFP-H TTL+/− mice. (B) Total dendritic spine density, or that of each different morphological type of spines, is represented for Thy1-eYFP-H WT and Thy1-eYFP-H TTL+/− cortical neurons. Graphs represent mean ± SEM. n = 36 neurons from four independent animals of each genotype. Student’s t-test, *P < 0.05; ***P < 0.001 and ns = not significant. (C) Confocal images showing representative examples of the dendritic segments of GFP-expressing WT and TTL+/− hippocampal neurons in culture at 17 DIV. (D) Total dendritic spine density, or that of each different morphological type of spines are represented for WT and TTL+/− hippocampal cultured neurons. Graphs represent mean ± SEM. n = 27 and n = 34 neurons from WT and TTL+/− embryos from at least three independent cultures. Student’s t-test, *P < 0.05; **P < 0.01; ****P < 0.0001 and ns = not significant. (E) Confocal images showing representative examples of dendritic segments of DiOilistic labelled WT rat hippocampal neurons in culture at 21 DIV, infected with control shRNA or shRNA targeting tubulin tyrosine ligase (shTTL1 and shTTL2). (F) Total dendritic spine density or that of each different morphological type of spines, of hippocampal neurons infected with control shRNA (non-coding shRNA) or two independent shRNA lentiviruses targeting tubulin tyrosine ligase (shTTL1 and shTTL2). Graphs represent mean ± SEM. n = 71, n = 124 and n = 60 neurons from control shRNA, shTTL1 and shTTL2, respectively, from at least three independent cultures. Kruskal–Wallis with Dunn’s multi-comparison test, *P < 0.05; **P < 0.01; ****P < 0.0001; ns = not significant. Spine assignation to thin, stubby or mushroom categories was performed according to morphological parameters described in Supplementary Fig. 5.
Figure 3
Figure 3
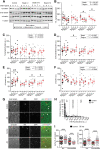
Loss of tubulin tyrosine ligase and increased non-tyrosinated tubulin levels in sporadic Alzheimer’s disease brain samples. (A) Representative immunoblot analysis of tyrosinated, detyrosinated, Δ2 and α tubulin levels in brain homogenates from entorhinal cortex (E), hippocampus (H), temporal (T) and lateral prefrontal cortex (L) from control, early Alzheimer’s disease (Braak I–II), middle Alzheimer’s disease (Braak III–IV) and late Alzheimer’s disease (Braak V–VI) patients. In each blot an internal standard corresponding to a wild-type (WT) sample was used for normalization and considered as 100% and the values for each unknown sample were calculated as a percentage of this standard (see ‘Material and methods’ section). (BF) Quantification of tubulin tyrosine ligase (TTL) protein expression, modified tubulins (tyrosinated, detyrosinated and Δ2 tubulin) and α tubulin levels in each brain region from control and Alzheimer’s disease patients. Graphs represent mean ± SEM. The dependence of protein levels on, respectively, clinical stage and brain area was quantitated in each case using a linear mixed model, with Braak stage and brain region as fixed effect factors. Boxed P-values measure the overall significance of these factors (type II Wald F test of model coefficients). In each brain area, post hoc testing of variations due to individual Braak stages was performed by Dunnett’s test of differences with control. Significance levels are indicated as follows: #P < 0.05 and ##P < 0.01. n = 11, n = 5, n = 6, and n = 7 for Control, Braak I–II, Braak III–IV and Braak V–VI Alzheimer’s disease patient brains, respectively. Each sample was analysed in triplicate. (G) Representative images of detyrosinated, Δ2 tubulin and phospho-tau in pyramidal neurons of hippocampi from control and Alzheimer’s disease patients. Dual immunostaining of detyrosinated (upper panel) or Δ2 tubulin (lower panel) and AT8-reactive phospho-tau, combined with nuclear staining with DAPI, was performed on sections of control and Alzheimer’s disease patient hippocampi. Neurons with low (white arrowheads), intermediate (white arrows) or high (red arrows) levels of AT8 immunofluorescence are shown. Scale bar = 50 µm. (H) Relative frequency distribution of phospho-tau (AT8) immunofluorescence levels (arbitrary units) in pyramidal neurons of control and Alzheimer’s disease brains. Low, intermediate and high phospho-tau groups were defined based on fluorescence intensity. Two-sample Kolmogorov–Smirnov test, ****P < 0.0001. (I) Intensity of detyrosinated tubulin (left graph) or Δ2 tubulin (right graph) immunofluorescence in pyramidal cell bodies of Alzheimer’s disease hippocampal neurons relative to control, shown as a function of AT8 labelling level. Data are presented as mean ± SEM. For detyrosinated tubulin, n = 382 and n = 67 neurons in controls and n = 296 and n = 162 for Alzheimer’s disease neurons in low and intermediate phospho-tau groups, respectively. For Δ2 tubulin, n = 249 and n = 45 neurons in controls and n = 91 and n = 133 for Alzheimer’s disease neurons in low and intermediate phospho-tau groups, respectively. Mann–Whitney test, ****P < 0.0001.
Figure 4
Figure 4
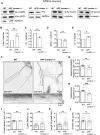
Loss of TTL and increased non-tyrosinated tubulin levels correlate with inhibition of microtubule dynamics in human cortical APP-London neurons. (A) Immunoblot analysis of phospho-specific tau (AT8), total tau (tau46), TTL, detyrosinated tubulin and Δ2 tubulin from lysates of human cortical neurons, derived from wild-type (WT) and APP-London (V717I) knocked-in iPSCs isogenic lines. GAPDH was used for tau and TTL normalization and total tubulin for modified tubulins. Immunoblot quantifications of phospho-tau normalized to total tau (B), TTL (C), detyrosinated (D) and Δ2 tubulin (E). Data are expressed as a ratio of WT and graphs represent mean ± SEM. n = 5, n = 5, n = 4 and n = 4 independent neuronal differentiation experiments for B, C, D and E, respectively. Mann–Whitney test, ns = not significant, *P < 0.05, **P < 0.01. (F) WT and APP-London human cortical neurons expressing EB3-GFP. Representative neurites (dashed boxes) from human cortical neurons were analysed for microtubule dynamics and kymographs of these regions are shown below. Scale bar: 10 μm. (GL) Parameters of microtubule dynamics are represented as mean ± SEM. n = 14 neurites from WT and APP-London neurons for G to I, and n = 44 comets for J, n = 42 comets for K and n = 38 comets for L, from WT and APP-London neurons, respectively. Student’s t-test, ns = not significant, **P < 0.01 and ***P < 0.001.
Figure 5
Figure 5
Acute oAβ treatment affects spine invasion by dynamic microtubules in neurons. (A) Confocal images showing representative examples of dendritic segments of eGFP expressing wild-type (WT) rat hippocampal neurons (17 DIV) treated with DMSO or with 250 nM of oAβ for 2 days. (B) Graphs of the percentage of dendritic spine density in WT cultured neurons incubated with oAβ over 6 h. Data are expressed as a percentage of baseline and graphs represent mean ± SEM. n = 4 neurons analysed over time. One-way ANOVA with Dunnett’s multiple comparison test, *P < 0.05 and ***P < 0.001. (C) Representative stills from videos of a WT neuron (21 DIV) transfected with DsRed and EB3-eGFP to visualize dendritic spines and the growing plus ends of microtubules, before and 2 h after oAβ treatment. Spines that will prune are highlighted with a green arrow at time 0, and with an empty green arrow after 2 h of oAβ treatment. The spine that will be invaded by a microtubule is highlighted with a blue arrow at time 0 and persists after 2 h of oAβ treatment. Microtubule invasion into the spine is highlighted with a red arrow. Spines that are not invaded but persist after oAβ treatment are highlighted with arrows in magenta. (D) Percentage of spines invaded by microtubules before and after oAβ exposure at the indicated times. Graphs represent mean ± SEM. n = 22, n = 10, n = 9, n = 6 and n = 5 neurons at each time point. One-way ANOVA with Dunnett’s multiple comparison test, ns = not significant, **P < 0.01 and ****P < 0.0001. Number of spines: 402, 150, 411, 191, 321, 342 and 285 for control and amyloid-β (0.5 h, 1 h, 1.5 h, 2 h, 3 h and 6 h) conditions, respectively. (E) Total percentage of spine pruning or resistance to vehicle or oAβ incubation. Graph represents the mean percentage of non-invaded spines (left) or microtubule-invaded spine fate (right) for either fate. Spines invaded by microtubules (n = 45 and n = 24) and spines non-invaded by microtubules (n = 43 and n = 43) for vehicle and oAβ conditions, respectively. Microtubule-invaded spines were significantly more resistant to oAβ-induced pruning than non-invaded spines (overall dependence of the spine pruning rate on microtubule invasions and oAβ treatment: X2 = 43.64, 4 df, ****P < 0.0001, chi-square test; odds ratio of resistance to oAβ in microtubule-invaded versus; non-invaded spines (1.15 versus 5.44, X2 = 5.27, 1 df, *P = 0.021, Woolf test).
Figure 6
Figure 6
Ectopic TTL expression rescues neurons from oAβ-induced dendritic spine loss and resumes microtubule invasions into spines. (A and B) Immunoblot analysis of TTL (A) and tyrosinated/detyrosinated tubulin ratio (B) from wild-type (WT) mouse cortical neurons (17 DIV) transduced or not with a lentivirus expressing TTL and chronically treated with DMSO or with 100 nM oAβ. Data are expressed as a percentage of WT and graphs represent mean ± SEM. (A) n = 8, n = 7, n = 4 and n = 4 cultures for WT, WT+ Aβ, WT + TTL and WT + Aβ + TTL respectively. Two-way ANOVA, oAβ treatment × TTL expression interaction [F(1,19) = 14.6, **P = 0.0012]. All values were compared to WT, Dunnett’s multiple comparison test, *P < 0.05 and ****P < 0.0001. (B) n = 5, n = 5, n = 3 and n = 3 cultures for WT, WT + oAβ, WT + TTL and WT + oAβ + TTL respectively. Two-way ANOVA, oAβ treatment × TTL expression interaction [F(1,12) = 1.309, P = 0.274]. All values were compared to WT, Dunnett’s multiple comparison test, ns = not significant. (C) Graphs of total dendritic spine density in cultured WT neurons treated as in A. Graphs represent mean ± SEM. n = 27, n = 26, n = 20 and n = 20 neurons for WT, WT + oAβ, WT + TTL and WT + oAβ + TTL, respectively. Two-way ANOVA, oAβ treatment × TTL expression interaction [F(1,89) = 58.44, ****P < 0.0001]. All values were compared to WT, Dunnett’s multiple comparison test, ns = not significant and ****P < 0.0001. (D) Confocal images showing representative examples of dendritic segments of GFP-expressing WT hippocampal mouse neurons (17 DIV) chronically treated with DMSO or with 100 nM oAβ. (E) Representative stills from videos of rat WT neurons (18 to 21 DIV) transduced or not with a TTL containing lentivirus and transfected with plasmids encoding eGFP and EB3-tdTomato to visualize the dendrites and spines and the growing plus ends of microtubules, respectively. Cells were incubated with vehicle or with 250 nM of oAβ for 30 min. Microtubule invasions of spines are highlighted with a red arrow. (F) Percentage of spines invaded by microtubules after vehicle or oAβ exposure. Graphs represent mean ± SEM. n = 9 neurons for each condition. Two-way ANOVA, oAβ treatment × TTL expression interaction [F(1,32) = 4.76, P = 0.037]. Holm–Sidak’s multiple comparison test, ns = not significant, *P < 0.05. (G) Graphs of total dendritic spine density in cultured neurons treated as in E and incubated with vehicle or with oAβ for 30 min or 3 h. Graphs represent mean ± SEM. n = 6 neurons of each condition. Two-way ANOVA, oAβ treatment × TTL expression interaction [F(2,30) = 7.11, P = 0.003]. Holm–Sidak’s multiple comparison test, ns = not significant, ****P < 0.0001. For F and G, number of spines analysed: n = 119, n = 117, n = 106, n = 123, n = 75 and n = 106 for control, control + TTL, control + Aβ 30 min, control + TTL + Aβ 30 min, control + Aβ 3 h and control + TTL + Aβ 3 h, respectively.
Figure 7
Figure 7
Schematic representation of TTL, of modified tubulins in dendritic shafts and dendritic spines and of spine density in neurons (normal conditions and under oAβ exposure). Tyrosinated tubulin dimers polymerize into dynamic tyrosinated microtubules (red). Tubulin carboxypeptidases (VASH-SVBP) detyrosinate long-lived microtubules (green). After depolymerization, TTL (in grey) retyrosinates tubulin dimers. Very stable detyrosinated microtubules are substrate of cytosolic carboxypeptidases (CCPs) to form Δ2 microtubules (blue) that exit the tyrosination/detyrosination cycle. In mature neurons from control patients (or wild-type mice), tyrosinated microtubules form a shell at the outer part of the dendrite while detyrosinated and Δ2 microtubules localize to the inner part. Some dynamic microtubules from the dendrite transiently invade dendritic spines. In neuronal models of Alzheimer’s disease, amyloid-β oligomers exposure have a sequential effect on microtubule behaviour and dendritic spine retraction: short time incubation with amyloid-β oligomers induces a decrease in TTL content, an accumulation of detyrosinated and Δ2 microtubules, a decrease in the frequency of microtubule invasion into spines with no change in dendritic spine density; longer incubation accentuates this phenotype and induces spine retraction. Ectopically controlled TTL expression restores tyrosinated, detyrosinated and Δ2 tubulin balance, microtubule invasion into the spines and dendritic spine density.

References

    1. Parato J, Bartolini F. The microtubule cytoskeleton at the synapse. Neurosci Lett. 2021;753:135850. - PMC - PubMed
    1. Waites C, Qu X, Bartolini F. The synaptic life of microtubules. Curr Opin Neurobiol. 2021;69:113–123. - PMC - PubMed
    1. Qu X, Kumar A, Blockus H, Waites C, Bartolini F. Activity-dependent nucleation of dynamic microtubules at presynaptic boutons controls neurotransmission. Curr Biol. 2019;29(24):4231–4240.e5. - PMC - PubMed
    1. Guedes-Dias P, Nirschl JJ, Abreu N, et al. . Kinesin-3 responds to local microtubule dynamics to target synaptic cargo delivery to the presynapse. Curr Biol. 2019;29(2):268–282.e8. - PMC - PubMed
    1. Guillaud L, Dimitrov D, Takahashi T. Presynaptic morphology and vesicular composition determine vesicle dynamics in mouse central synapses. eLife. 2017;6:e24845. - PMC - PubMed

Publication types