Review
. 2022 Apr 26;187(1):3-24.
doi: 10.1093/toxsci/kfac013.

The Challenges of Predicting Drug-Induced QTc Prolongation in Humans

Affiliations
Review

The Challenges of Predicting Drug-Induced QTc Prolongation in Humans

Jean-Pierre Valentin et al. Toxicol Sci. .

Abstract

The content of this article derives from a Health and Environmental Sciences Institute (HESI) consortium with a focus to improve cardiac safety during drug development. A detailed literature review was conducted to evaluate the concordance between nonclinical repolarization assays and the clinical thorough QT (TQT) study. Food and Drug Administration and HESI developed a joint database of nonclinical and clinical data, and a retrospective analysis of 150 anonymized drug candidates was reviewed to compare the performance of 3 standard nonclinical assays with clinical TQT study findings as well as investigate mechanism(s) potentially responsible for apparent discrepancies identified. The nonclinical assays were functional (IKr) current block (Human ether-a-go-go related gene), action potential duration, and corrected QT interval in animals (in vivo corrected QT). Although these nonclinical assays demonstrated good specificity for predicting negative clinical QT prolongation, they had relatively poor sensitivity for predicting positive clinical QT prolongation. After review, 28 discordant TQT-positive drugs were identified. This article provides an overview of direct and indirect mechanisms responsible for QT prolongation and theoretical reasons for lack of concordance between clinical TQT studies and nonclinical assays. We examine 6 specific and discordant TQT-positive drugs as case examples. These were derived from the unique HESI/Food and Drug Administration database. We would like to emphasize some reasons for discordant data including, insufficient or inadequate nonclinical data, effects of the drug on other cardiac ion channels, and indirect and/or nonelectrophysiological effects of drugs, including altered heart rate. We also outline best practices that were developed based upon our evaluation.

Keywords: QT prolongation; Torsades de Pointes (TdP); discordance; hERG; pharmacokinetics; proarrhythmia; regulatory; sensitivity; specificity.


Figures

Figure 1.
Figure 1.
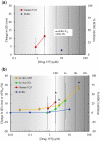
For Drug 157, concentration-response data from the clinical thorough QT (TQT) and nonclinical assays were plotted. The concentration-effect plots show (A) original clinical and nonclinical data for Drug 157 used in the Health and Environmental Sciences Institute/Food Drug Administration analysis by Park et al. (2018), and (B) data for Drug 157 with additional nonclinical data supplied by the sponsor. Stars indicate concentrations at which a positive effect occurred in each assay. TQT data are ΔΔ corrected QT (QTc). The in vitro action potential duration (APD) data are from a rabbit Purkinje fiber study (APD90% change from control), and the in vivo QTc data are from an anesthetized dog study (change from control). The addition of supplementary nonclinical data renders Drug 157 concordant with the human TQT result. The vertical clinical reference concentration (CRC) line indicates the lowest Cmax, free showing QT prolongation. The additional vertical lines indicate multiples from the CRC. Data are plasma concentrations of unbound drug.
Figure 2.
Figure 2.
For Drug 143, concentration-response data from the clinical T thorough QT (QT) and nonclinical assays were plotted. The concentration-effect plots show data for Drug 143 used in the HESI/FDA analysis by Park et al. (2018). Stars indicate concentrations at which a positive effect occurred in the human TQT study. Although Drug 143 was positive in the human ether-a-go-go related gene (hERG) assay, this drug was classified as nonconcordant since the hERG IC50 value was beyond the 30× threshold margin established for concordance in the analysis by Park et al. (2018). The use of a larger safety margin (45×) as suggested by Gintant (2011) would have resulted in this drug being classified as concordant. The vertical clinical reference concentration (CRC) line indicates the lowest Cmax, free showing QT prolongation. The additional vertical lines indicate multiples from the CRC. Data are plasma concentrations of unbound drug.
Figure 3.
Figure 3.
For Drug 12, concentration-response data from the clinical thorough QT (TQT) and nonclinical assays were plotted. The concentration-effect plots show (A) original clinical and nonclinical data for Drug 12 used in the Health and Environmental Sciences Institute/Food Drug Administration analysis by Park et al. (2018), and (B) data for Drug 12 with additional nonclinical data provided by the sponsor and from Lacerda et al. (2008). Stars indicate concentrations at which a positive effect occurred in each assay. TQT data are ΔΔ corrected QT (QTc). In vitro action potential duration (APD) data are from a rabbit Purkinje fiber study (APD90% change from control), and in vitro QT data are from a rabbit Langendorff study (QT% change from control). Patch clamp data indicating that Drug 12 increased the amplitude of the late sodium current (INaLate) is included. At 10 µM the current is increased 396% but is cropped from the y-axis for display purposes. The supplementary nonclinical data from the sponsor and Lacerda et al. (2008) reveal a mechanism that produces QT prolongation but is not related to hERG block. These data render Drug 12 concordant with the human TQT study. The vertical clinical reference concentration (CRC) line indicates the lowest Cmax, free showing QT prolongation. The additional vertical lines indicate multiples from the CRC. Data are plasma concentrations of unbound drug.
Figure 4.
Figure 4.
Multiple mechanisms may be involved in drug-induced QT/corrected QT (QTc) interval prolongation. The lack of concordance between human ether-a-go-go related gene (hERG) block (characterized by the IC50 value) and QT/QTc prolongation could be due to both direct and indirect factors. The left column lists various direct factors that may affect/modulate the extent of QT prolongation at the level of a myocyte beyond simple characterization of hERG block. These factors include the kinetics of hERG (IKr) block, multichannel block (block of other channels that mitigate or exacerbate delayed repolarization, including transporters and electrogenic exchangers), drugs altering channel expression (“trafficking”), and intracellular accumulation and second messenger systems affecting ionic currents (eg, IKs current enhancement via cyclic AMP). The right column lists various indirect factors that may affect drug-induced QT prolongation including heart rate, electrolytes, and hemodynamic changes. Other factors that may affect the sensitivity of the myocyte to hERG block include hypokalemia-altered sympathetic/parasympathetic tone and diseases, such as heart failure. Note that the cardiac currents involved include the rapid component of the delayed cardiac potassium channel (Kv11.1 or IKr,); the slow component of the delayed cardiac potassium channel (KvLQT1 + minK or IKs); the L-type calcium channel (Cav1.2 or ICaL); the fast inward sodium channel (INa); the inward rectifier potassium channel (Kir2.1 or IK1); the transient outward potassium channel (Kv4.3 or Ito); and the late sodium channel (INaLate). See the IUPHAR/BPS Concise Guide to PHARMACOLOGY citation for further details on these ion channels (Ion channels. Accessed on January 19, 2019. IUPHAR/BPS Guide to PHARMACOLOGY, http://www.guidetopharmacology.org/GRAC/FamilyDisplayForward?familyId=689).
Figure 5.
Figure 5.
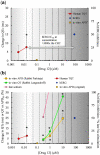
For Drug 142, concentration-response data from the clinical thorough QT (TQT) and nonclinical assays were plotted. The concentration-effect plots show (A) original clinical and nonclinical data for Drug 142 used in the HESI/FDA analysis by Park et al. (2018), and (B) data for Drug 142 with additional non-clinical data provided by the sponsor. Stars indicate concentrations at which a positive effect occurred in each assay. TQT data are ΔΔ corrected QT (QTc). The in vitro action potential duration (APD) is from a rabbit Purkinje fiber study (APD90 change from control). The in vivo QTc is from a monkey telemetry study. Supplementary Material failed to explain the increase in QT interval observed in the TQT study. The vertical clinical reference concentration (CRC) line indicates the lowest Cmax, free showing QT prolongation. The additional vertical lines indicate multiples from the CRC.
Figure 6.
Figure 6.
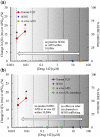
For Drug 173, concentration-response data from the clinical thorough QT (TQT) and nonclinical assays were plotted. The concentration-effect plots show (A) original clinical and nonclinical data for Drug 173 used in the HESI/FDA analysis by Park et al. (2018), and (B) data for Drug 173 with additional nonclinical data provided by the sponsor. Stars indicate concentrations at which a positive effect occurred in each assay. Both the TQT and in vivo corrected QT (QTc) data are ΔΔQTc. The in vivo QTc data are from dog telemetry studies where Drug 173 was given by both inhalational and intravenous routes of administration. In vivo action potential duration (APD) data are also shown from a guinea pig study. The supplementary nonclinical data provided by the sponsor for Drug 173 resulted in concordance with the clinical TQT data. The mechanism responsible for QT prolongation is considered indirect and may be related to a coincident increase in heart rate noted in both humans and dogs. The vertical clinical reference concentration (CRC) line indicates the lowest Cmax, free showing QT prolongation. The additional vertical lines indicate multiples from the CRC. Data are plasma concentrations of unbound drug.

References

    1. Abbott G. W., Sesti F., Splawski I., Buck M. E., Lehmann M. H., Timothy K. W., Keating M. T., Goldstein S. A. (1999). MiRP1 forms IKr potassium channels with HERG and is associated with cardiac arrhythmia. Cell 97, 175–187. - PubMed
    1. Abi-Gerges N., Philp K., Pollard C., Wakefield I., Hammond T. G., Valentin J. P. (2004). Sex differences in ventricular repolarization: From cardiac electrophysiology to Torsades de Pointes. Fund. Clin. Pharmacol. 18, 139–151. - PubMed
    1. Adelusi S. A., Salako L. A. (1982). Kinetics of the distribution and elimination of chloroquine in the rat. Gen. Pharmacol. 13, 433–437. - PubMed
    1. Alpaslan M., Onrat E., Samli M., Dincel C. (2003). Sildenafil citrate does not affect QT intervals and QT dispersion: An important observation for drug safety. Ann. Noninvasive Electrocardiol. 8, 14–17. - PMC - PubMed
    1. Anantharam A., Abbott G. W. (2005). Does hERG coassemble with a beta subunit? Evidence for roles of MinK and MiRP1. Novartis Found. Symp., 266, 100–112; discussion 112–107, 155–108. - PubMed