

Severity of low pre-pregnancy body mass index and perinatal outcomes: the Japan Environment and Children's Study
- PMID: 35148693
- PMCID: PMC8840606
- DOI: 10.1186/s12884-022-04418-3
Severity of low pre-pregnancy body mass index and perinatal outcomes: the Japan Environment and Children's Study
Abstract
Background: The extremes of maternal pre-pregnancy body mass index (BMI) are known to be risk factors associated with obstetric and adverse perinatal outcomes. Among Japanese women aged 20 years or older, the prevalence of underweight (BMI < 18.5 kg/m2) was 11.5% in 2019. Maternal thinness is a health problem caused by the desire to become slim. This study aimed to investigate the association between the severity of maternal low pre-pregnancy BMI and adverse perinatal outcomes, including preterm birth (PTB), low birth weight (LBW), and small-for-gestational age (SGA).
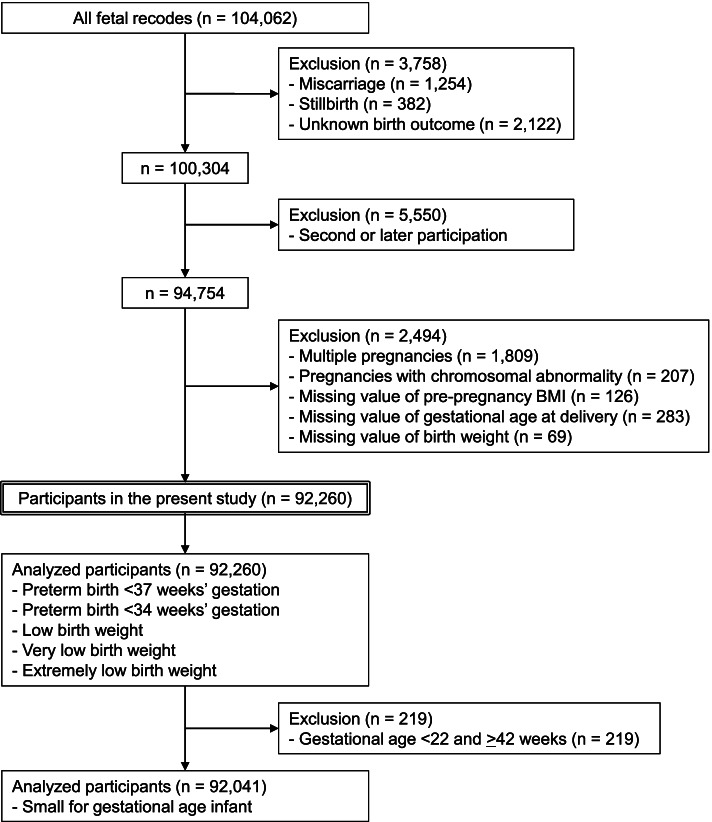
Methods: We conducted a prospective cohort study using data from the Japan Environment and Children's Study, which recruited pregnant individuals between 2011 and 2014. Pre-pregnancy BMI was categorized as severe-moderate underweight (BMI < 16.9 kg/m2), mild underweight (BMI, 17.0-18.4 kg/m2), low-normal weight (BMI, 18.5-19.9 kg/m2), high-normal weight (BMI, 20.0-22.9 kg/m2), overweight (BMI, 23.0-24.9 kg/m2), and obese (BMI ≥ 25.0 kg/m2). The high-normal weight group was used as the reference for statistical analyses. Adjusted logistic regression was performed to evaluate the association between pre-pregnancy BMI and PTB, LBW, and SGA.
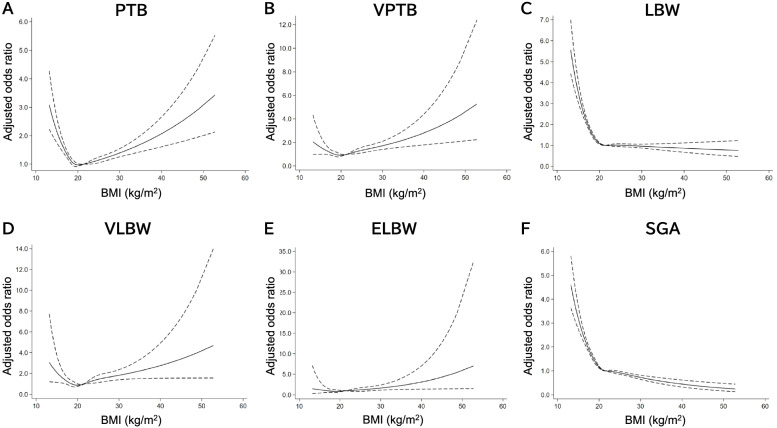
Results: Of 92,260 singleton pregnant individuals, the prevalence was 2.7% for severe-moderate underweight, 12.9% for mild underweight, and 24.5% for low-normal weight. The prevalence of adverse outcomes was 4.6% for PTB, 8.1% for LBW, and 7.6% for SGA. The adjusted odds ratios (aORs) for PTB were 1.72 (95% confidence interval [CI], 1.46-2.03) for severe-moderate underweight and 1.26 (95% CI, 1.14-1.39) for mild underweight. The aORs of LBW were 2.55 (95% CI, 2.27-2.86) for severe-moderate underweight, 1.64 (95% CI, 1.53-1.76) for mild underweight, and 1.23 (95% CI, 1.16-1.31) for low-normal weight. The aORs of SGA were 2.53 (95% CI, 2.25-2.84) for severe-moderate underweight, 1.66 (95% CI, 1.55-1.79) for mild underweight, and 1.29 (95% CI, 1.21-1.38) for low-normal weight.
Conclusions: A dose-response relationship was found between the severity of low pre-pregnancy BMI and PTB, LBW, and SGA. Even low-normal BMI (18.5-19.9 kg/m2) increased the risk of LBW and SGA. This study provides useful information for pre-conception counseling in lean individuals.
Keywords: Adverse perinatal outcomes; Low birth weight; Maternal body mass index; Preterm birth; Small-for-gestational age.
© 2022. The Author(s).
Conflict of interest statement
The authors declare that they have no competing interests.
Figures
References
-
- Santos S, Voerman E, Amiano P, Barros H, Beilin LJ, Bergström A, Charles MA, Chatzi L, Chevrier C, Chrousos GP, et al. Impact of maternal body mass index and gestational weight gain on pregnancy complications: an individual participant data meta-analysis of European, North American and Australian cohorts. BJOG. 2019;126(8):984–995. doi: 10.1111/1471-0528.15661. - DOI - PMC - PubMed
MeSH terms
LinkOut - more resources
Full Text Sources
Research Materials
