. 2022 Apr 7;30(4):510-521.e3.
doi: 10.1016/j.str.2022.01.006. Epub 2022 Feb 10.

Soft X-ray tomography to map and quantify organelle interactions at the mesoscale

Affiliations

Soft X-ray tomography to map and quantify organelle interactions at the mesoscale

Valentina Loconte et al. Structure. .

Abstract

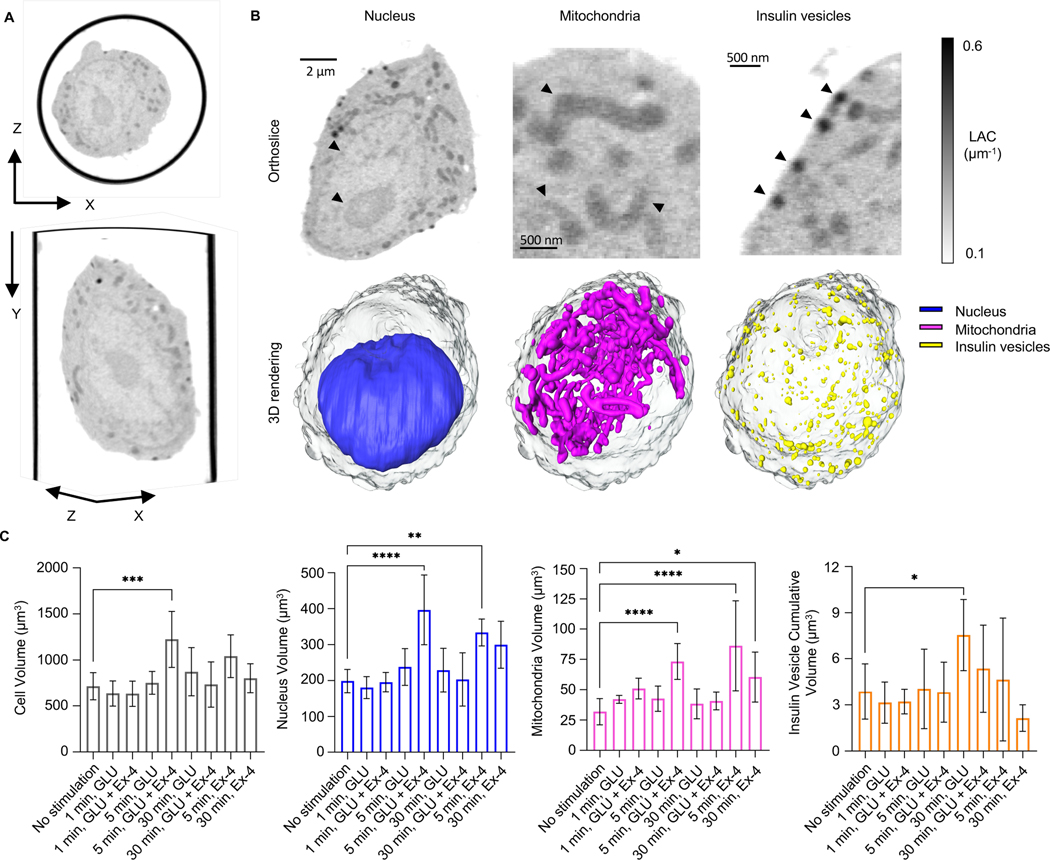
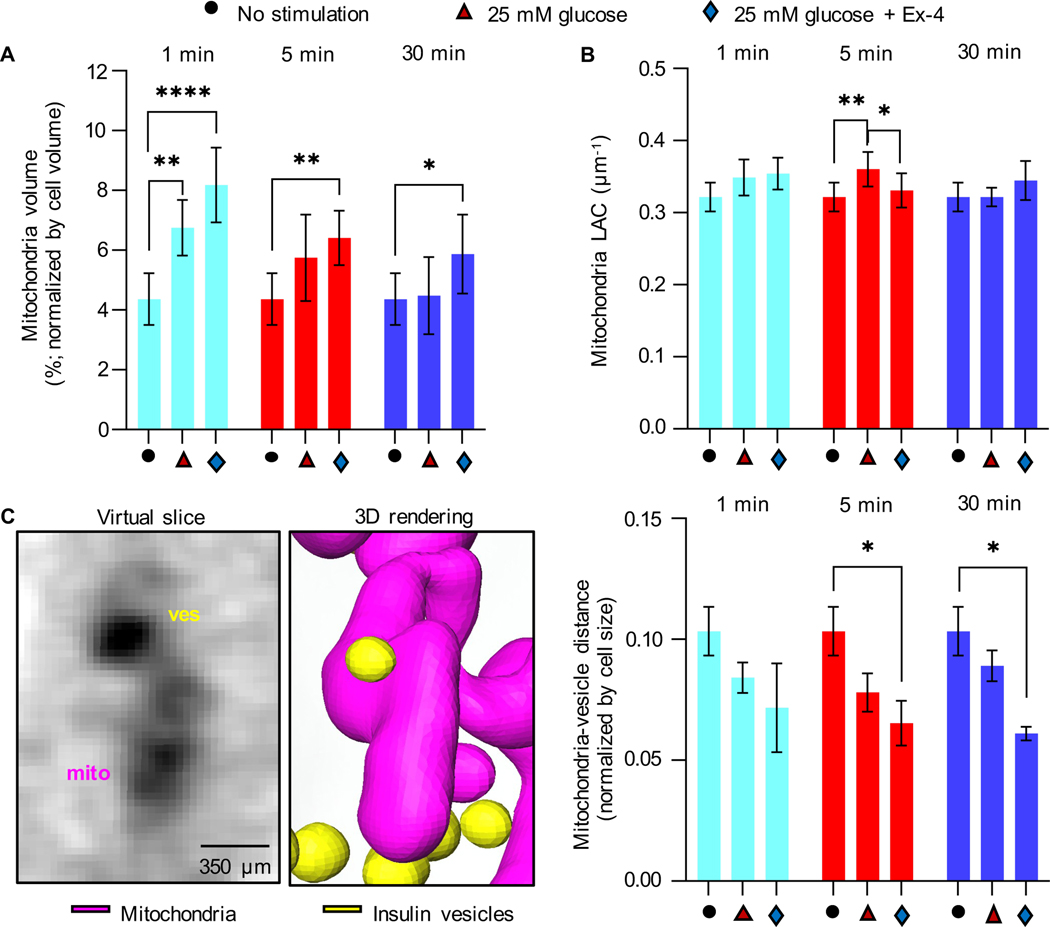
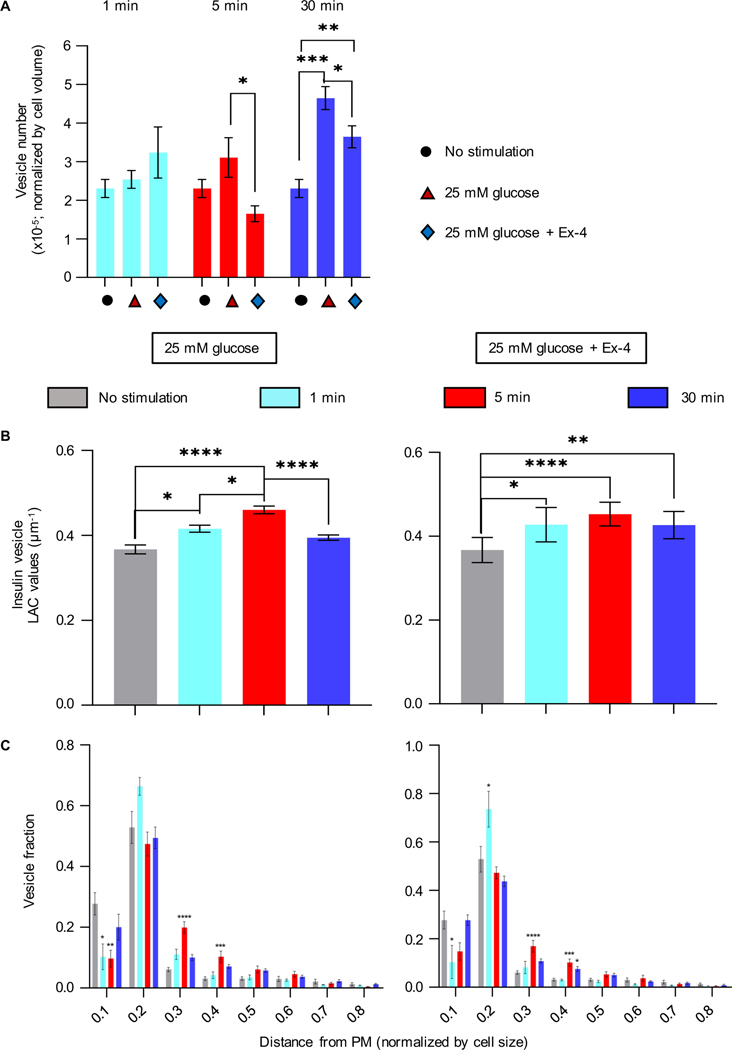
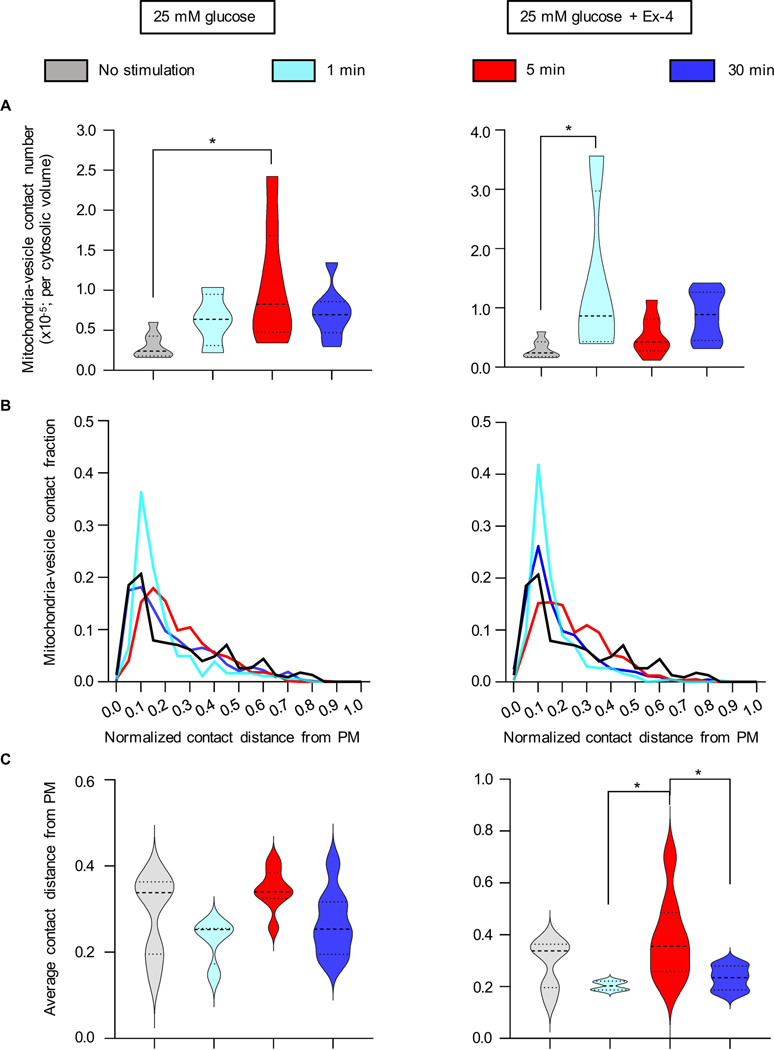
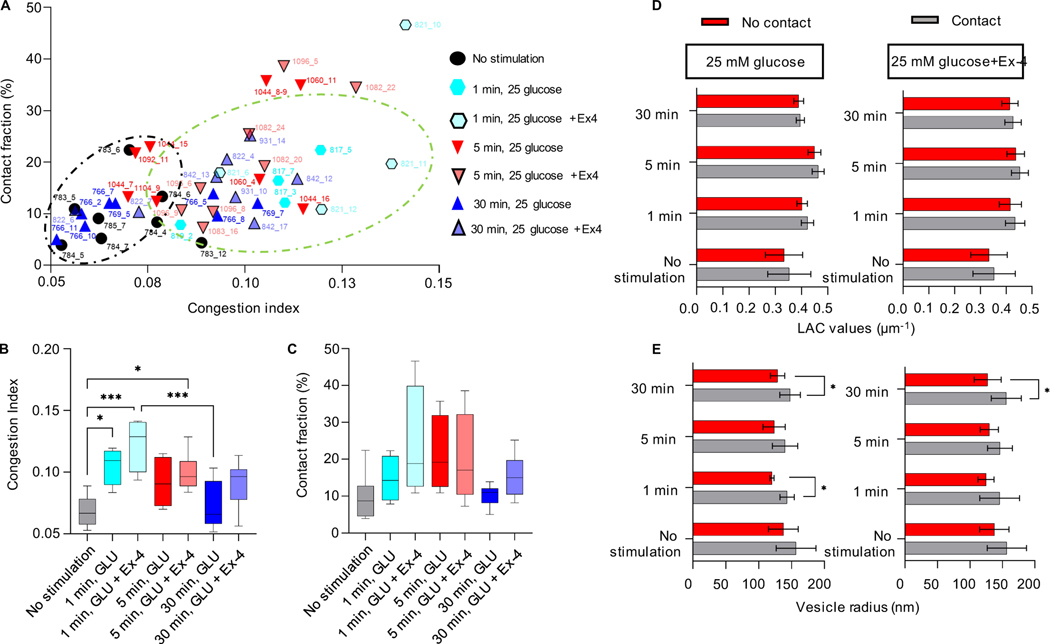
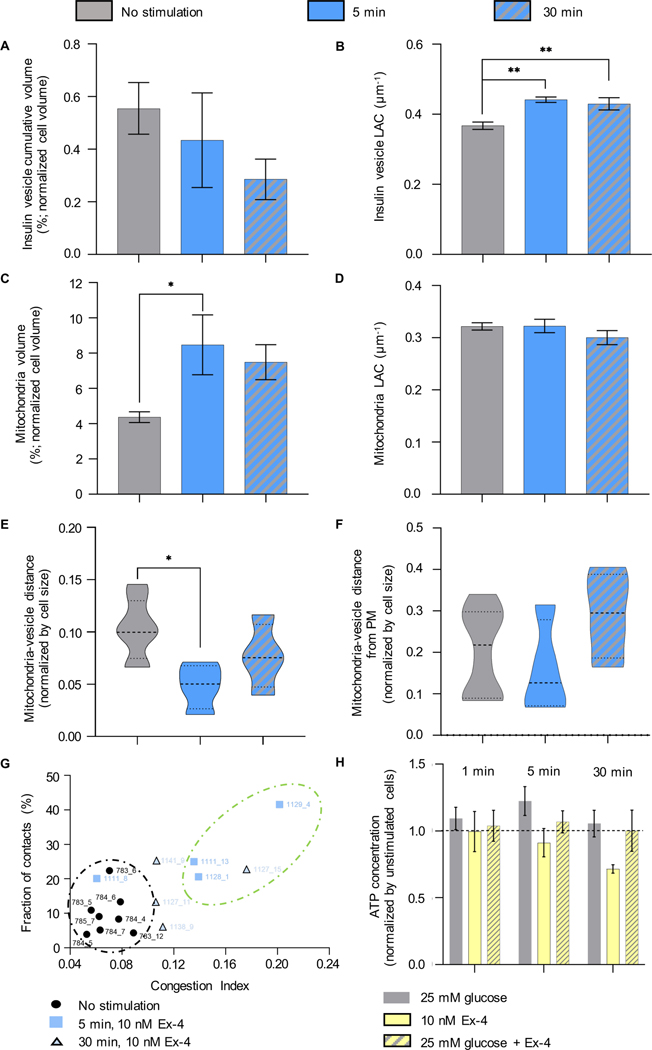
Inter-organelle interactions are a vital part of normal cellular function; however, these have proven difficult to quantify due to the range of scales encountered in cell biology and the throughput limitations of traditional imaging approaches. Here, we demonstrate that soft X-ray tomography (SXT) can be used to rapidly map ultrastructural reorganization and inter-organelle interactions in intact cells. SXT takes advantage of the naturally occurring, differential X-ray absorption of the carbon-rich compounds in each organelle. Specifically, we use SXT to map the spatiotemporal evolution of insulin vesicles and their co-localization and interaction with mitochondria in pancreatic β cells during insulin secretion and in response to different stimuli. We quantify changes in the morphology, biochemical composition, and relative position of mitochondria and insulin vesicles. These findings highlight the importance of a comprehensive and unbiased mapping at the mesoscale to characterize cell reorganization that would be difficult to detect with other existing methodologies.

Keywords: 3D cell mapping; mesoscale analysis; organelle interaction; pancreatic β cell; soft X-ray tomography.


Conflict of interest statement

Declaration of interests The authors declare no competing interests.

Figures

Figure 1:
Figure 1:. Isotropic reconstruction of a single pancreatic β-cell.
A) The whole cell volume is shown in the XY (bottom) and XZ plane (top). B) Organelles are imaged based on different levels of grey values, with a threshold between 0.1–0.6 μm−1. Single orthoslices (top) and relative 3D rendering (bottom) represent a single β-cell after 1 min of high glucose treatment (cell ID: 821_12). In detail, the rendering shows: nucleus (blue); mitochondrial network (magenta), and insulin vesicles (yellow) and their spatial distribution. All organelles in the orthoslices are highlighted by an arrowhead. C) Plots representing the overall volume of the organelle in the cells per condition and timepoint. We report alteration in the total volume of each type of organelles, in the following order: from left, changes in cell volume with signific difference between 5 min stimulated cells with high glucose+Ex-4 and no stimulated cells (***P=0.0002); changes in the nucleus volume with significant difference between no stimulated cells and 5 min stimulated cells with high glucose+Ex-4 (****P<0.0001), and 5 min stimulated cells with 10 nM Ex-4 (**P=0.0058); changes in the volume of the mitochondrial network with significant difference between no stimulated cells and 5 min stimulated cells with high glucose+Ex-4 (****P<0.0001), 5 min stimulated cells with Ex4 (****P<0.0001), and 30 min stimulated cells with Ex-4 (*P=0.0189); and finally, changes in the insulin vesicle cumulative volume with significant difference between no stimulated cells and 30 min stimulated cell with high glucose (*P=0.0170). Statical significance was validated using Dunnett’s multiple comparison test.
Figure 2:
Figure 2:. Effect of glucose and Ex-4 stimulation on mitochondria properties and spatial distribution.
A) Percentage of cell volume occupied by mitochondria for each condition and time point. Compared to unstimulated cells, a significant difference is observed after 1 min (****P<0.001 and **P=0.042), 5 min (**P=0.0035), and 30 min (*P=0.0460) of stimulation with high glucose±Ex-4 (Tukey’s multiple comparison test). B) Mean mitochondria LAC value. Significant difference is observed between unstimulated cells and cells stimulated with 25 mM glucose for 5 min (**P=0.0071), and between 25 mM glucose vs. 25 mM glucose+10 nM Ex-4 stimulated cells for 5 min (*P=0.0426). Statistical significance was evaluated using Tukey’s multiple comparison test. C) Left: An orthoslice and 3D rendering of interacting insulin vesicles and mitochondria after 1 min of stimulation with high glucose. Right: mean distance between insulin vesicles and mitochondria normalized by cell size shows a significant decrease in the distance between unstimulated and glucose+Ex-4 stimulated cells after 5 min and 30 min (respectively, *P=0.0269 and *P=0.0121. Tukey’s multiple comparison test). Error bars represent SDs.
Figure 3:
Figure 3:. Effect of the high glucose stimulation with and without Ex-4 on insulin vesicle properties and spatial distribution.
A) Number of Insulin vesicles during the two phases of insulin secretion. There was no significant change in the number of vesicles after 1 minute stimulation with glucose alone or in the presence of Ex-4. A significant increase in vesicle numbers was seen at 30 min post stimulation with glucose alone (787±204, ****P<0.0001) and with glucose+Ex-4 (515±156, **P=0.0062), compared with unstimulated cells (319±93). Fewer vesicles were seen after stimulation with glucose+Ex-4 at both 5 (*P=0.0191) and 30 min (*P=0.0436) than when stimulated by glucose alone. B) Mean vesicle LAC values. Left: Treatment with 25 mM glucose. Insulin vesicle LAC values steadily increase after 1 min stimulation, from 0.37±0.03 μm−1 to 0.42±0.02 (*P=0.0138) and to 0.46±0.02 μm−1 after 5 min stimulation (****P<0.0001); there is also a significant difference in the increase between 1- and 5-min stimulation (*P=0.264). At 30 min post stimulation with glucose, there is a significant decrease in LAC value to 0.40±0.02 μm−1 compared with the LAC seen at 5 min post stimulation (****P<0.0001). Right: Treatment with 25 mM glucose+Ex-4. An increase in LAC values after stimulation is seen after 1 min glucose+Ex4 to 0.44±0.04 μm−1 (*P=0.0226), at 5 min to 0.45±0.03 μm−1 (****P<0.0001), and at 30 min to 0.43±0.03 μm−1 (**P=0.0051) (Tukey’s multiple comparison test). C) Plots representing the position of vesicles in the cell as normalized distance from the PM (0.0 is the closest distance to PM and 1.0 the farthest). With respect to the unstimulated cells, significant differences in vesicle population are found for 25 mM glucose-stimulated cells (left panel) within 0.1 from the PM (1 min stimulation: *P=0.0316, and 5 min: **P=0.0040), 0.2–0.3 (5 min stimulation: ****P<0.0001), and 0.3–0.4 (5 min stimulation: ***P=0.005); the same analysis is performed for 25 mM glucose+Ex-4 stimulated cells (right panel), with differences within 0.1 from the PM (1 min stimulated cells: *P=0.0337), 0.1–0.2 (1 min: *P=0.0129), 0.2–0.3 (5 min stimulated cells: ****P<0.0001), 0.3–0.4 (5 min: ***P=0.006 and *P=0.0488) (Dunnett’s multiple comparison test).
Figure 4:
Figure 4:. Quantification of the spatial distribution of mitochondria-insulin vesicle contacts and localization with respect to PM.
A) Comparison of the number of mitochondria-insulin vesicle contacts per cell normalized by cytosolic volume. The mean value of contacts at each time shows a significant difference between unstimulated and 5-min stimulated cells with high glucose (*P=0.0126) (left panel), and 1-min stimulated cells with 25mM glucose+Ex-4 (*P=0.0267) (right panel) (Tukey’s multiple comparison test). B) Frequency distribution of mitochondria-vesicle contacts with respect to the PM; the distance is normalized by cell size. C) Average distance from the PM after 25 mM glucose of stimulation (left) and 25 mM glucose+Ex-4 (right). No significance difference was seen in cells treated with glucose alone. A significant difference in the distance was observed after 5-min stimulation with glucose+Ex-4 with respect to 1 min (*P=0.0453) and 30 min (*P=0.0397) (Tukey’s multiple comparison test).
Figure 5:
Figure 5:. Analysis of the mitochondria-insulin vesicle interaction randomness.
A) The plot shows the correlation between the number of mitochondria-vesicle contacts and the congestion index (C.I.) per individual cell. The black circle shows clusters of cells with less crowding (lower C.I., 0.05–0.08) and percentage of contacts (3–12%); the green circle shows those with more crowding (higher C.I., 0.08–0.14) and percentage of contacts (425%) under different conditions. B) Mean value of the C.I. for each condition. Significant difference is reported between no stimulated cells and 1 min glucose stimulated cells (*P=0.0210), 1 min glucose+Ex-4 stimulated cells (***P=0.0002), and 5 min glucose+Ex-4 stimulated cells (*P=0.0153); significant difference is also reported between 1 min glucose+Ex-4 stimulated cells and 30 min glucose stimulated cells (***P=0.0007). C) Mean value of the faction of contacts per condition. D) Plot showing the LAC values of vesicles in contact (grey) and not in contact (red) with mitochondria, at each time point and stimulation, with no significant difference. E) Changes in the vesicle size whether in contact with the mitochondria network (grey) or not (red). The plot shows a significant difference between the size of vesicle after 1 min stimulation with glucose (143±11 nm contacts; 120±3.0 nm no contacts, *P=0.0195), 30 min stimulation with high glucose (148±16 nm contacts; 129±11 nm no contacts, *P=0.0147) and high glucose+Ex-4 (155±23 nm contacts; 127±21 nm no contacts, *P=0.0211). Error bars represent the SDs, and the statistical significance was evaluated using Welsh’s test.
Figure 6:
Figure 6:. Effect of Ex-4 on the organelle properties.
A) Percentage of cell volume occupied by insulin vesicles in unstimulated, 5-min, and 30-min post stimulation with 10 nM Ex-4. B) LAC of insulin vesicles treated with Ex-4. Statistical significance was found between the unstimulated (0.37±0.03μm−1) and 5-min (0.44±0.02μm−1, **P=0.0026) and 30-min 0.43±0.04μm−1, **P=0.0089) post stimulation. C) Percentage of cell volume occupied by the mitochondrial network. Statistical significance was observed after stimulating the cells for 5 min with Ex-4 (8.47±3.40%, *P=0.0133), compared to unstimulated cells (4.37±0.86%). D) There were no significant differences in LAC values for mitochondria treated for 5 (0.32±0.03μm−1), and 30 min (0.30±0.03μm1) with Ex-4 compared with untreated cells (0.32±0.02μm−1). E) There was a significant difference in the mean distance between mitochondria and insulin vesicles in unstimulated cells and cells treated for 5-min (*P=0.0166). F) There was no significant difference in mitochondria-vesicle contacts at different distances from the PM (normalized by cell size) between unstimulated cells and after 5, and 30 min of stimulation. G) Correlation between C.I. and fraction of vesicles in contact with mitochondria in unstimulated cells and cells after 5-, and 30-min of stimulation with Ex-4. Two clusters are highlighted: the black circle shows cells with low C.I. (0.04–0.08) and fraction of contact; the green circle shows cells with high C.I. (0.12–0.20) and high fraction of contacts (20–42%). H) ATP concentration of cells treated with high glucose±Ex-4 and Ex-4 alone. The ATP concentration for each condition is normalized by the ATP concentration in unstimulated cells. The black line shows the distance between the ATP value in the unstimulated cells and cells treated with glucose and Ex-4. In all panels, statistical significance was evaluated using Tukey’s multiple comparison test.

Similar articles

Cited by

References

    1. Attwood D. (2007). Soft x-rays and extreme ultraviolet radiation: principles and applications (Cambridge University Press; ).
    1. Bratanova-Tochkova TK, Cheng H, Daniel S, Gunawardana S, Liu Y-J, Mulvaney-Musa J, Schermerhorn T, Straub SG, Yajima H, and Sharp GWG (2002). Triggering and Augmentation Mechanisms, Granule Pools, and Biphasic Insulin Secretion. Diabetes 51, S83. - PubMed
    1. Buckley G, Gervinskas G, Taveneau C, Venugopal H, Whisstock JC, and de Marco A. (2019). Automated cryo-lamella preparation for high-throughput in-situ structural biology. bioRxiv. - PubMed
    1. Carlessi R, Chen Y, Rowlands J, Cruzat VF, Keane KN, Egan L, Mamotte C, Stokes R, Gunton JE, Bittencourt P.I.H.d., et al. (2017). GLP-1 receptor signalling promotes β-cell glucose metabolism via mTOR-dependent HIF-1α activation. Scientific Reports 7, 2661. - PMC - PubMed
    1. Chichón FJ, Rodríguez MJ, Pereiro E, Chiappi M, Perdiguero B, Guttmann P, Werner S, Rehbein S, Schneider G, Esteban M, et al. (2012). Cryo X-ray nano-tomography of vaccinia virus infected cells. Journal of Structural Biology 177, 202–211. - PMC - PubMed

Publication types