. 2022 Mar 17;185(6):1025-1040.e14.
doi: 10.1016/j.cell.2022.01.018. Epub 2022 Jan 25.

Immune imprinting, breadth of variant recognition, and germinal center response in human SARS-CoV-2 infection and vaccination

Affiliations

Immune imprinting, breadth of variant recognition, and germinal center response in human SARS-CoV-2 infection and vaccination

Katharina Röltgen et al. Cell. .

Abstract

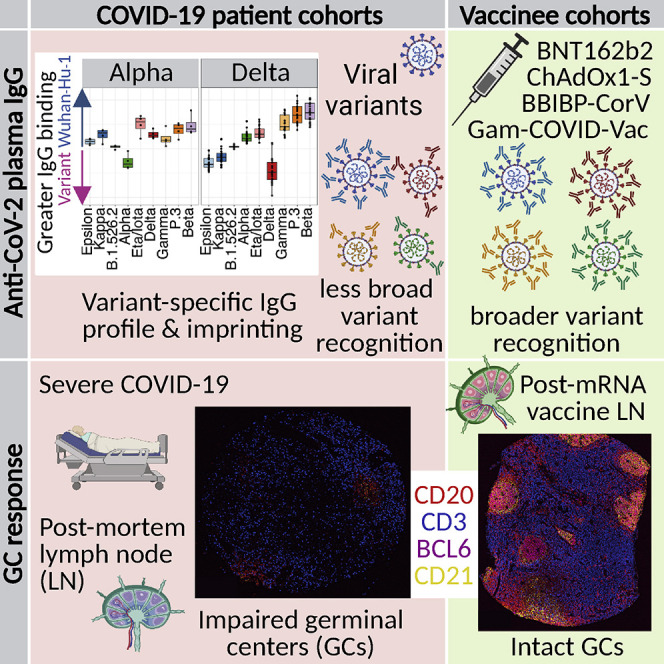
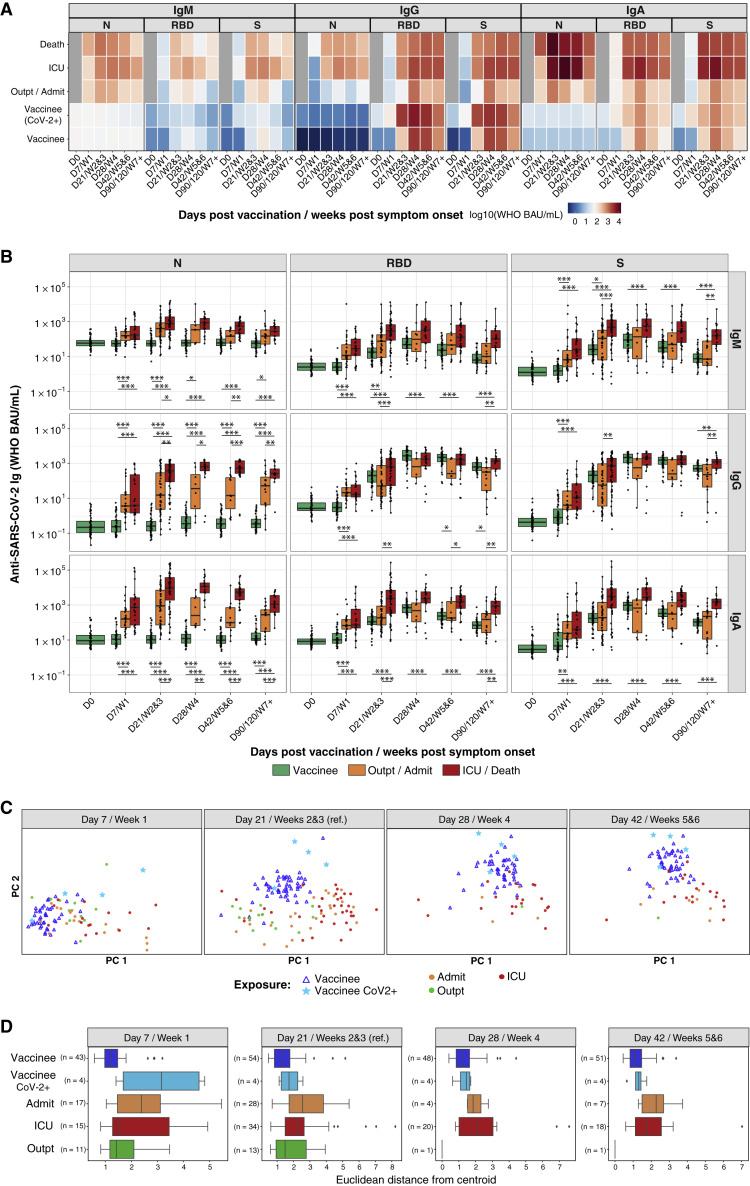
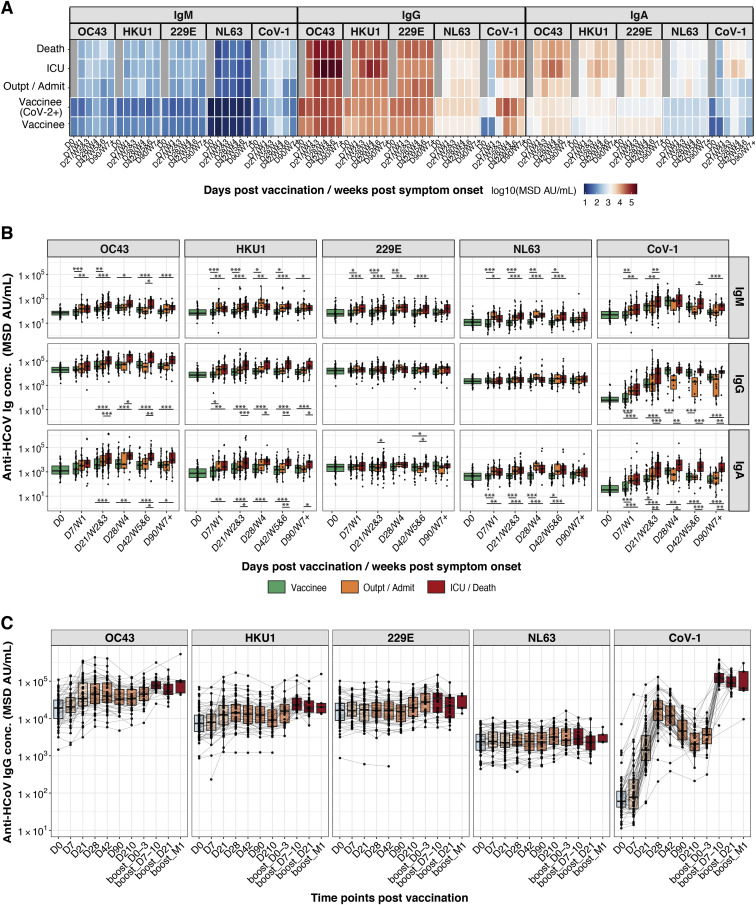
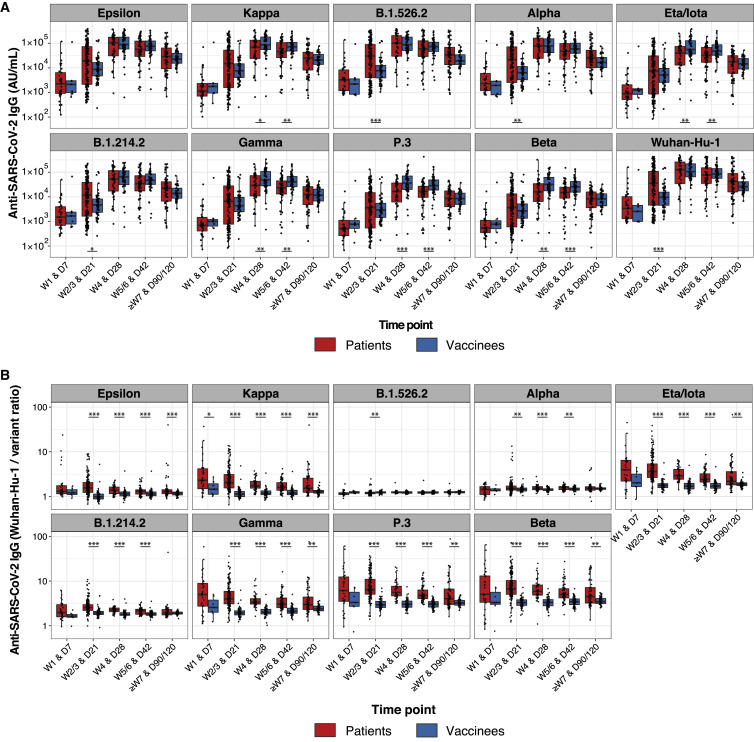
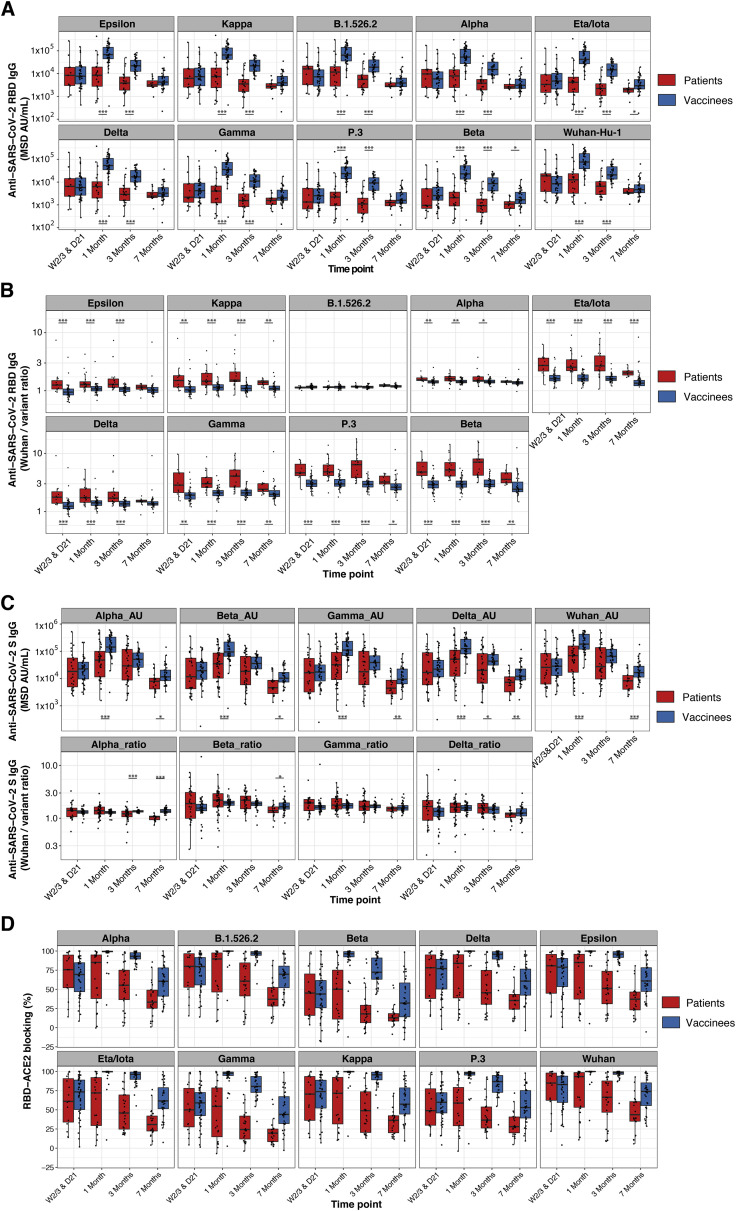
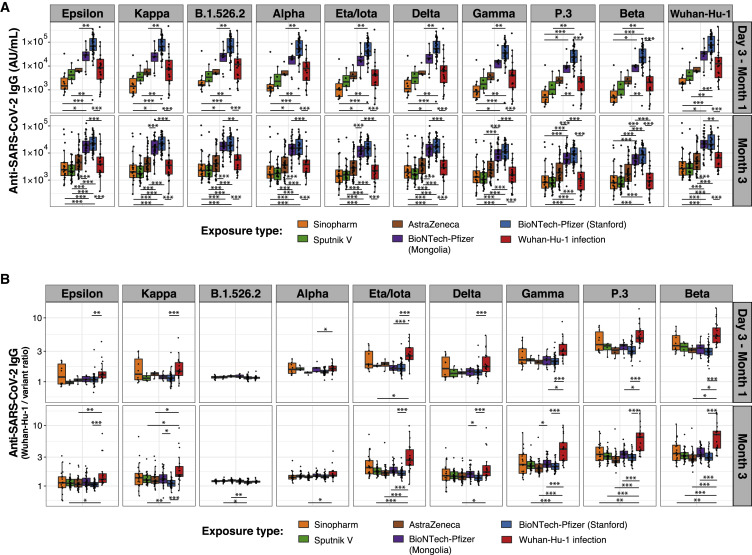
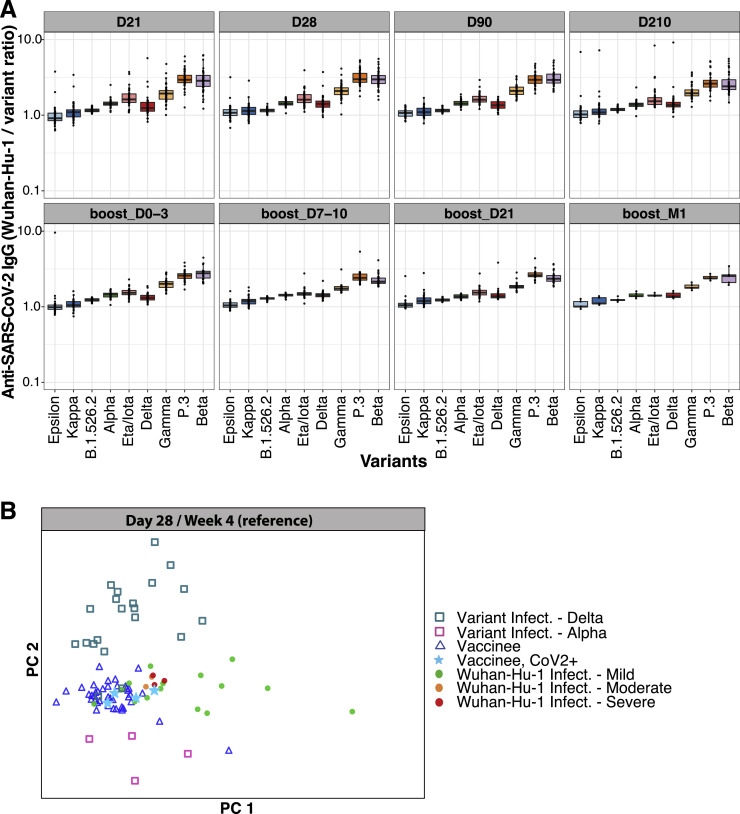
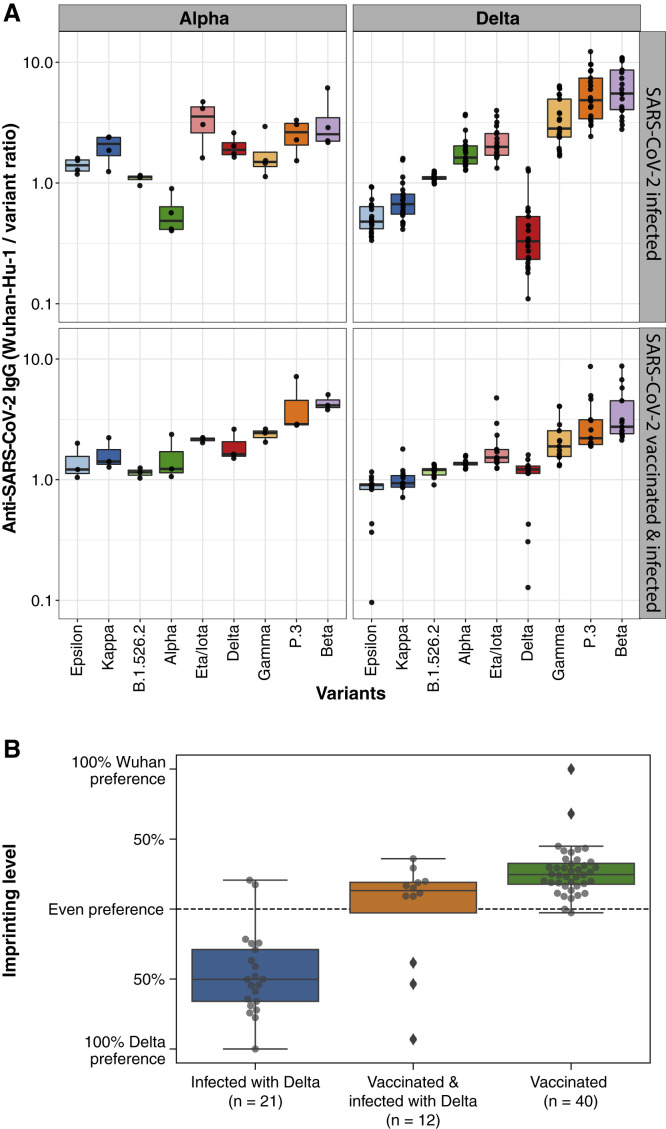
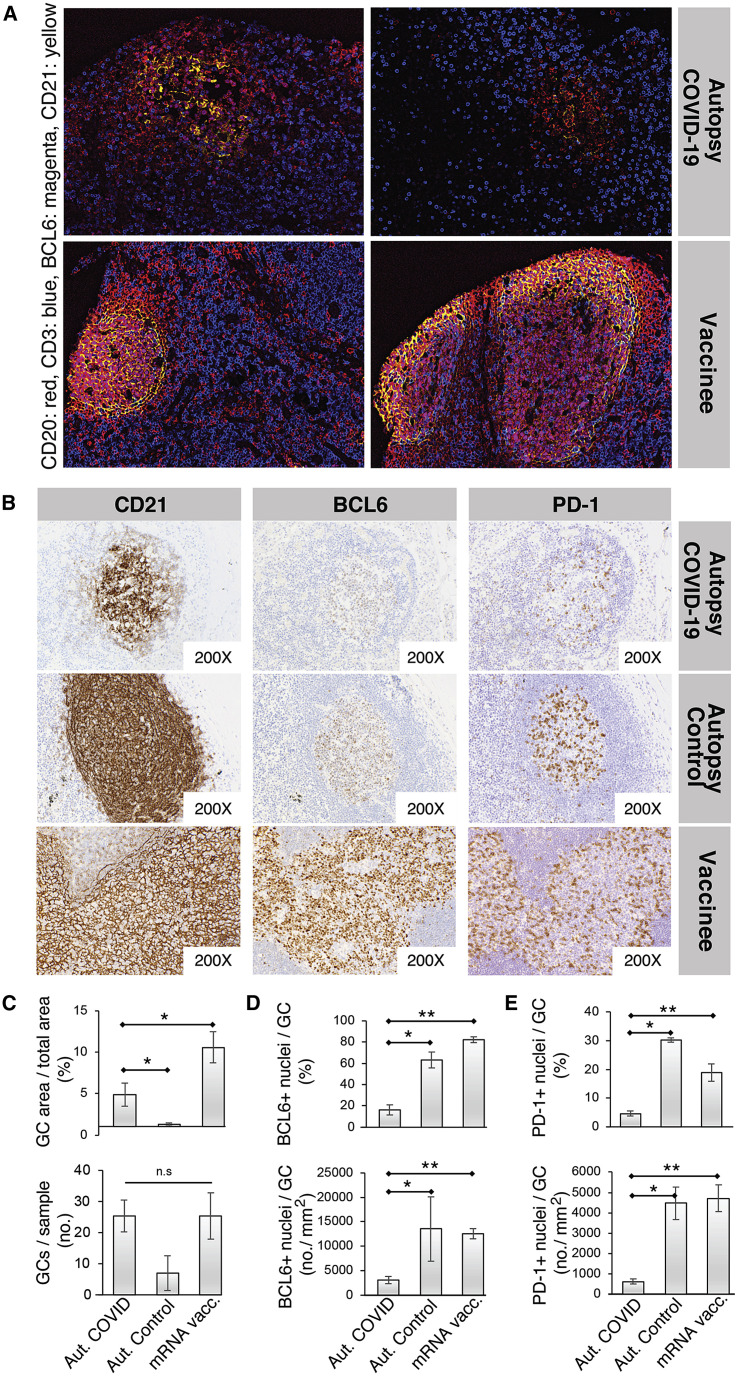
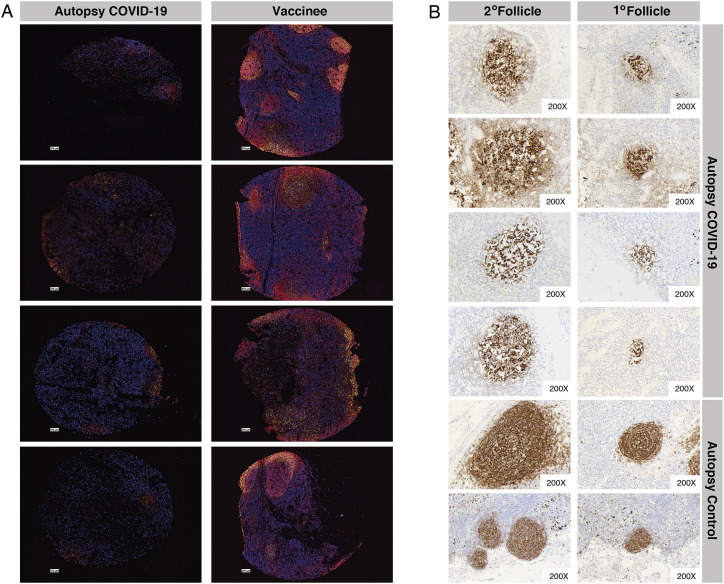
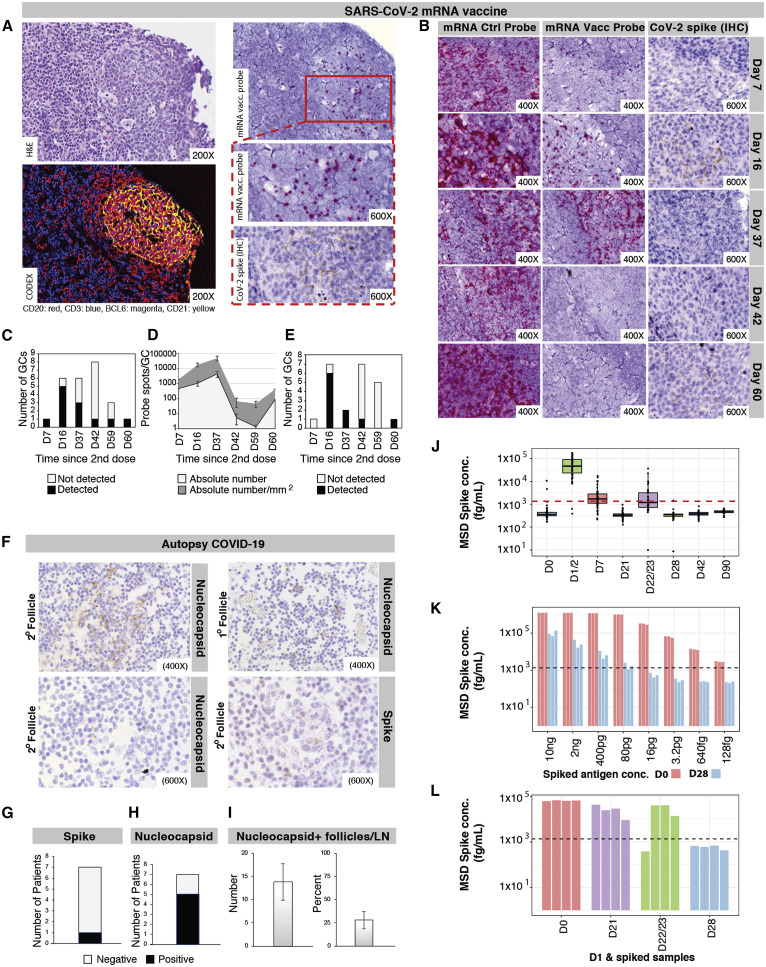
During the SARS-CoV-2 pandemic, novel and traditional vaccine strategies have been deployed globally. We investigated whether antibodies stimulated by mRNA vaccination (BNT162b2), including third-dose boosting, differ from those generated by infection or adenoviral (ChAdOx1-S and Gam-COVID-Vac) or inactivated viral (BBIBP-CorV) vaccines. We analyzed human lymph nodes after infection or mRNA vaccination for correlates of serological differences. Antibody breadth against viral variants is lower after infection compared with all vaccines evaluated but improves over several months. Viral variant infection elicits variant-specific antibodies, but prior mRNA vaccination imprints serological responses toward Wuhan-Hu-1 rather than variant antigens. In contrast to disrupted germinal centers (GCs) in lymph nodes during infection, mRNA vaccination stimulates robust GCs containing vaccine mRNA and spike antigen up to 8 weeks postvaccination in some cases. SARS-CoV-2 antibody specificity, breadth, and maturation are affected by imprinting from exposure history and distinct histological and antigenic contexts in infection compared with vaccination.

Keywords: Astra Zeneca; BBIBP-CorV; BNT162b2; BioNTech-Pfizer; COVID-19; ChAdOx1-S; Delta variant; Gam-COVID-Vac; Moderna; SARS-CoV-2; SARS-CoV-2 variants of concern; Sinopharm; Sputnik V; antibodies; autopsy; endemic coronaviruses; imprinting; lymph node germinal center; mRNA-1273; vaccine.


Conflict of interest statement

Declaration of interests S.D.B. has consulted for Regeneron, Sanofi, Novartis, and Janssen on topics unrelated to this study and owns stock in AbCellera Biologics. K.C.N. reports grants from the National Institute of Allergy and Infectious Diseases (NIAID), Food Allergy Research & Education (FARE), End Allergies Together (EAT), National Heart Lung and Blood Institute (NHLBI), and National Institute of Environmental Health Sciences (NIEHS). K.C.N. is Director of FARE and World Allergy Organization (WAO) Center of Excellence at Stanford; Adviser at Cour Pharmaceuticals; Cofounder of Before Brands, Alladapt, Latitude, and IgGenix; National Scientific Committee member for the Immune Tolerance Network (ITN) of NIAID; recipient of a Research Sponsorship from Nestle; Consultant and Advisory Board Member at Before Brands, Alladapt, IgGenix, NHLBI, and ProBio; and Data and Safety Monitoring Board member at NHLBI. J.L.W., J.N.W., and G.B.S. are employees of Meso Scale Diagnostics (MSD).

Figures

None
Graphical abstract
Figure 1
Figure 1
Magnitude and duration of anti-SARS-CoV-2 IgG following BNT162b2 vaccination and third-dose boost (A) Anti-SARS-CoV-2 N, RBD, and spike (S) antibody responses are shown for plasma samples from individuals who received BNT162b2 prime (D0, n = 59 individuals), second dose (D21, n = 58 individuals), and third dose (around month 9, n = 36 individuals) vaccination. Box-whisker plots of the anti-SARS-CoV-2 IgG concentrations in WHO BAU/mL show the interquartile range as the box and the whisker ends as the most extreme values within 1.5 times the interquartile range below the 25% quantile and above the 75% quantile. Red dashed lines indicate the cutoff values for the positivity of each assay (MSD, package insert). (B) Heatmap showing the development of antibody responses in longitudinal samples collected at D0, D7, D21, D28, D42, and D90/120 time points post-prime vaccination (x axis). WHO BAU/mL Ig concentrations are displayed for study participants sorted by age (y axis, color coded). Rows are labeled on the right with “CoV-2+” for participants with a previous SARS-CoV-2 RT-qPCR positive test result. (C) Correlations between anti-RBD and anti-spike IgG binding antibody concentrations in WHO BAU/mL and SARS-CoV-2 virus neutralization assays. Spearman rank correlation (coefficient = Rho, displayed in the plot for each assay comparison) was used to assess the strength of correlation between binding antibody concentrations and virus neutralization results. Red dashed lines indicate the cutoff values for the positivity of each assay (MSD, package insert).
Figure S1
Figure S1
Anti-SARS-CoV-2 Ig antibody responses in plasma and saliva following BNT162b2 vaccination, related to Figure 1 Anti-SARS-CoV-2 N, RBD, and spike (S) IgG (A), IgM (B), and IgA (C) responses are shown for plasma from individuals who received BNT162b2 prime (D0, n = 59) and second dose (D21, n = 58) vaccination. Box-whisker plots of the WHO binding arbitrary unit (BAU/mL) anti-SARS-CoV-2 concentrations show the interquartile range as the box and the whisker ends as the most extreme values within 1.5 times the interquartile range below the 25% quantile and above the 75% quantile. Comparisons between groups of previously SARS-CoV-2-infected (CoV-2+) versus noninfected individuals, and female versus male were by the two-sided Wilcoxon rank sum test; comparison between age groups (<40; 40–60; >60 years) was done using pairwise Wilcoxon rank sum test with Bonferroni correction. p < 0.05, ∗∗p < 0.01, ∗∗∗p < 0.001. (D) Anti-SARS-CoV-2 N, RBD, and S IgG concentrations in BAU/mL are shown for saliva from individuals who received BNT162b2 prime/boost and third dose vaccination (upper left panel). Anti-SARS-CoV-2 N, RBD, and S (upper right panel) concentrations in BAU/mL, as well as anti-SARS-CoV-1 and anti-HCoV-OC43, -HKU1, -NL63, and -229E S IgG (lower panel) concentrations in MSD arbitrary units (AU/mL), are shown for saliva collected on D42 after BNT162b2 prime vaccination (vaccinee), around D42 post-symptom onset for COVID-19 patients (CoV-2+), and before the onset of the COVID-19 pandemic for pre-pandemic healthy human controls (Pre-pan). Box-whisker plots of anti-SARS-CoV-2 IgG concentrations show the interquartile range as the box and the whisker ends as the most extreme values within 1.5 times the interquartile range below the 25% quantile and above the 75% quantile. Statistical test for significance between groups (CoV-2+; Pre-pan, vaccinee) was performed using pairwise Wilcoxon rank sum test with Bonferroni correction. p < 0.05, ∗∗p < 0.01, ∗∗∗p < 0.001.
Figure S2
Figure S2
The magnitude of antibody responses is not correlated with reported vaccine-associated side effects (SEs), related to Figure 1 (A) Frequency of site-specific and systemic vaccine-associated SEs after prime (light green) and second dose (dark green) BNT162b2 vaccination. (B) Box-whisker plots of the MSD AU/mL anti-SARS-CoV-2 IgG concentrations in BNT162b2 vaccinee plasma collected on D28 postvaccination show the interquartile range as the box and the whisker ends as the most extreme values within 1.5 times the interquartile range below the 25% quantile and above the 75% quantile. For a given SE (rows), vaccinees were grouped according to no SE reported (“No,” colored in blue) or SE reported (“Yes,” colored in orange). Vaccinees where SEs were unknown are shown as white boxplots.
Figure 2
Figure 2
BNT162b2 vaccination and SARS-CoV-2 infection elicit distinct antibody profiles (A and B) Anti-SARS-CoV-2 N, RBD, and spike (S) IgM, IgG, and IgA antibody responses are shown for individuals who received BNT162b2 prime (D0) and second (D21) vaccination doses and for COVID-19 patients. (A) The heatmap shows the development of antibody responses in longitudinal samples from vaccinees/patients collected at D0, D7/week 1, D21/weeks 2 and 3, D28/week 4, D42/weeks 5 and 6, and D90/120/≥week 7 after vaccination/COVID-19 symptom onset (x axis). The color scale encodes the median values of log10 WHO BAU/mL Ig concentrations. (B) Box-whisker plots show the development of antibody responses in longitudinal samples from vaccinees/patients collected at D0, D7/week 1, D21/weeks 2 and 3, D28/week 4, D42/weeks 5 and 6, and D90/120/≥week 7 after vaccination/COVID-19 symptom onset (x axis). Box-whisker plots show the interquartile range as the box and the whisker ends as the most extreme values within 1.5 times the interquartile range below the 25% quantile and above the 75% quantile. Statistical test: pairwise Wilcoxon rank sum test with Bonferroni correction. p < 0.05, ∗∗p < 0.01, ∗∗∗p < 0.001. Individuals were classified as outpatients (Outpt) and hospital-admitted patients (Admit); ICU patients and those who died from their illness (Death); and vaccinees who had (CoV-2+) or had not had a positive SARS-CoV-2 test in the past. (C) PCA of anti-SARS-CoV-2 RBD, N-terminal domain, and S (but not N) IgM, IgG, and IgA concentrations across BNT162b2 vaccinees and Wuhan-Hu-1-infected Stanford COVID-19 patient cohort 1 at different time points after vaccination/COVID-19 symptom onset visualized on a consistent PCA reference created using D21/weeks 2 and 3 as a reference time point. (D) Distribution of Euclidean distances between BNT162b2 vaccinee samples and their centroid, compared with Wuhan-Hu-1-infected Stanford COVID-19 patient cohort 1 samples and their centroid, at different time points after vaccination/COVID-19 symptom onset.
Figure S3
Figure S3
BNT162b2 vaccination produces less broad serological responses to endemic human coronaviruses (HCoVs) compared with SARS-CoV-2 infection, related to Figure 2 (A and B) Anti-SARS-CoV-1 spike and anti-HCoV-OC43, -HKU1, -NL63, and -229E spike IgM, IgG, and IgA antibody responses are shown for individuals who received BNT162b2 prime (D0) and boost (D21) vaccination doses and for COVID-19 patients. (A) The heatmap shows the development of antibody responses in longitudinal samples from vaccinees/patients collected at/during D0, D7/week 1, D21/weeks 2 and 3, D28/week 4, D42/weeks 5 and 6, and D90/≥week 7 after vaccination/COVID-19 symptom onset (x axis). The color scale encodes the median values of log10 MSD AU/mL concentrations. (B) Box-whisker plots show the development of antibody responses in longitudinal samples from vaccinees/patients collected at/during D0, D7/week 1, D21/weeks 2 and 3, D28/week 4, D42/weeks 5 and 6, and D90/≥week 7 after vaccination/COVID-19 symptom onset (x axis). Box-whisker plots show the interquartile range as the box and the whisker ends as the most extreme values within 1.5 times the interquartile range below the 25% quantile and above the 75% quantile. Statistical test: pairwise Wilcoxon rank sum test with Bonferroni correction. p < 0.05, ∗∗p < 0.01, ∗∗∗p < 0.001. Individuals were classified as vaccinees who have not been previously exposed to SARS-CoV-2 (vaccinees), outpatients (Outpt) and hospital-admitted patients (Admit), and ICU patients and those who died from their illness (Death). (C) Box-whisker plots show anti-SARS-CoV-1 spike and anti-HCoV spike antibody responses in plasma samples from individuals who received BNT162b2 prime (D0, n = 59 individuals), second dose (D21, n = 58 individuals), and third dose (around month 9, n = 36 individuals) vaccination. Box-whisker plots show the interquartile range as the box and the whisker ends as the most extreme values within 1.5 times the interquartile range below the 25% quantile and above the 75% quantile.
Figure 3
Figure 3
Greater breadth of IgG binding to SARS-CoV-2 RBD variants following BNT162b2 vaccination compared with infection with Wuhan-Hu-1 SARS-CoV-2 Anti-SARS-CoV-2 Wuhan-Hu-1 and viral variant RBD IgG responses are shown for Stanford individuals who received BNT162b2 vaccination and for Wuhan-Hu-1-infected COVID-19 Stanford patient cohort 1 at different time points after vaccination/COVID-19 symptom onset. Box-whisker plots show the interquartile range as the box and the whisker ends as the most extreme values within 1.5 times the interquartile range below the 25% quantile and above the 75% quantile. Significance between patient and vaccinee groups were tested with two-sided Wilcoxon rank sum test. p < 0.05, ∗∗p < 0.01, ∗∗∗p < 0.001 (A) Anti-RBD IgG concentrations. (B) Ratios of anti-Wuhan-Hu-1 to variant RBD IgG concentration.
Figure S4
Figure S4
Greater breadth of IgG binding to SARS-CoV-2 variant RBDs following BNT162b2 vaccination compared with infection with Wuhan-Hu-1 SARS-CoV-2 (validation cohort), related to Figure 3 (A and B) Anti-SARS-CoV-2 Wuhan-Hu-1 and viral variant RBD IgG responses are shown for Stanford individuals who received BNT162b2 vaccination and for Wuhan-Hu-1-infected COVID-19 Stanford patient cohort 2 at different time points after vaccination/COVID-19 symptom onset. Box-whisker plots show the interquartile range as the box and the whisker ends as the most extreme values within 1.5 times the interquartile range below the 25% quantile and above the 75% quantile. Significance between groups was tested with two-sided Wilcoxon rank sum test. p < 0.05, ∗∗p < 0.01, ∗∗∗p < 0.001. (A) Anti-RBD IgG concentrations. (B) Ratios of anti-Wuhan-Hu-1 to variant RBD IgG concentration. (C) Anti-SARS-CoV-2 Wuhan-Hu-1 and viral variant spike IgG responses as anti-spike IgG concentrations (upper panels) and as ratios of anti-Wuhan-Hu-1 to variant spike IgG concentration (lower panels) are shown for Stanford individuals who received BNT162b2 vaccination and for Wuhan-Hu-1-infected COVID-19 Stanford patient cohorts 1 and 2 samples. Box-whisker plots show the interquartile range as the box and the whisker ends as the most extreme values within 1.5 times the interquartile range below the 25% quantile and above the 75% quantile. Significance between groups was tested with two-sided Wilcoxon rank sum test. p < 0.05, ∗∗p < 0.01, ∗∗∗p < 0.001. (D) Percentage blocking of ACE2 binding to RBD of specified viral variants by plasma antibodies of BNT162b2 vaccinees and Stanford patient cohort 2 samples.
Figure 4
Figure 4
Greater breadth of IgG binding to SARS-CoV-2 variant RBDs following vaccination with four different vaccines compared with infection with Wuhan-Hu-1 SARS-CoV-2 Anti-SARS-CoV-2 Wuhan-Hu-1 and viral variant RBD IgG responses are shown for individuals who received BNT162b2 (BioNTech-Pfizer), ChAdOx1-S (Astra Zeneca), Gam-COVID-Vac (Sputnik V), and BBIBP-CorV (Sinopharm) vaccination and for Wuhan-Hu-1-infected COVID-19 Stanford patient cohort 2 within 1 month and around 3 months after vaccination/COVID-19 symptom onset. Box-whisker plots show the interquartile range as the box and the whisker ends as the most extreme values within 1.5 times the interquartile range below the 25% quantile and above the 75% quantile. Significance between groups was tested with pairwise Wilcoxon rank sum test with Bonferroni correction. p < 0.05, ∗∗p < 0.01, ∗∗∗p < 0.001 (A) Anti-RBD IgG concentrations. (B) Ratios of anti-Wuhan-Hu-1 to variant RBD IgG concentration.
Figure S5
Figure S5
Anti-SARS-CoV-2 RBD IgG signatures following BNT162b2 vaccination and SARS-CoV-2 infection, related to Figure 5 (A) Ratios of anti-Wuhan-Hu-1 to variant RBD IgG concentration are shown for Stanford individuals who received BNT162b2 vaccination at different time points after the second dose (D21, n = 58 individuals) and third dose (around month 9, n = 36 individuals) vaccination. Box-whisker plots show the interquartile range as the box and the whisker ends as the most extreme values within 1.5 times the interquartile range below the 25% quantile and above the 75% quantile. (B) Principal component analysis (PCA) of anti-SARS-CoV-2 Wuhan-Hu-1 and viral variant RBD IgG concentrations across Stanford BNT162b2 vaccinees, Stanford COVID-19 patient cohort 2, and SARS-CoV-2-variant-infected patients.
Figure 5
Figure 5
Variant-specific serological signature following Alpha and Delta SARS-CoV-2 infection (A) Anti-Wuhan-Hu-1 to variant RBD IgG concentration ratios are shown for individuals with primary SARS-CoV-2 Alpha or Delta variant infection (upper panels) or secondary variant infection after vaccination (lower panels). Box-whisker plots show the interquartile range as the box and the whisker ends as the most extreme values within 1.5 times the interquartile range below the 25% quantile and above the 75% quantile. (B) Anti-SARS-CoV-2 variant IgG binding preference levels of BNT162b2 vaccinees on day 28 postvaccination and of previously vaccinated or nonvaccinated individuals infected with the SARS-CoV-2 Delta variant.
Figure 6
Figure 6
Disrupted LN GCs in COVID-19 patients versus mRNA vaccinees (A) Representative LN GC histology of COVID-19 patients and vaccinees evaluated with four-color Codex immunofluorescence analysis for CD20 (B cells), CD3 (T cells), BCL6 (GC B cells [major subset] and follicular helper T cells [minor subset]), and CD21 (follicular dendritic cells). (B) Representative immunohistochemistry of GCs with CD21 (left), BCL6 (middle), and PD-1 (right) in peribronchial LNs of an autopsy patient who died of COVID-19, a control autopsy patient who died from a non-COVID-19 pneumonia (prepandemic), and in an axillary LN of a patient vaccinated with a SARS-CoV-2 mRNA vaccine. (C–E) Relative proportion (upper) and absolute number (lower) of GCs in LNs (C), of BCL6+ cells within GCs (D), and of PD-1+ cells within GCs (E) from COVID-19 autopsy patients (n = 6), control autopsy patients (n = 3), and mRNA-vaccinated patients (n = 7). Quantification performed in QuPath digital pathology analysis software. Wilcoxon rank sum test was used to calculate p values. Error bars represent mean ± SEM. p < 0.03; ∗∗p < 0.003.
Figure S6
Figure S6
Disrupted LN GCs in COVID-19 patients versus mRNA vaccinees, related to Figure 6 (A) LN GC histology for COVID-19 patients (left) and mRNA vaccinees (right) evaluated with four-color codetection by indexing (Codex) immunofluorescence analysis for CD20 (red), CD3 (blue), BCL6 (magenta), and CD21 (yellow) markers of B cells, T cells, GC B cells (or T follicular helper cells), and follicular dendritic cells, respectively. (B) Representative CD21 immunohistochemistry of secondary (left) and primary (right) follicles of four autopsy patients who died of COVID-19 and two control autopsy patients.
Figure 7
Figure 7
Localization of SARS-CoV-2 proteins and vaccine mRNA in LNs (A) Representative LN GC after mRNA vaccination showing hematoxylin and eosin staining (upper left), four-color Codex staining (lower left), in situ hybridization of a SARS-CoV-2 mRNA vaccine-specific probe (upper right [lower magnification] and middle right [greater magnification]), and immunohistochemical (IHC) staining for spike antigen (lower right). Vaccine mRNA probe hybridization was visualized by colorimetric development with Fast Red chromogen, and positive IHC staining for spike antigen was visualized as granular brown color from 3,3′-diaminobenzidine (DAB) reagent. (B) Representative in situ hybridization of an RNAScope control probe (left panels) and SARS-CoV-2 mRNA vaccine-specific probe (middle panels) within ipsilateral axillary core needle LN biopsies of female patients 7–60 days after second mRNA-1273 or BNT162b2 dose. Probe hybridization is indicated by red chromogen spots. IHC signal for spike antigen (right panels) is detected as granular brown staining. (C) Quantification of SARS-CoV-2 mRNA vaccine-specific probe-staining GCs in vaccinated LN biopsies. (D) Quantification of positive SARS-CoV-2 mRNA vaccine-specific probe spots per GC in vaccinee LNs. Error bars represent mean ± SEM. (E) Spike-protein-positive GC quantification from IHC staining of vaccinee LNs. (F) IHC staining for spike (lower right panel) and nucleocapsid (upper panels and lower left panel) antigens in representative sections of COVID-19 patient peribronchial LNs. Nucleocapsid detection in primary (upper right panel) and secondary (upper left panel) LN follicles. (G) Due to the low frequency of detection of spike antigen in COVID-19 patient LNs, quantification is presented as the number of patients with positive staining in their LN specimens. (H) Quantification of the number of COVID-19 patients with LN follicles positive for nucleocapsid IHC staining. (I) Number and percentage of nucleocapsid-positive follicles by IHC in COVID-19 patient LNs. Error bars represent mean ± SEM. (J) Spike concentration measured in plasma samples collected before and at several time points after BNT162b2 vaccination, with the red dotted line indicating the cutoff for positive. (K) Spike concentrations were measured in plasma samples collected from BNT162b2 vaccinees on D0 (spike negative) or D28 (spike positive) spiked with different concentrations of recombinant spike protein. Black dotted line = cutoff for positive. (L) Spike concentration measured in plasma samples collected from BNT162b2 vaccinees on D0, D21, D22/23, and D28 mixed with the same plasma sample collected from one BNT162b2 vaccinee on D1 (spike positive). Black dotted line = cutoff for positive.

Comment in

References

    1. Arevalo C.P., Sage V.L., Bolton M.J., Eilola T., Jones J.E., Kormuth K.A., Nturibi E., Balmaseda A., Gordon A., Lakdawala S.S., et al. Original antigenic sin priming of influenza virus hemagglutinin stalk antibodies. PNAS. 2020;117:17221–17227. - PMC - PubMed
    1. Arunachalam P.S., Scott M.K.D., Hagan T., Li C., Feng Y., Wimmers F., Grigoryan L., Trisal M., Edara V.V., Lai L., et al. Systems vaccinology of the BNT162b2 mRNA vaccine in humans. Nature. 2021;596:410–416. - PMC - PubMed
    1. Baden L.R., El Sahly H.M., Essink B., Kotloff K., Frey S., Novak R., Diemert D., Spector S.A., Rouphael N., Creech C.B., et al. Efficacy and safety of the mRNA-1273 SARS-CoV-2 vaccine. N. Engl. J. Med. 2021;384:403–416. - PMC - PubMed
    1. Bankhead P., Loughrey M.B., Fernández J.A., Dombrowski Y., McArt D.G., Dunne P.D., McQuaid S., Gray R.T., Murray L.J., Coleman H.G., et al. QuPath: open source software for digital pathology image analysis. Sci. Rep. 2017;7:16878. - PMC - PubMed
    1. Beach T.G., Adler C.H., Sue L.I., Serrano G., Shill H.A., Walker D.G., Lue L., Roher A.E., Dugger B.N., Maarouf C., et al. Arizona study of aging and neurodegenerative disorders and brain and body donation program. Neuropathology. 2015;35:354–389. - PMC - PubMed

Publication types

Supplementary concepts