. 2022 Mar 3;185(5):815-830.e19.
doi: 10.1016/j.cell.2022.01.010. Epub 2022 Feb 10.

GPR35 promotes neutrophil recruitment in response to serotonin metabolite 5-HIAA

Affiliations

GPR35 promotes neutrophil recruitment in response to serotonin metabolite 5-HIAA

Marco De Giovanni et al. Cell. .

Erratum in

Abstract

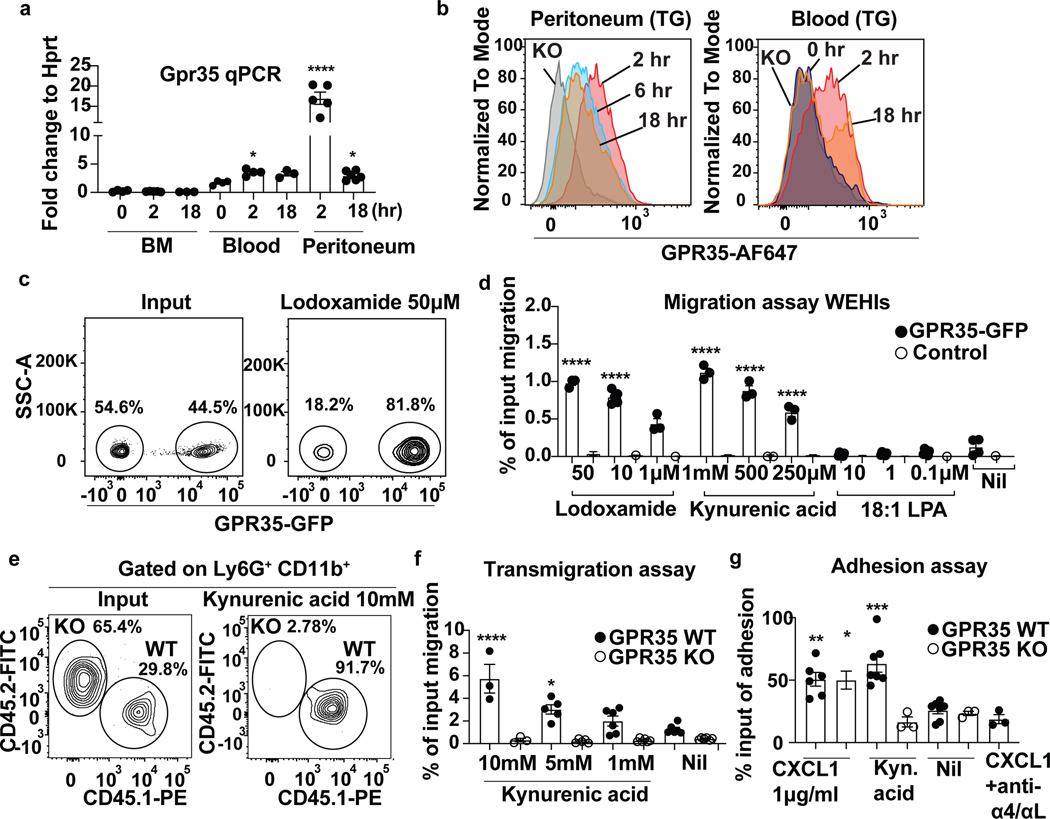
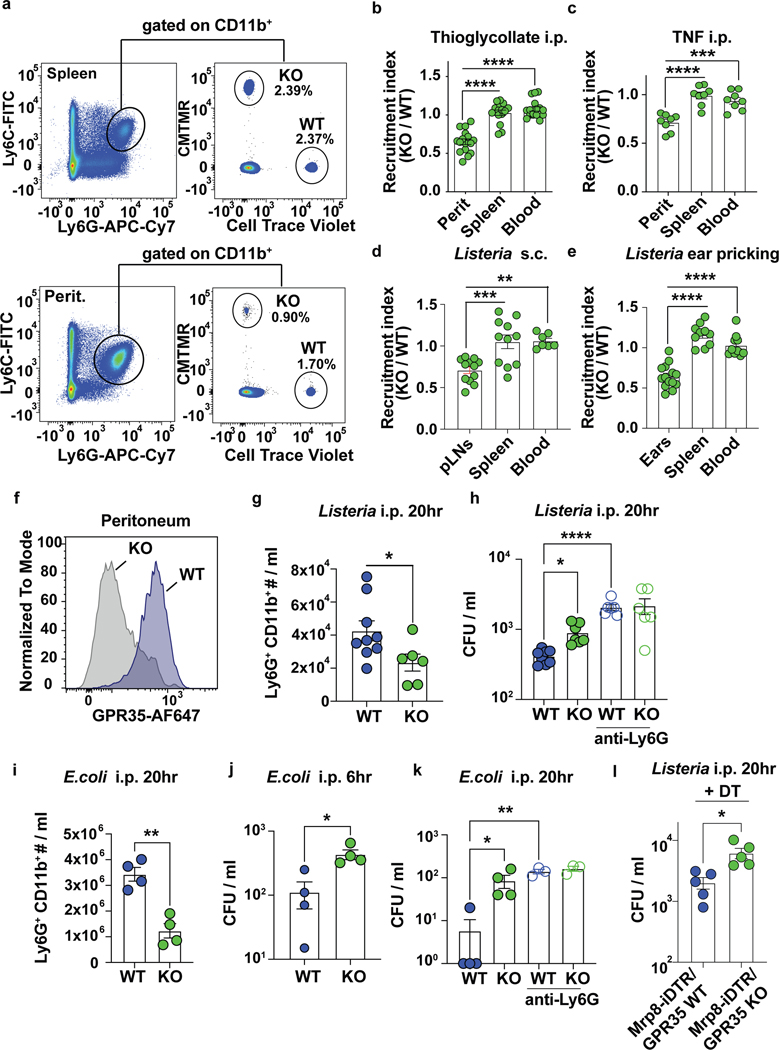
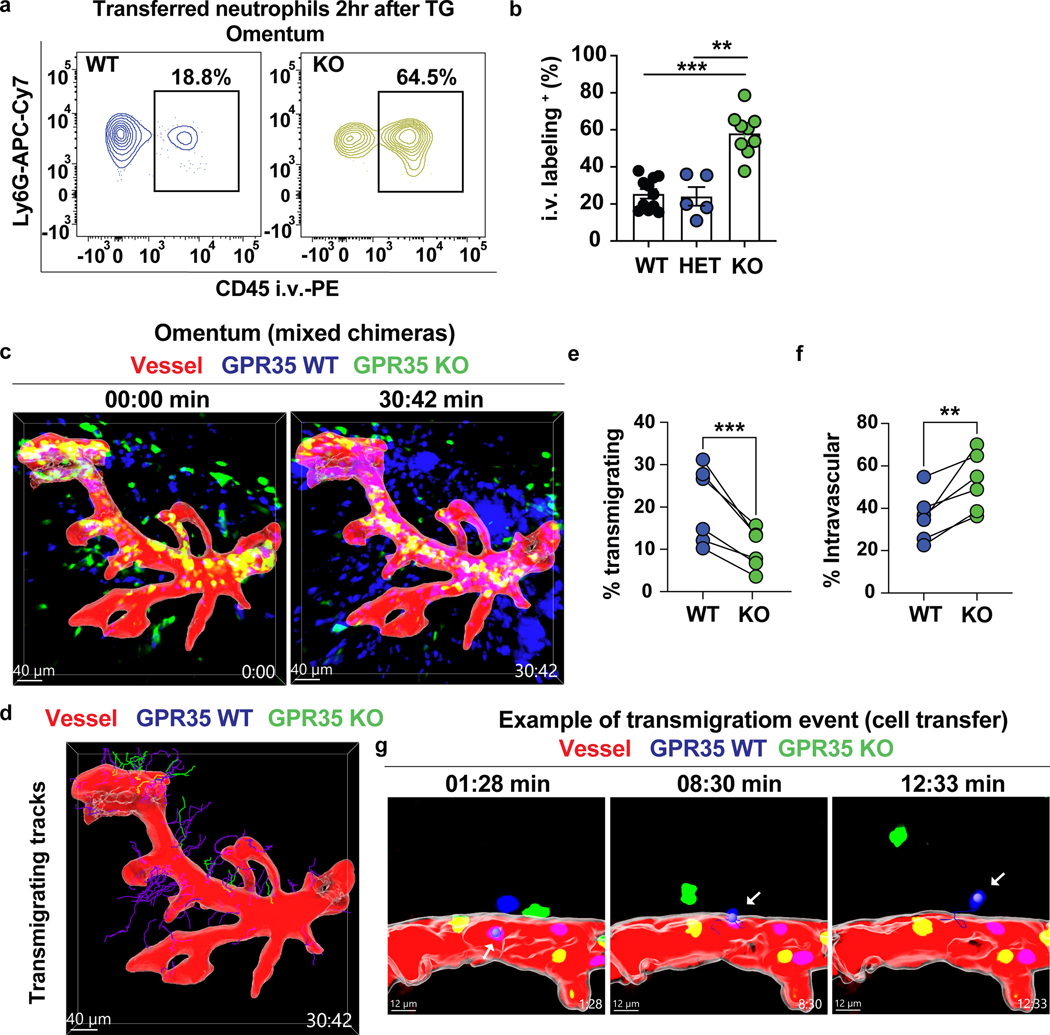
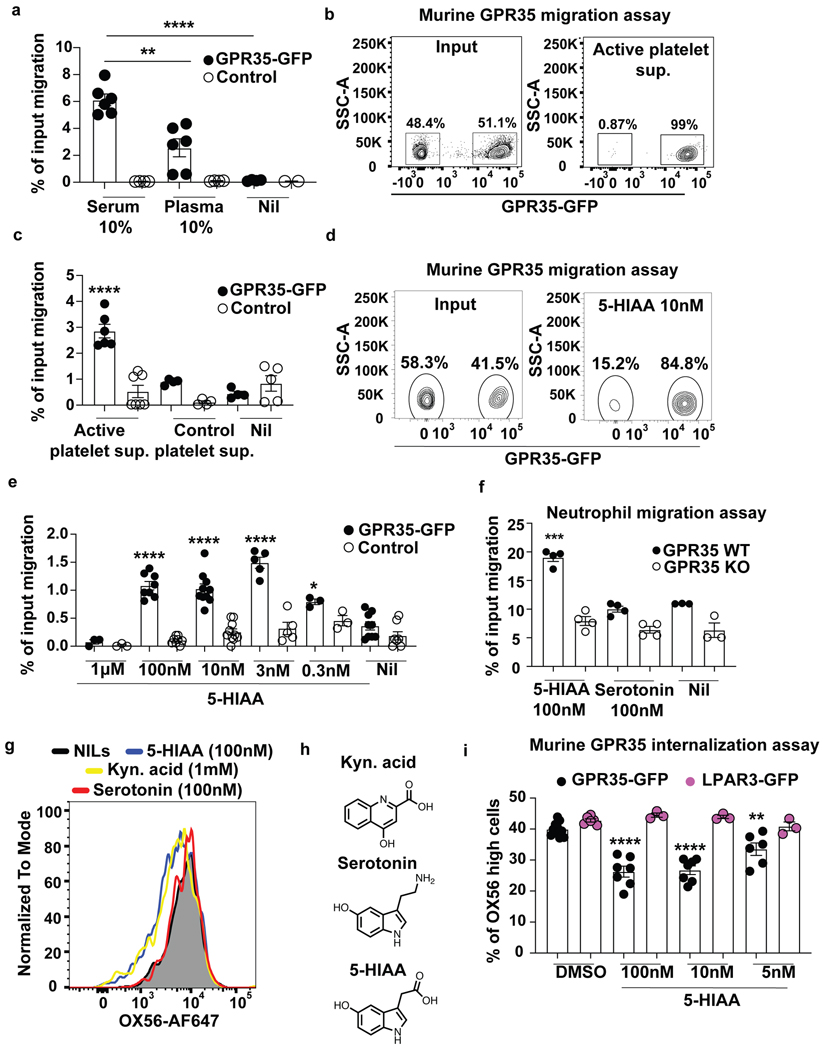
Rapid neutrophil recruitment to sites of inflammation is crucial for innate immune responses. Here, we reveal that the G-protein-coupled receptor GPR35 is upregulated in activated neutrophils, and it promotes their migration. GPR35-deficient neutrophils are less recruited from blood vessels into inflamed tissue, and the mice are less efficient in clearing peritoneal bacteria. Using a bioassay, we find that serum and activated platelet supernatant stimulate GPR35, and we identify the platelet-derived serotonin metabolite 5-hydroxyindoleacetic acid (5-HIAA) as a GPR35 ligand. GPR35 function in neutrophil recruitment is strongly dependent on platelets, with the receptor promoting transmigration across platelet-coated endothelium. Mast cells also attract GPR35+ cells via 5-HIAA. Mice deficient in 5-HIAA show a loss of GPR35-mediated neutrophil recruitment to inflamed tissue. These findings identify 5-HIAA as a GPR35 ligand and neutrophil chemoattractant and establish a role for platelet- and mast cell-produced 5-HIAA in cell recruitment to the sites of inflammation and bacterial clearance.

Keywords: 5-HIAA; GPCRs; GPR35; SSRI; inflammation; mast cells; migration; neutrophil; platelets; serotonin metabolite.


Conflict of interest statement

Declaration of interests The authors declare no competing interests.

Figures

Figure 1.
Figure 1.. GPR35 is a neutrophil chemotactic receptor.
a, qPCR for expression of Gpr35 (relative to Hprt) in Ly6G+ Ly6C+ CD11b+ CXCR2+ neutrophils sorted from BM (0hr, n=4; 2hr n=5; 18hr, n=3), blood (0hr, n=4; 2hr, n=4; 18hr, n=3) or peritoneum (2hr, n=5; 18hr, n=6) at indicated time points after TG injection. b, Intracellular flow cytometry for GPR35 in Ly6G+ CD11b+ Ly6C+ neutrophils from peritoneum (left) or blood (right) at indicated time points after TG. c, Representative flow cytometry plots of GPR35-GFP and control WEHI-231 cells migrating to 50 μM lodoxamide compared to input. d, Quantification of transwell migration assays of GPR35-GFP (black) or control (white) WEHI-231 cells to lodoxamide, KynA or 18:1 LPA at the indicated concentrations (n=3–6). e-f, Representative flow cytometry plots (e) and quantification (f) of transmigration assay with GPR35 WT (CD45.1) or KO (CD45.2) peritoneal neutrophils 2hr after TG, migrating to KynA at indicated concentrations (n=3–6). g, Quantification of adhesion assays performed with GPR35 WT or KO peritoneal neutrophils 2hr after TG. Data are pooled from at least 2 independent experiments. Statistics in a, d, f and g show comparison of all samples to BM 0hr (a) or Nil (d,f and g). P* < 0.05, **P < 0.005, ***P < 0.001, ****P < 0.0001. See also Figures S1.
Figure 2.
Figure 2.. GPR35 sustains neutrophil recruitment to inflamed tissues.
a, Representative flow cytometry plots of spleen (top) and peritoneum (bottom) from mice injected with a 50:50 mix of GPR35 WT (Cell trace violet) and GPR35 KO (CMTMR) BM neutrophils, 18hr after i.p. TG treatment. b, Graphs showing neutrophil recruitment index (% KO / % WT) of mice exemplified in (a) (n=15–16). c-e, Quantification of transferred neutrophil recruitment index in mice injected with either i.p. TNF (2hr, n=8) (c), s.c. Listeria (20hr, n=10) (d), or pricked with Listeria-contaminated needle (2hr; ears, n=11; spleen, blood, n=7) (e). f, Intracellular flow cytometry for GPR35 in Ly6G+ CD11b+ Ly6C+ neutrophils from peritoneum of WT or GPR35 KO mice 20hr after Listeria injection. g, Quantification of endogenous neutrophil numbers 20hr after peritoneal Listeria infection (WT, n=9; GPR35 KO, n=6). h, Quantification of Listeria peritoneal CFUs (WT, n=8; KO, n=7) 20hr after i.p. infection in mice treated or not with Ly6G depleting antibody. i, Quantification of endogenous neutrophil numbers 20hr after peritoneal E. coli infection (n=4). j, k Quantification of E.coli peritoneal CFUs 6hr (j, n=4) and 20hr (k, n=4) after i.p. infection in mice treated or not with Ly6G depleting antibody. l, Quantification of Listeria peritoneal CFUs (n=5) in Mrp8-Cre x iDTR/ GPR35 WT or KO mixed chimeras treated with DT, 20hr after Listeria infection Data are pooled from at least 2 independent experiments. *P < 0.05, **P < 0.005, ***P < 0.001, **** P<0,0001. See also Figure S2 and S3.
Figure 3.
Figure 3.. GPR35 supports neutrophil in vivo transendothelial migration.
a, Representative flow cytometry plots showing % of CD45-PE+ intravascular WT (left) or GPR35 KO (right) transferred neutrophils in the omentum 2hr after i.p. TG. b, Quantification of data shown in (a) (WT, n=11; HET, n=5; KO, n=9). Data are pooled from 3 independent experiments. c, Multiphoton intravital micrographs of Mrp8-Cre+ mTmG (blue) and GPR35 KO (green) neutrophils in the omentum of mixed BM chimeric mice injected with labeled dextran to identify vessels (red) and with Ly6G-PE to label neutrophils, 2hr post TG. Time shown in min:sec, See also Movie S1. d, Intravital micrograph showing transmigrating (WT blue, KO green) tracks from Movie S1. Image is representative of at least 3 independent intravital movies. e-f, Quantification of transmigrating (e) or intravascular (f) track % of WT or KO neutrophils in the omentum of mice of the type in c, 2hr after TG (n=6). g, Intravital micrographs of CTV-WT (blue) or CFSE-KO (green) transferred neutrophils in the omentum of mice injected with Dextran-Rhodamine and anti-CD31 PE to identify vessels (red), 2hr post TG (Movie S3). Time shown in min:sec. Arrow highlights transmigrating cell. Data are representative of 4 cell-transfer movies. **P < 0.005, ***P < 0.001. See also Figure S4.
Figure 4.
Figure 4.. Platelet-derived 5-HIAA is a potent GPR35 ligand
a, Quantification of transwell migration assay of GPR35-GFP or control WEHI-231 cells to 10% serum or plasma (GPR35-GFP: n=6; Nil, n=4; Control: n=5; Nil, n=2). Data are pooled from 2 independent experiments. b-c, Representative flow cytometry plots (b) and quantification (c) of GPR35-GFP (black) or control (white) WEHI-231 cells migrating to activated or resting (control) platelet culture supernatants (n=4–7). Data are pooled from 3 independent experiments. d-e, Representative flow cytometry plots (d) and quantification (e) of GPR35-GFP and control WEHI-231 transwell migration to 5-HIAA at indicated concentrations (n=3–10). f, Quantification of WT or GPR35 KO peritoneal neutrophil (2hr after TG) transwell migration to 100nM 5-HIAA or serotonin (Nil, n=3; all others, n=4). Data are pooled from 4 (e) or 2 (f) independent experiments. g, Representative flow cytometry histograms of OX56-GPR35 levels in transduced WEHI-231 cells after incubation with 1mM KynA (yellow), 50μM lodoxamide (red), 100nM 5-HIAA (blue) or Nil (black). Image is representative of at least 4 independent experiments. h, Diagrams of KynA, serotonin and 5-HIAA molecular structures. i, Quantification of OX56 levels in murine OX56-GPR35 and OX56-LPAR3 WEHI-231 cells incubated with 5-HIAA at indicated concentrations (n=3–11). Data are pooled from 4 independent experiments. *P<0.05, **P < 0.005, ***P < 0.001, ****P < 0.0001. See also Figure S5.
Figure 5.
Figure 5.. Activated platelets promote GPR35-dependent neutrophil transmigration.
a, Multiphoton intravital micrographs of CTV-WT (blue) or CMTMR-GPR35 KO (red) neutrophils in the omentum of Pf4-Cre x mTmG (platelets GFP+, green) recipients 2hr after TG (see also Movie S5). Vessels identified based on tdTom distribution (red). Images are representative of 3 independent intravital movies. Left: Composite image at time 0. Right: Time series showing example WT (upper) and KO (lower) cells transmigrating (arrow). Endothelium shown as an iso-surface based on tdTom fluorescence. Time stamp shows min:sec. b-c, Quantification of mean contact time with platelets (b) (n=6) and transmigrating track shortest distances from platelets (c) (n=6) of images of the type in (a) and Movie S5. Each dot represents individual movies. d, Representative flow cytometry plots showing % of CD41+ WT (left) or KO (right) transferred neutrophils in blood 2hr after TG. e-f, Quantification of (e) neutrophil recruitment index in WT (n=7) or platelet-deficient (n=8) and (f) intravascular neutrophil % in WT (left; WT, n=10; KO, n=9) or platelet-deficient (right; n=15) mice 2hr after Listeria skin-pricking. g, Quantification of neutrophil recruitment index in LNs and spleen of WT or platelet-deficient mice (n=8–13). Data are pooled from at least 2 independent experiments. *P < 0.05, **P< 0.005, ***P< 0.001. See also Figure S6.
Figure 6.
Figure 6.. Activated mast cells are sources of 5-HIAA and collaborate with platelets to sustain GPR35-dependent neutrophil recruitment.
a, Graph showing ELISA quantification of 5-HIAA in control (n=4) or LPS-treated (n=3) peritoneal mast cell supernatants. Single dots represent biological replicates. Unpaired t test was applied: ****P < 0.0001. b, Quantification of GPR35-GFP WEHI-231 cell migration to control or LPS-treated peritoneal mast cell supernatants (n=5). c, Graph showing ELISA quantification of 5-HIAA in control (n=3) or LPS-treated (n=4) P815 mast cell line supernatants. d, e, Quantification of GPR35-GFP WEHI-231 cell migration to (d) 5-HIAA (5nM), mast cell supernatants (50%),(e) CXCL12 (100ng/ml) or serum (5%) with the addition of anti-5-HIAA (2ug/ml) as indicated (n=2–5). f, g, Transferred neutrophil recruitment index (n=5–8) (f) and i.v. labeling (n=6–7) (g) in WT or mast cell-deficient mice 2hr after Listeria pricking. h, Quantification of CD63+ cells out of total CD117+ mast cells in 2hr Listeria pricked skin of control (n=5), platelet-depleted (n=8), platelet-depleted + compound 48/80 s.c. (n=7) or untreated controls (n=3).. i Transferred neutrophil recruitment index (n=5–7) in control, platelet-depleted or platelet-depleted and 48/80 treated mice 2hr after Listeria pricking. Data pooled from 2 independent experiments. j, k, Transferred neutrophil recruitment index (j) and numbers (k) in mast cell-deficient mice 2hr after Listeria skin-pricking and s.c. injection with DMSO (control) or 5-HIAA (n=4). *P < 0.05, **P < 0.005, ***P < 0.001, ****P < 0.0001.
Figure 7.
Figure 7.. Platelet and mast cell-derived 5-HIAA promote neutrophil recruitment in vivo
a-b, Representative flow cytometry plots (a) and quantification (b) of % transferred WT or KO neutrophils in ear skin of controls (green) or mice pretreated with Fluoxetine (purple) or Phenelzine (red), 2hr after Listeria skin-pricking (n=6–12). c, Graph showing quantification of transferred neutrophil recruitment index in controls or mice pretreated with Fluoxetine (purple) or Phenelzine (red), 2hr after Listeria skin-pricking (n=6–7). Graphs depict bars with mean +/− SEM. d, Quantification of CD45-PE+ intravascular transferred neutrophils in controls (d) and mice treated with Phenelzine (e), 2hr after Listeria skin-pricking (b, n=8, c, n=10). f,g, Graphs showing quantification of endogenous neutrophil % (f) (WT, n=9; Phenelzine, n=6; Fluoxetine, n=6) or CD45-PE+ intravascular endogenous neutrophils (g) in mice untreated (n=14) treated with Phenelzine (red) (n=9) or Fluoxetine (purple) (n=6). h, Quantification of GPR35-GFP WEHI-231 cell migration to activated platelet culture supernatants from mice treated with Phenelzine or Fluoxetine (Control platelet sup., n=6; all others, n=5). i, ELISA quantification of 5-HIAA in supernatants of activated platelets from control, phenelzine-treated or fluoxetine-treated mice. Data are representative of 2 independent experiments. j, Quantification of Ly6G+ CD11b+ endogenous neutrophils in the skin of WT (n=16), platelet-deficient (n=14) or platelet-deficient mice treated with phenelzine (n=7) 2hr after Listeria skin-pricking. Data are pooled from at least 3 independent experiments. k, l, Transferred neutrophil recruitment index in SERT Het or KO mice (k, n=4) or Tph1 Het or KO chimeras (l, n=8) 2hr after Listeria skin-pricking. Data are pooled from 2 independent experiments. *P < 0.05, **P < 0.005, ***P<0.001 ****P < 0.0001. See also Figures S7 and S8.

Comment in

References

    1. Agudelo LZ, Ferreira DMS, Cervenka I, Bryzgalova G, Dadvar S, Jannig PR, Pettersson-Klein AT, Lakshmikanth T, Sustarsic EG, Porsmyr-Palmertz M, et al. (2018). Kynurenic Acid and Gpr35 Regulate Adipose Tissue Energy Homeostasis and Inflammation. Cell Metab 27, 378–392 e375. - PubMed
    1. Ajuebor MN, Das AM, Virag L, Flower RJ, Szabo C, and Perretti M. (1999). Role of resident peritoneal macrophages and mast cells in chemokine production and neutrophil migration in acute inflammation: evidence for an inhibitory loop involving endogenous IL-10. J Immunol 162, 1685–1691. - PubMed
    1. Askenase PW, Bursztajn S, Gershon MD, and Gershon RK (1980). T cell-dependent mast cell degranulation and release of serotonin in murine delayed-type hypersensitivity. J Exp Med 152, 1358–1374. - PMC - PubMed
    1. Askenase PW, Van Loveren H, Kraeuter-Kops S, Ron Y, Meade R, Theoharides TC, Nordlund JJ, Scovern H, Gerhson MD, and Ptak W. (1983). Defective elicitation of delayed-type hypersensitivity in W/Wv and SI/SId mast cell-deficient mice. J Immunol 131, 2687–2694. - PubMed
    1. Barth MC, Ahluwalia N, Anderson TJ, Hardy GJ, Sinha S, Alvarez-Cardona JA, Pruitt IE, Rhee EP, Colvin RA, and Gerszten RE (2009). Kynurenic acid triggers firm arrest of leukocytes to vascular endothelium under flow conditions. J Biol Chem 284, 19189–19195. - PMC - PubMed

Publication types

LinkOut - more resources