. 2022 Feb 17;185(4):614-629.e21.
doi: 10.1016/j.cell.2022.01.009. Epub 2022 Feb 10.

An adjuvant strategy enabled by modulation of the physical properties of microbial ligands expands antigen immunogenicity

Affiliations

An adjuvant strategy enabled by modulation of the physical properties of microbial ligands expands antigen immunogenicity

Francesco Borriello et al. Cell. .

Abstract

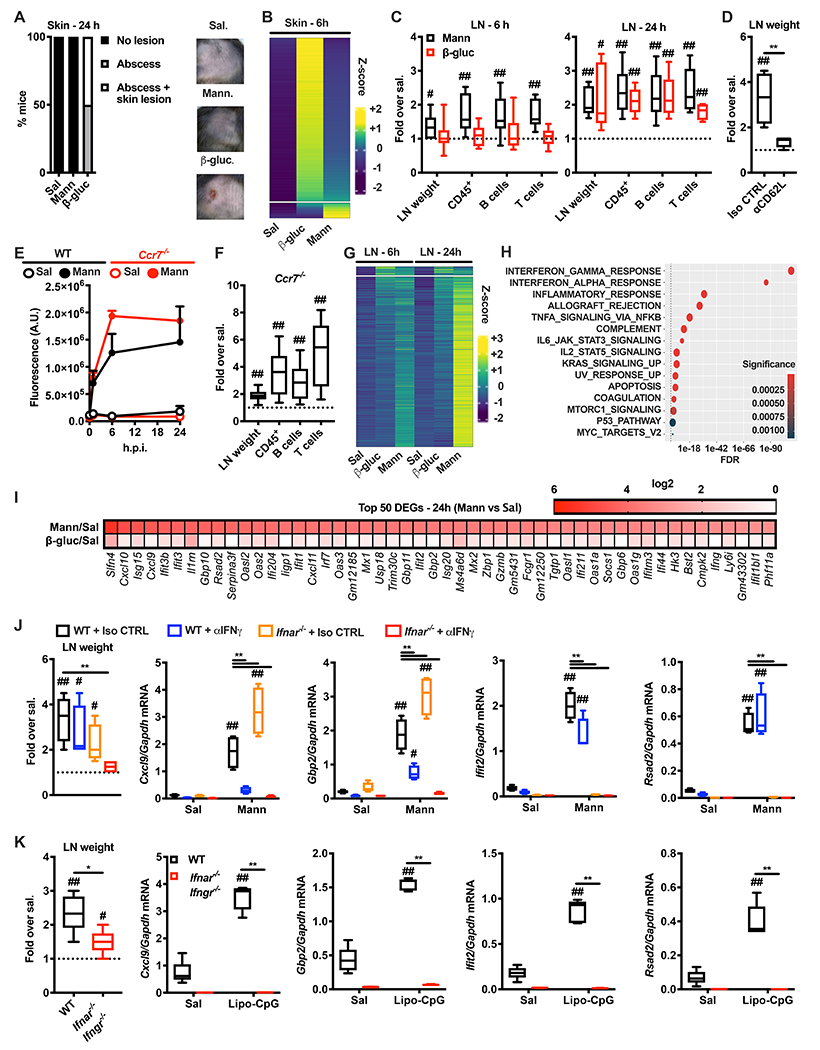
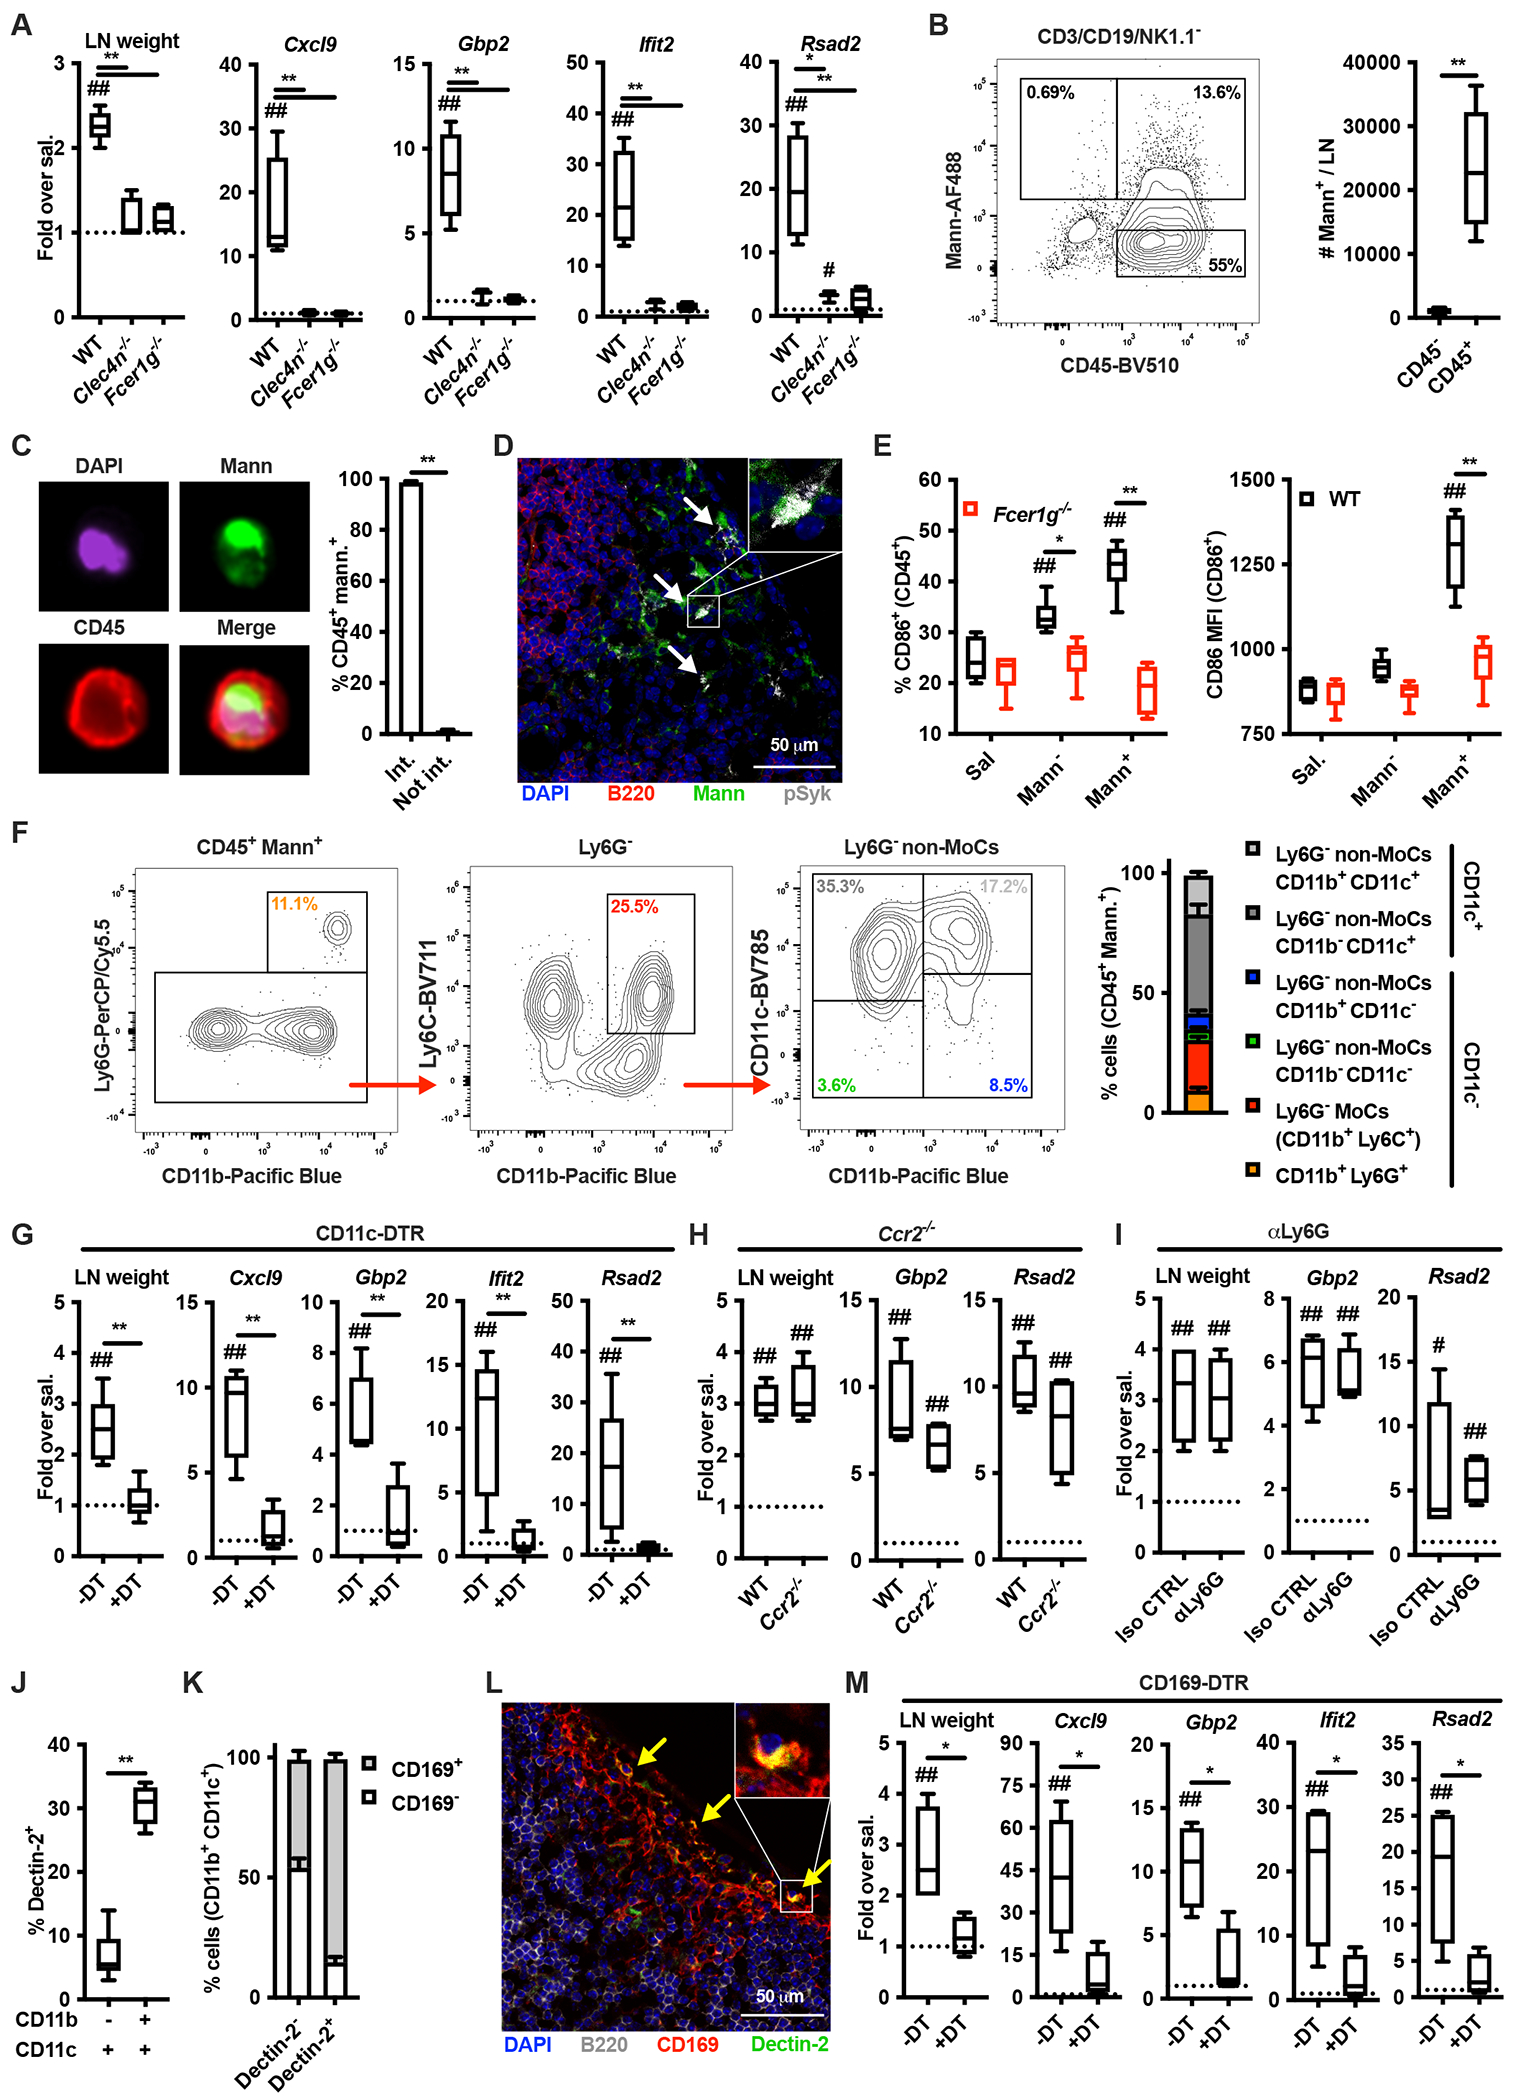
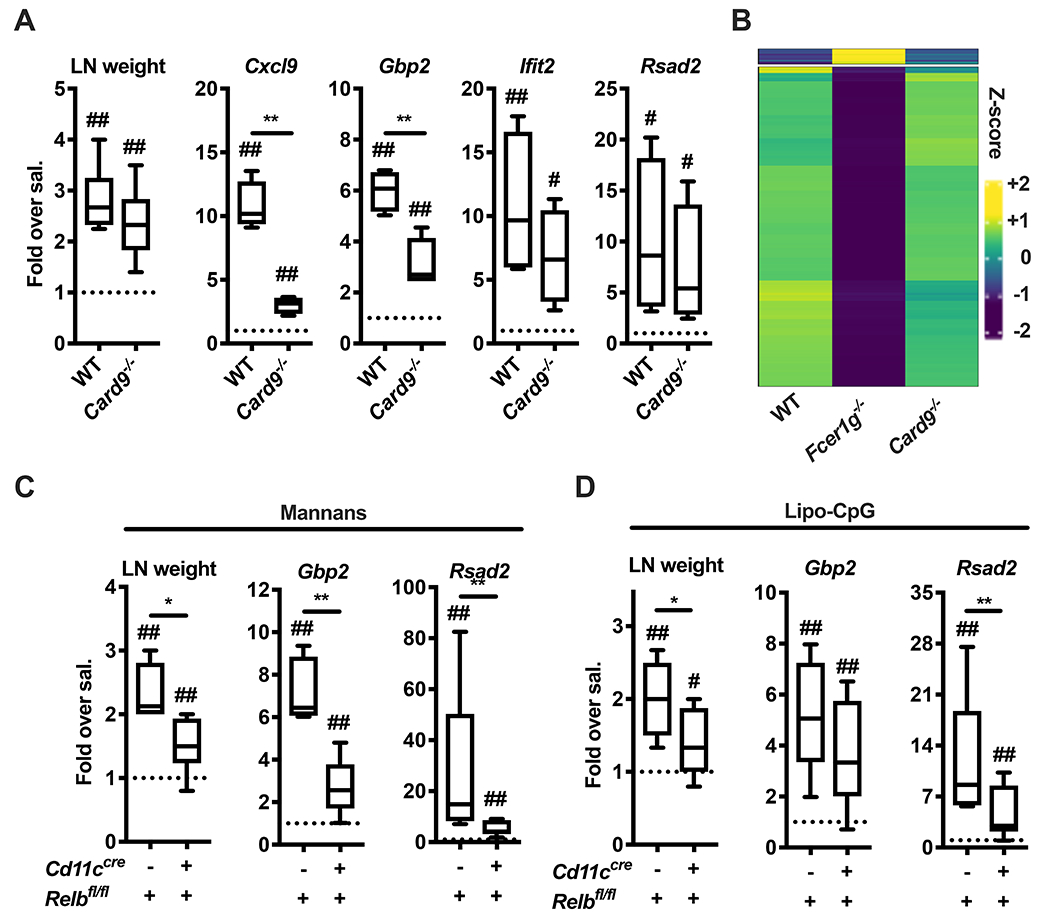
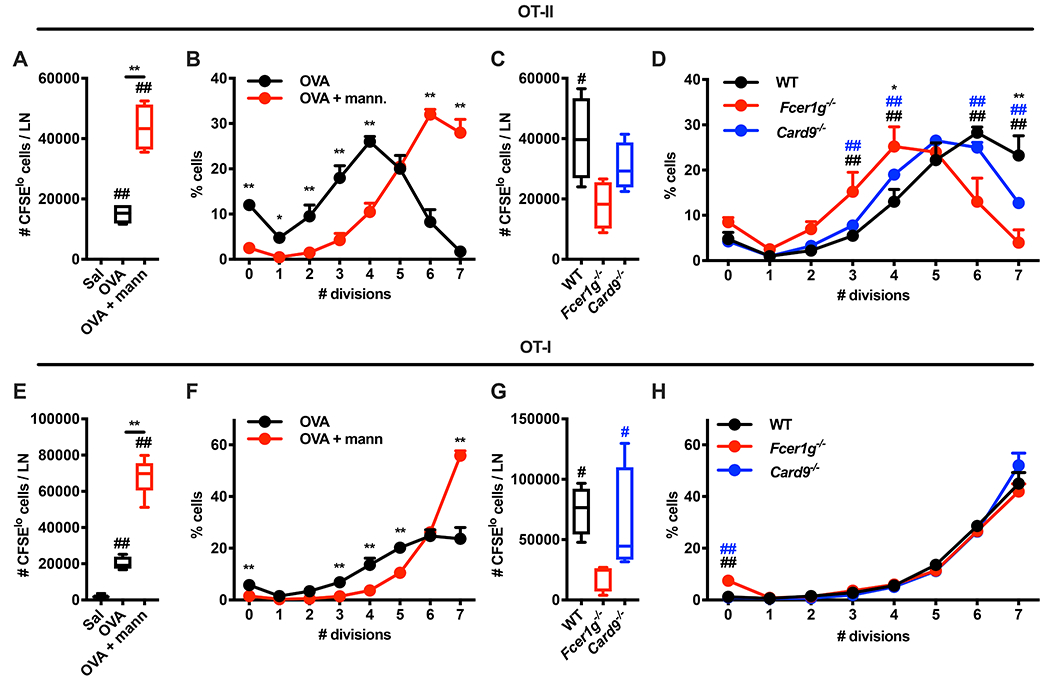
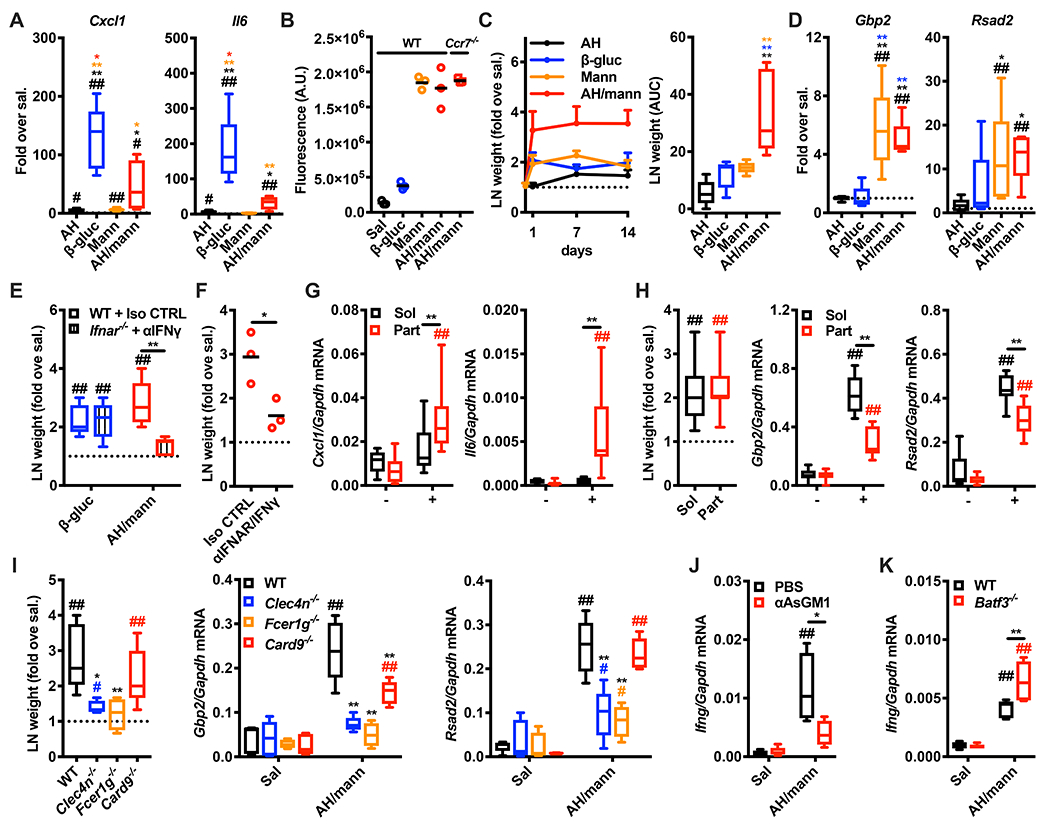
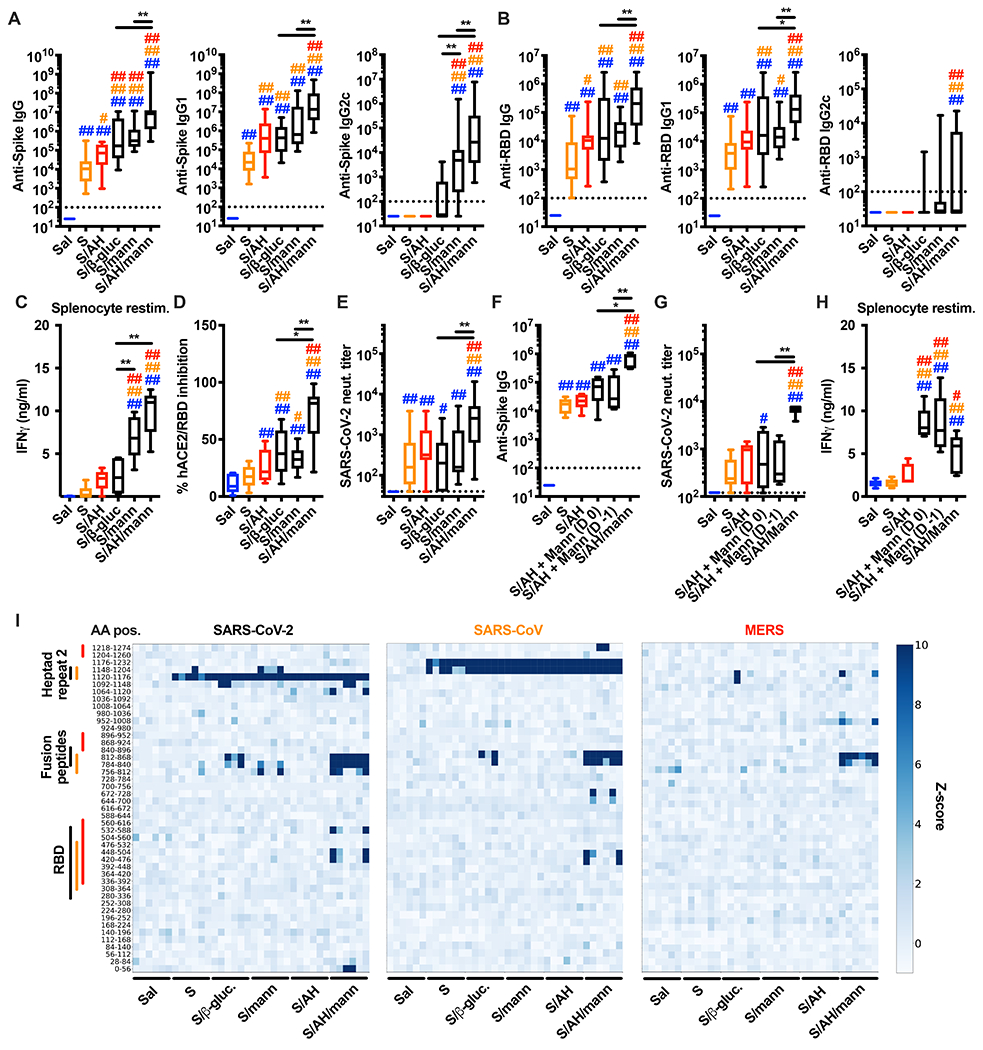
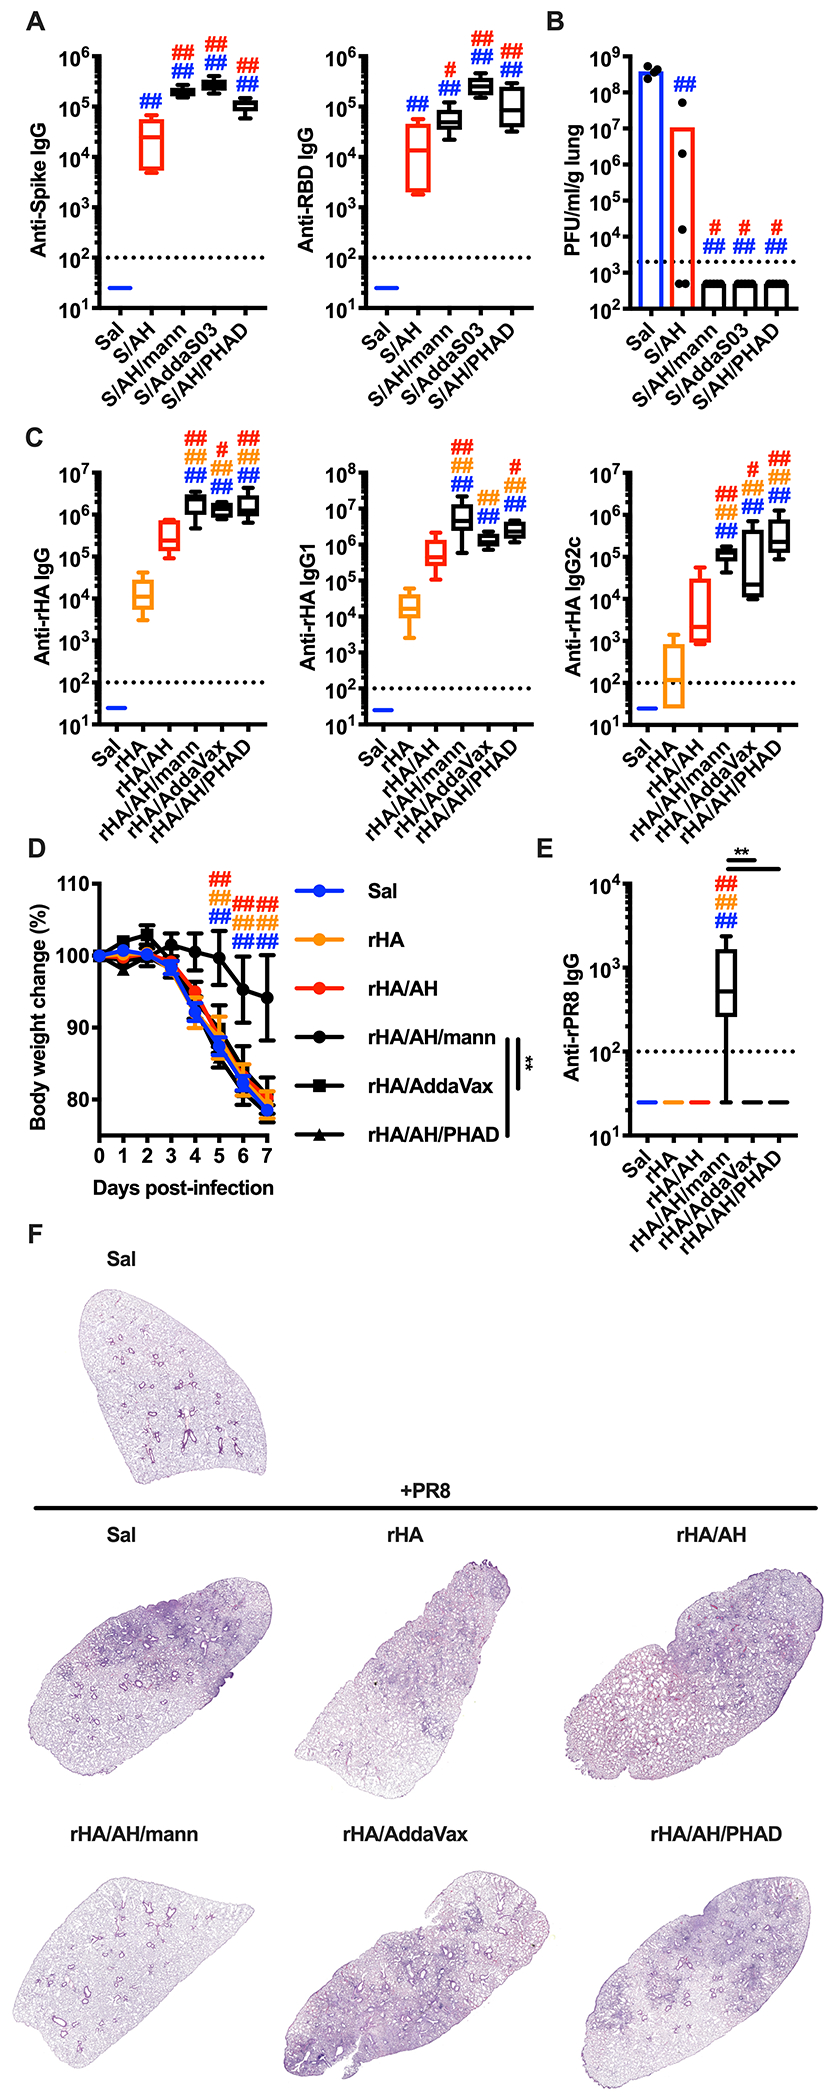
Activation of the innate immune system via pattern recognition receptors (PRRs) is key to generate lasting adaptive immunity. PRRs detect unique chemical patterns associated with invading microorganisms, but whether and how the physical properties of PRR ligands influence the development of the immune response remains unknown. Through the study of fungal mannans, we show that the physical form of PRR ligands dictates the immune response. Soluble mannans are immunosilent in the periphery but elicit a potent pro-inflammatory response in the draining lymph node (dLN). By modulating the physical form of mannans, we developed a formulation that targets both the periphery and the dLN. When combined with viral glycoprotein antigens, this mannan formulation broadens epitope recognition, elicits potent antigen-specific neutralizing antibodies, and confers protection against viral infections of the lung. Thus, the physical properties of microbial ligands determine the outcome of the immune response and can be harnessed for vaccine development.

Keywords: Dectin; PAMP; PRR; SARS-CoV-2; coronavirus; inflammation; influenza A virus; innate immunity; interferon; pathogen-associated molecular pattern; pattern recognition receptor; viral glycoprotein.


Conflict of interest statement

Declaration of interests F.B., E.N., T.R.O., I.Z., D.J.D., and O.L. are named inventors on invention disclosures and patents involving vaccine adjuvants. S.J.E. is a founder of TSCAN Therapeutics, ImmuneID, MAZE Therapeutics, and Mirimus. S.J.E. serves on the scientific advisory board of Homology Medicines, TSCAN Therapeutics, MAZE Therapetics, and XChem, and is an advisor for MPM, none of which impact this work. S.J.E. is an inventor on a patent application issued to the Brigham and Women’s Hospital (US20160320406A) that covers the use of the VirScan library to identify pathogen antibodies in blood. The other authors declare no commercial or financial conflict of interest.

Figures

Figure 1.
Figure 1.. Mannans elicit lymph node-restricted IFN signatures that drive lymph node expansion.
(A) Mice were injected intradermally with saline (Sal), mannans (Mann) or β-glucans (β-gluc). 24 hours later the injection site was assessed for the presence of an abscess with or without skin lesion. The graph depicts percentages of mice in each of the indicated categories. Representative pictures of skin appearance at injection sites of saline, mannans and β-glucans are also shown. N = 5 mice per group. (B) Transcriptomic analysis of skin samples collected 6 hours after injection of saline (Sal), β-glucans (β-gluc) or mannans (Mann). Heatmap of abundance (z-scored log2 normalized counts) of genes induced by β-glucans and/or mannans compared to saline control, ranked by abundance difference between β-glucans and mannans. The gap splits the genes into two clusters, one that is highly upregulated by β-glucans and one that is highly upregulated by mannans. N = 3 mice per group. (C) Mice were injected intradermally with saline, mannans (Mann) or β-glucans (β-gluc). 6 or 24 hours later dLNs were collected and analyzed for weight as well as absolute numbers of CD45+, B and T cells. Results are expressed as fold over contralateral, saline-injected LN. N = 5-9 mice per group. (D) Mice were injected intravenously with a blocking anti-CD62L antibody (αCD62L) or the same dose of an isotype control (Iso CTRL) one day before intradermal injections of saline or mannans. 24 hours later dLNs were collected and their weights were measured. Results are expressed as fold over contralateral, saline-injected LN. N = 4 mice per group. (E) WT and Ccr7−/− mice were intradermally injected with saline (Sal) or fluorescently labelled mannans (Mann). 1, 6 and 24 hours later dLNs were collected and homogenized to measure total fluorescence. Results are expressed as arbitrary units (A.U.) of fluorescence and shown as mean + SEM. N = 3 mice per timepoint. (F) Ccr7−/− mice were injected intradermally with saline or mannans. 24 hours later dLNs were collected and analyzed as indicated in C. N = 6 mice. (G) Transcriptomic analysis of dLNs collected 6 and 24 hours after intradermal injection of saline (Sal), β-glucans (β-gluc) or mannans (Mann). Heatmap of abundance (z-scored log2 normalized counts) of genes induced by β-glucans and/or mannans compared to saline control, ranked by abundance difference between β-glucans and mannans. The gap splits the genes into two clusters, one that is highly upregulated by β-glucans and one that is highly upregulated by mannans. N = 4-5 mice per group. (H) Pathway enrichment analysis of genes belonging to the cluster upregulated by mannans as depicted in G. (I) Heatmap representation of the average expression levels of the top 50 genes upregulated in mannan-treated dLNs 24 hours after the injection compared to the saline control. N = 4-5 mice per group. (J) WT and Ifnar−/− mice were intravenously injected with an anti-IFNγ blocking antibody (αIFNγ) or the same dose of an isotype control (Iso CTRL) on day −1 and 0. On day 0 mice were also intradermally injected with saline (Sal) or mannans (Mann). 24 hours later dLNs were collected, their weights were measured, and RNA was extracted for gene expression analysis. Results are expressed as fold over contralateral, saline-injected LN (weight) or as relative expression compared to Gapdh. N = 4 mice per group. (K) WT and Ifnar−/− Ifngr−/− mice were intradermally injected with saline (Sal) or Lipo-CpG. Samples were collected and analyzed as in J. N = 5 mice per group. # and ## respectively indicate p ≤ 0.05 and 0.01 when comparing each group against the value 1 (which represent the contralateral control sample expressed as fold). * and ** respectively indicate p ≤ 0.05 and 0.01 when comparing among different experimental groups. See also Figure S1, S2, S3 and Table S1 and S2.
Figure 2.
Figure 2.. Mannan-elicited lymph node innate response requires Dectin-2-expressing, CD169+ sinus macrophages.
(A) WT, Clec4n−/− and Fcer1g−/− mice were intradermally injected with saline or mannans. 24 hours later dLNs were collected, their weights were measured, and RNA was extracted for gene expression analysis. Results are expressed as fold over contralateral, saline-injected LN. N = 3-5 mice per genotype. (B) WT mice were intradermally injected with fluorescently labelled mannans (Mann-AF488). 6 hours later dLNs were collected and the absolute numbers of mannan-laden (Mann+) CD3/CD19/NK1.1 cells were quantified by flow cytometry. N = 6 mice. (C) Mice were treated as in B. Imaging cytometry analysis and quantification of mannan internalization was performed on CD3/CD19/NK1.1-depeted, CD45+ mannan-laden (Mann+) cells. N = 4 mice. (D) WT mice were intradermally injected with fluorescently labelled mannans (Mann). 1 hour later dLNs were collected for confocal microscopy analysis using antibodies against B220 and phospho-Syk (pSyk). DAPI was used for nuclear counterstaining. One representative image is shown. (E) WT and Fcer1g−/− mice were injected with saline or fluorescently labelled mannans. 6 hours later dLNs were collected and CD86 expression levels were assessed by flow cytometry on CD3/CD19/NK1.1 CD45+ mannan-laden (Mann+) cells, CD45+ cells that did not capture mannans (Mann) and CD45+ cells from saline-injected dLNs (Sal). N = 6 mice per genotype. (F) WT mice were intradermally injected with fluorescently labelled mannans. 6 hours later dLNs were collected and the phenotype of CD3/CD19/NK1.1 CD45+ mannan-laden (Mann+) cells was assessed by flow cytometry. N = 6 mice. (G - I) Diphtheria toxin (DT)-treated CD11c-DT receptor (DTR), Ccr2−/− and isotype control (Iso CTRL)- or anti-Ly6G (αLy6G)-treated mice were treated and analyzed as in A. N = 4 mice per group. (J, K) LNs were isolated from untreated WT mice and the expression of Dectin-2 was evaluated by flow cytometry as percentage of expression in the indicated CD3/CD19/NK1.1 CD45+ cell subsets. N = 6 for J or 3 for K. (L) Confocal microscopy analysis of untreated LNs stained with antibodies against Dectin-2, B220 and CD169. DAPI was used for nuclear counterstaining. One representative image is shown. (M) DT-treated CD169-DTR mice were treated and analyzed as in A. N = 4 mice per group. # and ## respectively indicate p ≤ 0.05 and 0.01 when comparing each group against the value 1 (which represent the contralateral control sample expressed as fold) or saline control. * and ** respectively indicate p ≤ 0.05 and 0.01 when comparing among different experimental groups.
Figure 3.
Figure 3.. Activation of the non-canonical NF-kB subunit RelB governs the mannan-elicited lymph node innate response.
(A) WT and Card9−/− mice were treated and analyzed as in Figure 2A. N = 9 (for LN weight) or 4 (for gene expression analysis) mice per genotype. (B) CD3 CD19 NK1.1 Ter119 CD45+ AF488-mannan+ Ly6G (CD11b+ Ly6C+) CD11b+ CD11c+ cells were sorted from dLNs of WT, Fcer1g−/− and Card9−/− mice 6 hours after AF488-mannan injection and transcriptional profiles were assessed by targeted transcriptome sequencing. Results are shown as heatmap of genes with an F-test FDR less than 0.05 and a log2 fold-change (FC) greater than 1 (or lower than −1) between a knockout mouse and WT control. (C, D) Relbfl/fl and Cd11ccre Relbfl/fl mice were treated with saline, mannans or Lipo-CpG, and analyzed as in Figure 2A. N = 4-13 mice per genotype. # and ## respectively indicate p ≤ 0.05 and 0.01 when comparing each group against the value 1 (which represent the contralateral control sample expressed as fold) or saline control. * and ** respectively indicate p ≤ 0.05 and 0.01 when comparing among different experimental groups. See also Figure S4 and Table S3, S4, S5, S6 and S7.
Figure 4.
Figure 4.. Molecular pathways required for mannan-elicited lymph node innate response regulate the magnitude of mannan adjuvant activity.
(A-H) CFSE-labelled OT-I CD8+ T or OT-II CD4+ T cells were injected intravenously in WT mice on day −1. On day 0 the mice were intradermally injected with saline, ovalbumin (OVA), or OVA combined with mannans (OVA + mann). 3 days later dLNs were isolated and the absolute numbers of CFSElo cells (i.e., cells that underwent at least one cycle of cell division) (A, E) or the percentages of cells in each division peak (B, F) were quantified by flow cytometry. N = 4 mice per group. ## indicates p ≤ 0.01 when comparing each group against saline control (A, E). * and ** respectively indicate p ≤ 0.05 and p ≤ 0.01 when comparing OVA vs OVA + mann. (A, B, E, F). (C, D, G, H) WT, Fcer1g−/− and Card9−/− mice were treated and analyzed as in A, B, E, F (with the exception that all mice received OVA combined with mannans). N = 4 mice per genotype. # and ## respectively indicate p ≤ 0.05 and p ≤ 0.01 when comparing WT vs Fcer1g−/− (black) or Card9−/− vs Fcer1g−/− (blue). * and ** respectively indicate p ≤ 0.05 and 0.01 when comparing WT vs Card9−/−. Results in B, F and D, H are shown as mean + SD.
Figure 5.
Figure 5.. Formulation of mannans with aluminum hydroxide confers physical properties that predict immunological functions.
(A) Mice were intradermally injected with saline (sal.), alum (AH), β-glucans (β-gluc), mannans (Mann) or AH/mannans (AH/mann). 24 hours later skin samples were collected, and RNA was extracted for gene expression analysis. Results are expressed as fold over contralateral, saline-injected skin sample. N = 4-5 mice per group. (B) WT mice were intradermally injected with saline (Sal), fluorescently labelled β-glucans (β-gluc), fluorescently labelled mannans (Mann) or their formulation with AH (AH/mann). In addition, Ccr7−/− mice were intradermally injected with AH/mann. 24 hours later dLNs were collected and homogenized to measure total fluorescence. Results are expressed as arbitrary units (A.U.) of fluorescence and shown as individual data points (horizontal bars represent means). N = 3 mice. (C) Mice were treated as in A. 1, 7 and 14 days later dLNs were collected, their weights were measured and expressed as fold over contralateral, saline-injected LN. Results are represented as mean + SEM (left panel) or area under the curve (AUC, right panel). (D) Mice were treated as in A. 24 hours later dLNs were collected, and RNA was extracted for gene expression analysis. Results are expressed as fold over contralateral, saline-injected LN. N = 5 per group. (E) Ifnar−/− and WT mice were respectively treated with a blocking anti-IFNγ antibody (αIFNγ) or the same dose of an isotype control (Iso CTRL) on day −1 and 0, and on day 0 mice were intradermally injected with saline (sal.), β-glucans (β-gluc), or AH/mannans (AH/mann). 24 hours later dLNs were collected and their weights were measured. Results are expressed as fold over contralateral, saline-injected LN. N = 5 mice per group. (F), WT mice treated with blocking anti-IFNAR plus anti-IFNγ (αIFNAR/IFNγ) antibodies or the same doses of isotype controls (Iso CTRL) on day −1 and 0, and on day 0 mice were intradermally injected with saline (sal.) or AH/mannans (AH/mann). 24 hours later dLNs were collected and their weights were measured. Results are expressed as fold over contralateral, saline-injected LN. N = 5 mice per group. (G, H) Mice were treated with the soluble (Sol) or particulate (Part) fractions of AH/mannans. 24 hours later skin samples (G) and dLNs (H) were collected, dLN weights were measured and RNA was extracted for gene expression analysis. Results are expressed as fold over contralateral, saline-injected skin sample or LN. N = 5 mice per group. (I) Mice of the indicated backgrounds were injected with saline (sal.) or AH/mannans (AH/mann). 24 hours later dLNs were collected, their weights were measured, and RNA was extracted for gene expression analysis. Results are expressed as fold over contralateral, saline-injected sample or as relative expression compared to Gapdh. (J, K) WT mice injected on day −1 and 0 with the same volumes of PBS or a depleting anti-Asialo GM1 antibody (αAsGM1) (J), or WT and Batf3−/− mice (K) were injected intradermally on day 0 with saline (Sal) or AH/mannans (AH/mann). 24 hours later dLNs were collected, and RNA was extracted for gene expression analysis. Results are reported as relative expression compared to Gapdh N = 5 mice per group. # and ## respectively indicate p ≤ 0.05 and 0.01 when comparing each group against its untreated control (CTRL) or the value 1 (which represent the contralateral control sample expressed as fold). * and ** respectively indicate p ≤ 0.05 and 0.01 when comparing among different experimental groups. See also Figure S5.
Figure 6.
Figure 6.. Immunization with SARS-CoV-2 Spike protein and mannans formulated with alum generates anti-Spike type 1 immunity and neutralizing antibodies.
(A-E) Mice were injected intradermally with saline (Sal), pre-fusion stabilized SARS-CoV-2 trimer alone (S) or combined with alum (AH) (S/AH), β-glucans (S/β-gluc.), mannans (S/mann) or AH/mannans (S/AH/mann) on day 0 (prime) and day 14 (boost). Serum samples were collected on day 28 to assess anti-Spike (A) and anti-RBD (B) antibody levels, SARS-CoV-2 surrogate virus neutralization test (D) and neutralization titer (E). In selected experiments (C), mice were sacrificed on day 35 to collect spleens and isolate splenocytes for in vitro restimulation with Spike peptides. After 96 hours supernatants were collected and IFNγ protein levels were measured by ELISA. N = 16-18 (A, B), 10 (C), 8-10 (D) or 13-15 (E) mice per group. (F-H) Mice were injected intradermally with saline (Sal), pre-fusion stabilized SARS-CoV-2 trimer alone (S), or combined with AH (S/AH). Mannans (Mann) were injected separately on the same side of the S/AH injection in a proximal site, either the same day (S/AH + Mann (D 0)) or the day before (S/AH + Mann (D −1)). As a control, SARS-CoV-2 trimer combined with AH and mannans (S/AH/Mann) was also injected. Formulations were injected on day 0 (prime) and day 14 (boost). Serum samples were collected on day 28 to assess anti-Spike antibody levels (F) and SARS-CoV-2 neutralization titer (G). In selected experiments (H), mice were sacrificed on day 35 to collect spleens and isolate splenocytes for in vitro restimulation as in C. N = 6-8 mice per group. #, * and ##, ** respectively indicate p ≤ 0.05 and 0.01 when comparing among different experimental groups. Comparisons are indicated by the color code. (I) Mice were immunized as in A-E. VirScan analysis was performed on serum samples collected on day 28. Each column represents a single serum sample collected from an individual mouse and each row represents a peptide tile. Tiles are labeled by amino acid start and end position. Color intensity represents the degree of enrichment (z-score) of each peptide. Color-coded lines indicate the approximate aminoacidic positions (AA pos.) of RBD, Fusion peptides and Heptad repeat 2 of each virus. N = 6 mice per group. See also Figure S6.
Figure 7.
Figure 7.. The adjuvant formulation of mannans and alum confers protection against lung viral infections.
(A, B) Mice were injected intradermally with saline (Sal), pre-fusion stabilized SARS-CoV-2 trimer alone (S) or combined with alum (AH) (S/AH), AH/mannans (S/AH/mann), AddaS03 (S/AddaS03), or AH/PHAD (S/AH/PHAD) on day 0 (prime) and day 14 (boost). Serum samples were collected on day 28 to assess anti-Spike and anti-RBD antibody levels (A). On day 35 mice were intranasally infected with SARS-CoV-2 MA10 on day 35 and 2 days later numbers of plaque forming units (PFU) were quantified in the lungs (B). N = 4-5 mice per group. (C - F) Mice were injected intradermally with saline (Sal), Flublok alone (rHA) or combined with AH (rHA/AH), AH/mannans (rHA/AH/mann), AddaVax (rHA/AddaVax), or AH/PHAD (rHA/AH/PHAD) on day 0 (prime) and day 14 (boost). Serum samples were collected on day 28 to assess antibodies against rHA (anti-rHA, C) or IAV A/PR/8/1934 recombinant hemagglutinin (anti-rPR8, E). On day 35 mice were intranasally infected with IAV A/PR/8/1934 and body weights were recorded for 7 days (D). N = 5 (C, E) or 8 (D) mice per group. On day 7 post-infection mice were sacrificed and lungs were collected for histological analysis (hematoxylin eosin staining, F). One representative image per group is shown. #, * and ##, ** respectively indicate p ≤ 0.05 and 0.01. Comparisons are indicated by the color code. See also Figure S7.

Comment in

References

    1. Acton SE, Farrugia AJ, Astarita JL, Mourao-Sa D, Jenkins RP, Nye E, Hooper S, van Blijswijk J, Rogers NC, Snelgrove KJ, et al. (2014). Dendritic cells control fibroblastic reticular network tension and lymph node expansion. Nature 514, 498–502. - PMC - PubMed
    1. Acton SE, and Reis e Sousa C (2016). Dendritic cells in remodeling of lymph nodes during immune responses. Immunol Rev 271, 221–229. - PubMed
    1. Bachmann MF, and Jennings GT (2010). Vaccine delivery: a matter of size, geometry, kinetics and molecular patterns. Nat Rev Immunol 10, 787–796. - PubMed
    1. Banchereau J, and Steinman RM (1998). Dendritic cells and the control of immunity. Nature 392, 245–252. - PubMed
    1. Barrat FJ, Crow MK, and Ivashkiv LB (2019). Interferon target-gene expression and epigenomic signatures in health and disease. Nature immunology 20, 1574–1583. - PMC - PubMed

Publication types

MeSH terms