. 2022 Jun;128(6):1006-1018.
doi: 10.1016/j.bja.2022.01.010. Epub 2022 Feb 9.

Distinct EEG signatures differentiate unconsciousness and disconnection during anaesthesia and sleep

Affiliations

Distinct EEG signatures differentiate unconsciousness and disconnection during anaesthesia and sleep

Cameron P Casey et al. Br J Anaesth. 2022 Jun.

Abstract

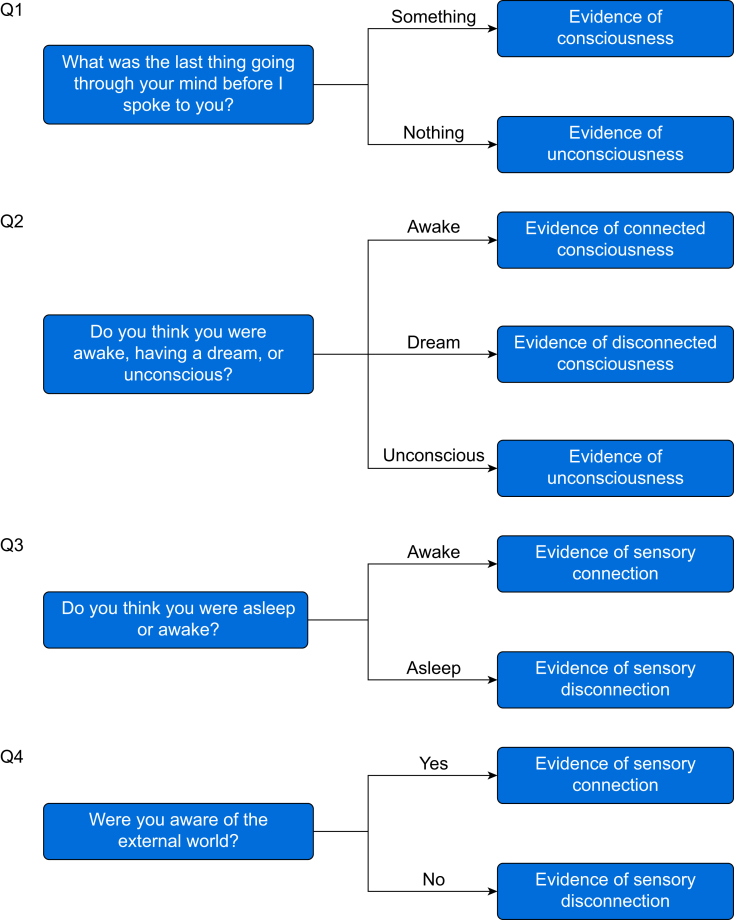
Background: How conscious experience becomes disconnected from the environment, or disappears, across arousal states is unknown. We sought to identify the neural correlates of sensory disconnection and unconsciousness using a novel serial awakening paradigm.

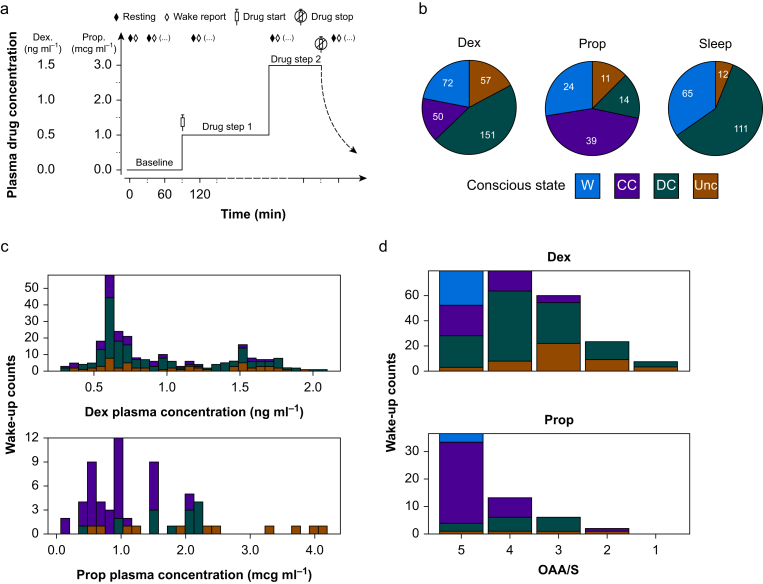
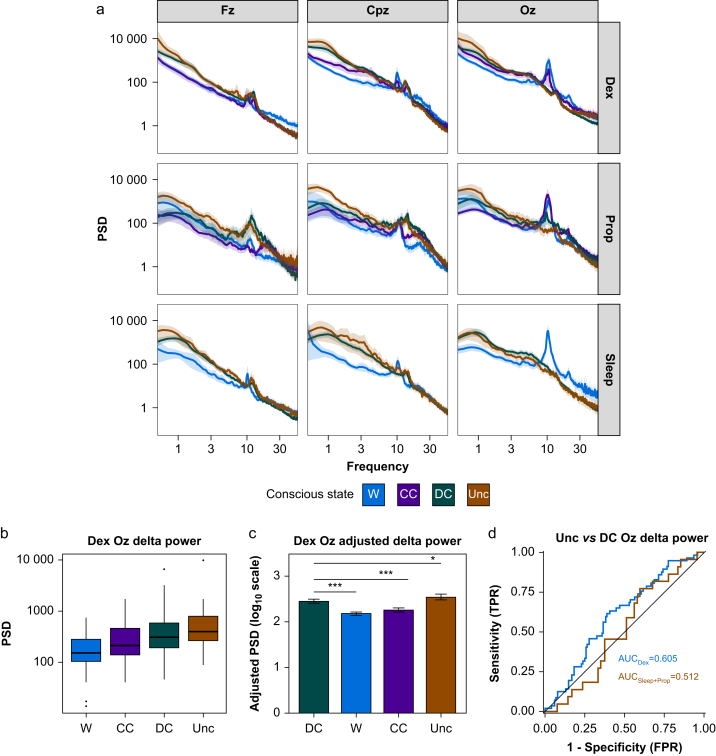
Methods: Volunteers were recruited for sedation with dexmedetomidine i.v., propofol i.v., or natural sleep with high-density EEG monitoring and serial awakenings to establish whether subjects were in states of disconnected consciousness or unconsciousness in the preceding 20 s. The primary outcome was classification of conscious states by occipital delta power (0.5-4 Hz). Secondary analyses included derivation (dexmedetomidine) and validation (sleep/propofol) studies of EEG signatures of conscious states.

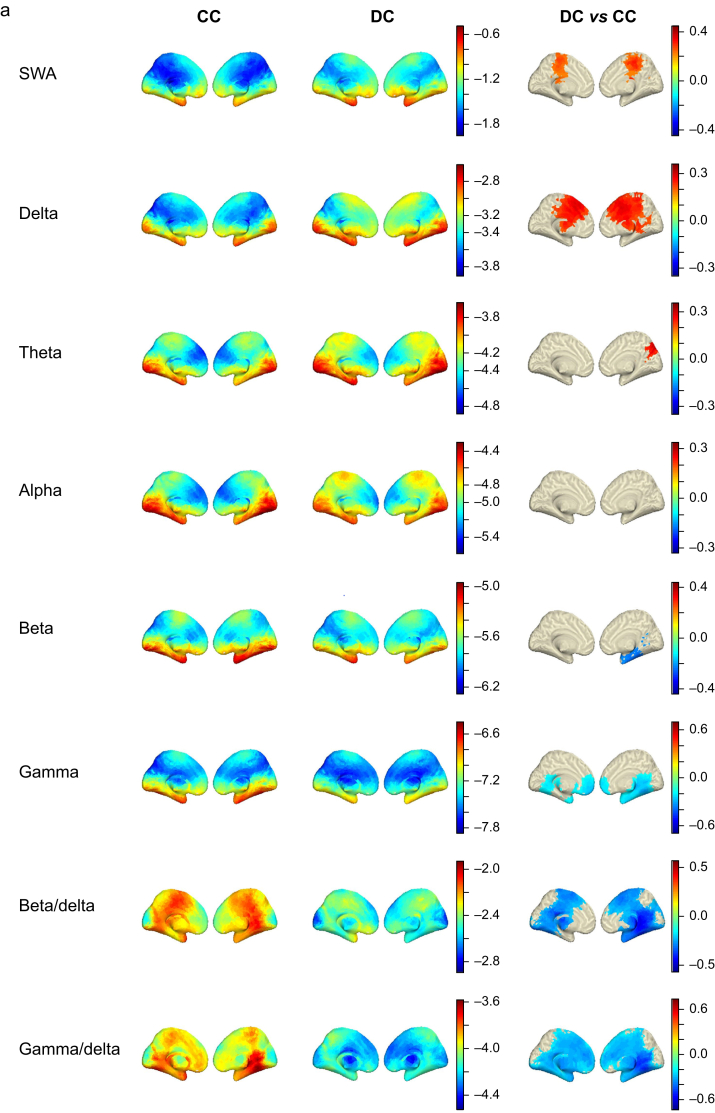
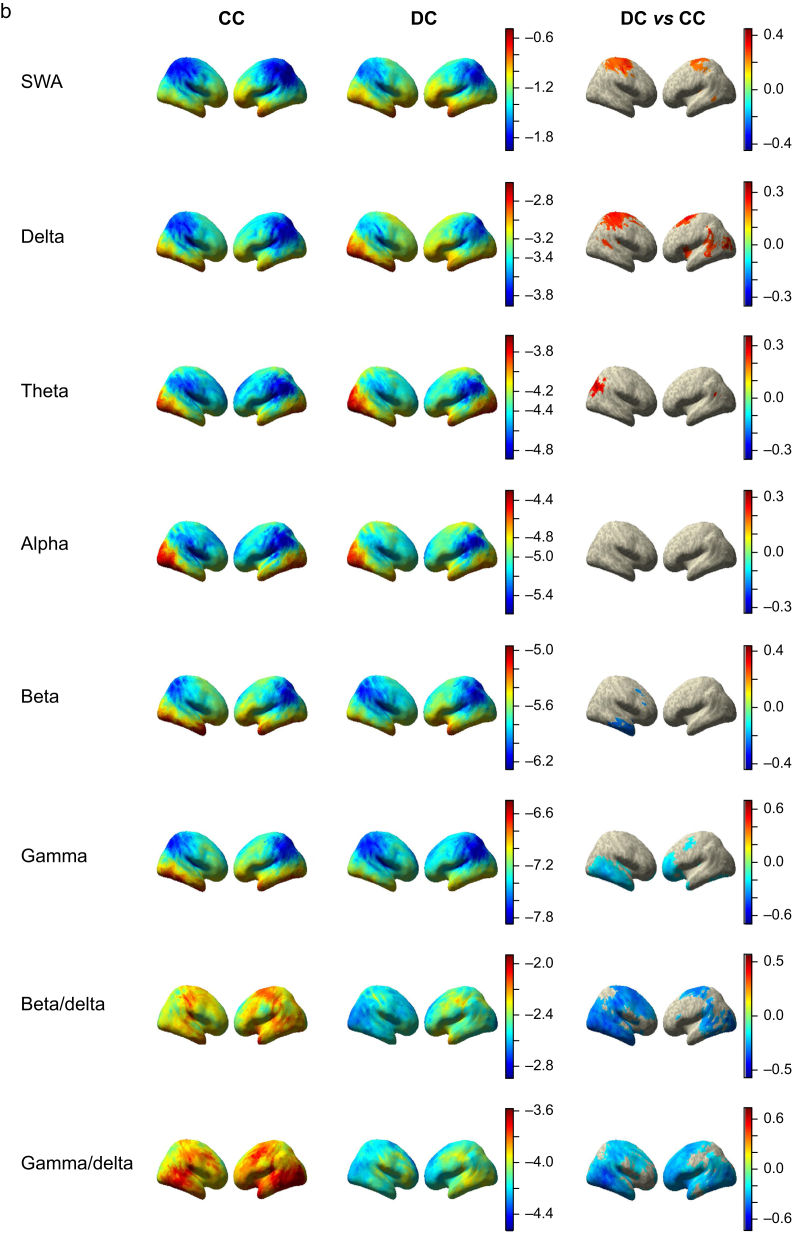
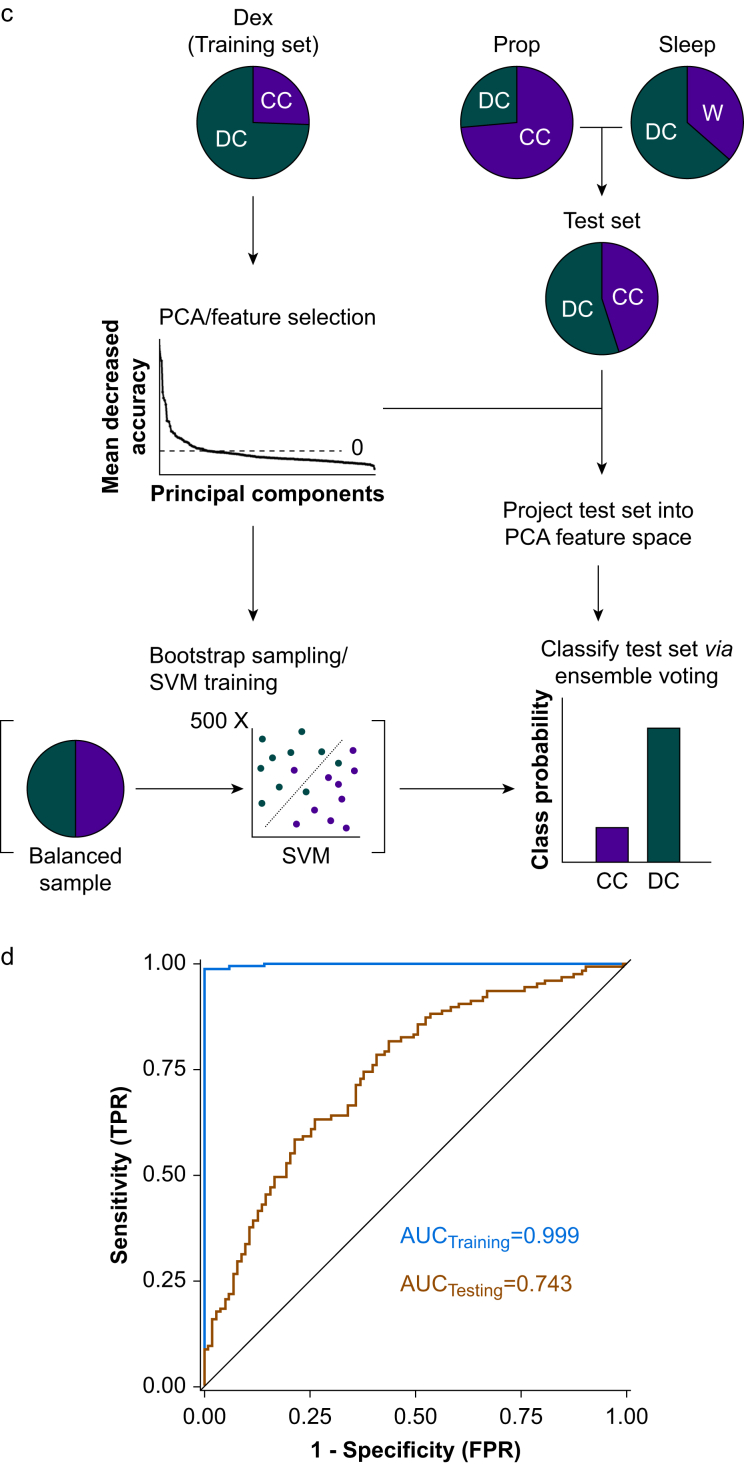
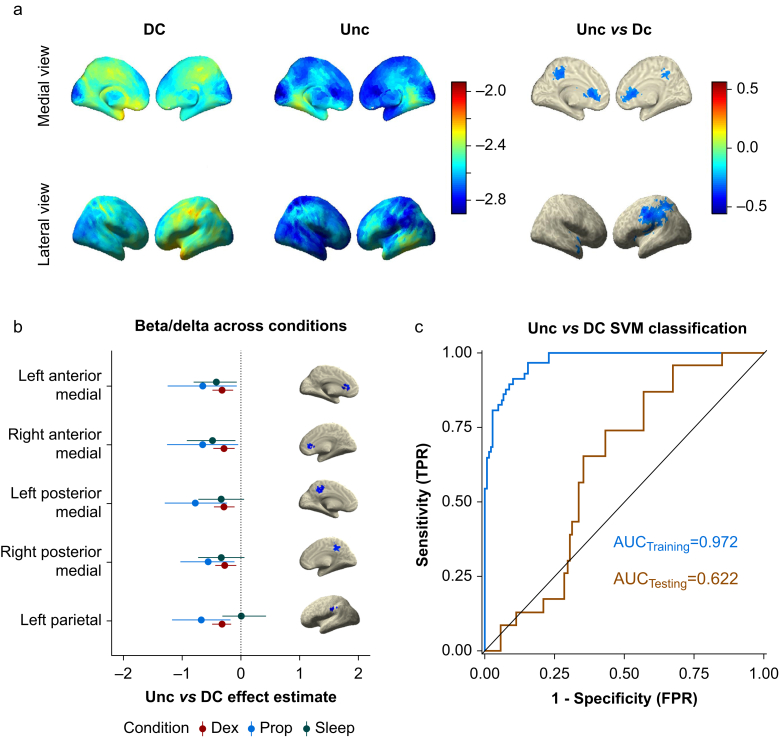
Results: Occipital delta power differentiated disconnected and unconscious states for dexmedetomidine (area under the curve [AUC] for receiver operating characteristic 0.605 [95% confidence interval {CI}: 0.516; 0.694]) but not for sleep/propofol (AUC 0.512 [95% CI: 0.380; 0.645]). Distinct source localised signatures of sensory disconnection (AUC 0.999 [95% CI: 0.9954; 1.0000]) and unconsciousness (AUC 0.972 [95% CI: 0.9507; 0.9879]) were identified using support vector machine classification of dexmedetomidine data. These findings generalised to sleep/propofol (validation data set: sensory disconnection [AUC 0.743 {95% CI: 0.6784; 0.8050}]) and unconsciousness (AUC 0.622 [95% CI: 0.5176; 0.7238]). We identified that sensory disconnection was associated with broad spatial and spectral changes. In contrast, unconsciousness was associated with focal decreases in activity in anterior and posterior cingulate cortices.

Conclusions: These findings may enable novel monitors of the anaesthetic state that can distinguish sensory disconnection and unconsciousness, and these may provide novel insights into the biology of arousal.

Clinical trial registration: NCT03284307.

Keywords: EEG; consciousness; dexmedetomidine; machine learning; propofol; sensory disconnection; sleep.


Figures

Fig 1
Fig 1
Wake report questions. Questions asked during wake reports to assess states of sensory connection and consciousness. Responses were evaluated by two members of the research team who had to agree on a state assignment of awake (W), connected consciousness (CC; conscious awareness of the environment), disconnected consciousness (DC; a conscious experience but no awareness of the environment, such as a dream), or unconsciousness (Unc; complete lack of experience) for a report to be included in the analyses.
Fig 2
Fig 2
Drug administration and wake report collection. a: Hypothetical drug dosing diagram illustrating experimental paradigm for serial wake reports, which results in multiple wake reports per subject. b: Distribution of analysed wake reports by state in each experimental condition. States coded as W (wake; connected consciousness pre-drug), CC (connected consciousness with drug), DC (disconnected consciousness), or Unc (unconsciousness). Additional wake-ups were attempted (Att), but the data were unusable because of either no verbal response (NVR) or ambiguous answers that could not be confidently classified (Amb). The final analysed counts by condition were (Dex) 330=398Att–12NVR–56Amb, (Prop) 88=104Att–7NVR–9Amb, and (Sleep) 188=202Att–2NVR–12Amb. c: Distribution of wake states across modelled plasma drug concentrations of Dex and Prop. d: Distribution of wake states by level of responsiveness as assessed by the OAAS. Dex, dexmedetomidine; OAAS, Observer's Assessment of Alertness/Sedation; Prop, propofol.
Fig 3
Fig 3
Scalp-level EEG power analysis. a: Scalp-level power spectral density (PSD) by frequency (average reference and Laplacian transformed) at the canonical electrodes Fz (frontal midline), Cpz (central midline), and Oz (occipital midline) across conditions. Experimental conditions show similar patterns of activity with a notable loss of occipital alpha (∼10 Hz) in DC and Unc relative to W and CC, and an increase in low-frequency activity (0.5–9 Hz) and decrease in high-frequency activity (16–55 Hz) across electrodes. b: Box plots comparing mean delta PSD at Oz across wake-ups for Dex. c: Bar plot of the adjusted delta PSD values (on a log10 scale) from a LMEM contrasting DC against all other states whilst controlling for predicted plasma drug concentration and subject-specific effects. Error bars represent bootstrapped standard errors. ∗P<0.05, ∗∗∗P<0.001. d: Empirical ROC curves for classifying Unc vs DC for Dex (red) and Sleep/Prop (purple). Black line represents chance performance (AUC=0.5). AUC, area under the curve; CC, connected consciousness; DC, disconnected consciousness; Dex, dexmedetomidine; FPR, false positive rate; LMEM, linear mixed effects model; Prop, propofol; ROC, receiver operating characteristic; TPR, true positive rate; Unc, unconsciousness.
Fig 4
Fig 4
Disconnected consciousness compared with connected consciousness across frequency bands. a: Medial view of voxel-wise predicted power (log10 scale colour coded) from LMEMs for CC (left column) and DC (middle column) across frequency bands. Right column shows differences between DC and CC states for all significant voxels after FDR correction for multiple comparisons. b: Same as in (a) but showing lateral view. c: Depiction of machine learning approach used to classify DC and CC data. Briefly, Dex data were used as a training set and subjected to PCA for dimensionality reduction before feature selection. The Prop and Sleep test data were projected into the same feature space. Training features were used to generate an ensemble of 500 SVMs, each trained using a different subset of the training data, bootstrap sampled with balanced class representation. The ensemble was applied to the test data by averaging the probability scores of all 500 models and selecting the class with the higher average probability. d: ROC curves for the ensemble learner, training using all bands except alpha, applied to the training set and test set with AUC quantification. The black line represents chance performance (AUC=0.5). AUC, area under the curve; CC, connected consciousness; DC, disconnected consciousness; Dex, dexmedetomidine; FDR, false discovery rate; LMEM, linear mixed effects model; PCA, principal component analysis; Prop, propofol; ROC, receiver operating characteristic; SVM, support vector machine; SWA, slow-wave activity.
Fig 4
Fig 4
Disconnected consciousness compared with connected consciousness across frequency bands. a: Medial view of voxel-wise predicted power (log10 scale colour coded) from LMEMs for CC (left column) and DC (middle column) across frequency bands. Right column shows differences between DC and CC states for all significant voxels after FDR correction for multiple comparisons. b: Same as in (a) but showing lateral view. c: Depiction of machine learning approach used to classify DC and CC data. Briefly, Dex data were used as a training set and subjected to PCA for dimensionality reduction before feature selection. The Prop and Sleep test data were projected into the same feature space. Training features were used to generate an ensemble of 500 SVMs, each trained using a different subset of the training data, bootstrap sampled with balanced class representation. The ensemble was applied to the test data by averaging the probability scores of all 500 models and selecting the class with the higher average probability. d: ROC curves for the ensemble learner, training using all bands except alpha, applied to the training set and test set with AUC quantification. The black line represents chance performance (AUC=0.5). AUC, area under the curve; CC, connected consciousness; DC, disconnected consciousness; Dex, dexmedetomidine; FDR, false discovery rate; LMEM, linear mixed effects model; PCA, principal component analysis; Prop, propofol; ROC, receiver operating characteristic; SVM, support vector machine; SWA, slow-wave activity.
Fig 5
Fig 5
Unconsciousness compared with disconnected consciousness using beta/delta ratio. a: Voxel-wise predicted power (log10 scale colour coded) from LMEMs for DC (left column) and Unc (middle column) using beta/delta ratio. Right column shows differences between Unc and DC states for all significant voxels after FDR correction for multiple comparisons. b: Unc vs DC effect estimates of beta/delta activity with bootstrapped 95% confidence intervals comparing experimental conditions within select ROI. Anterior medial and posterior medial cortex ROI show similar effects across all three conditions. The left parietal cortex ROI was consistent between Dex and Prop, but it failed to generalise for Sleep data. c: ROC curves for the ensemble learner, training using beta/delta activity in the five ROI shown in (c), applied to the training set and test set with AUC quantification. The black line represents chance performance (AUC=0.5). AUC, area under the curve; DC, disconnected consciousness; Dex, dexmedetomidine; FDR, false discovery rate; LMEM, linear mixed effects model; Prop, propofol; ROC, receiver operating characteristic; ROI, regions of interest; SVM, support vector machine; Unc, unconsciousness.

Comment in

References

    1. Boly M., Sanders R.D., Mashour G.A., Laureys S. Consciousness and responsiveness: lessons from anaesthesia and the vegetative state. Curr Opin Anaesthesiol. 2013;26:444–449. - PubMed
    1. Kotsovolis G., Komninos G. Awareness during anesthesia: how sure can we be that the patient is sleeping indeed? Hippokratia. 2009;13:83–89. - PMC - PubMed
    1. Cascella M. Mechanisms underlying brain monitoring during anesthesia: limitations, possible improvements, and perspectives. Korean J Anesthesiol. 2016;69:113–120. - PMC - PubMed
    1. Sanders R.D., Tononi G., Laureys S., Sleigh J.W. Unresponsiveness ≠ unconsciousness. Anesthesiology. 2012;116:946–959. - PMC - PubMed
    1. Purdon P.L., Pierce E.T., Mukamel E.A., et al. Electroencephalogram signatures of loss and recovery of consciousness from propofol. Proc Natl Acad Sci U S A. 2013;110:E1142–E1151. - PMC - PubMed

Publication types

Associated data