. 2022 May 2;28(9):1841-1853.
doi: 10.1158/1078-0432.CCR-21-1242.

cfTrack: A Method of Exome-Wide Mutation Analysis of Cell-free DNA to Simultaneously Monitor the Full Spectrum of Cancer Treatment Outcomes Including MRD, Recurrence, and Evolution

Affiliations

cfTrack: A Method of Exome-Wide Mutation Analysis of Cell-free DNA to Simultaneously Monitor the Full Spectrum of Cancer Treatment Outcomes Including MRD, Recurrence, and Evolution

Shuo Li et al. Clin Cancer Res. .

Abstract

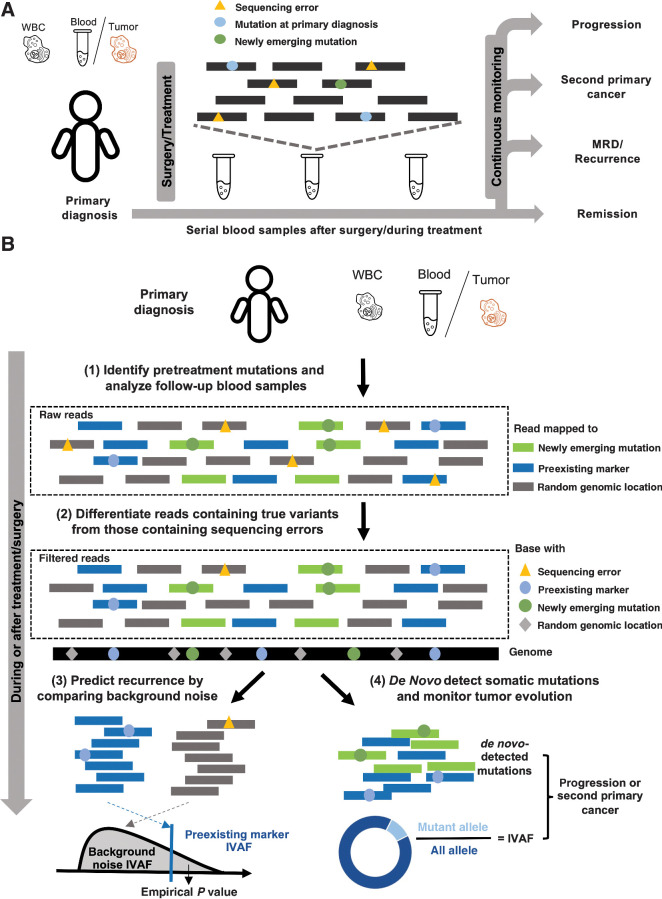
Purpose: Cell-free DNA (cfDNA) offers a noninvasive approach to monitor cancer. Here we develop a method using whole-exome sequencing (WES) of cfDNA for simultaneously monitoring the full spectrum of cancer treatment outcomes, including minimal residual disease (MRD), recurrence, evolution, and second primary cancers.

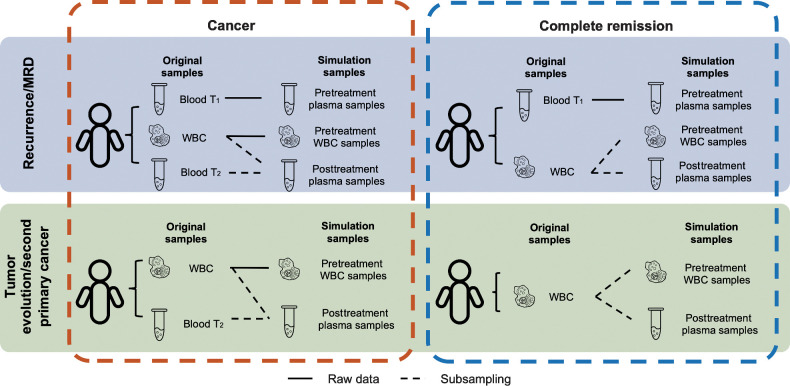
Experimental design: Three simulation datasets were generated from 26 patients with cancer to benchmark the detection performance of MRD/recurrence and second primary cancers. For further validation, cfDNA samples (n = 76) from patients with cancer (n = 35) with six different cancer types were used for performance validation during various treatments.

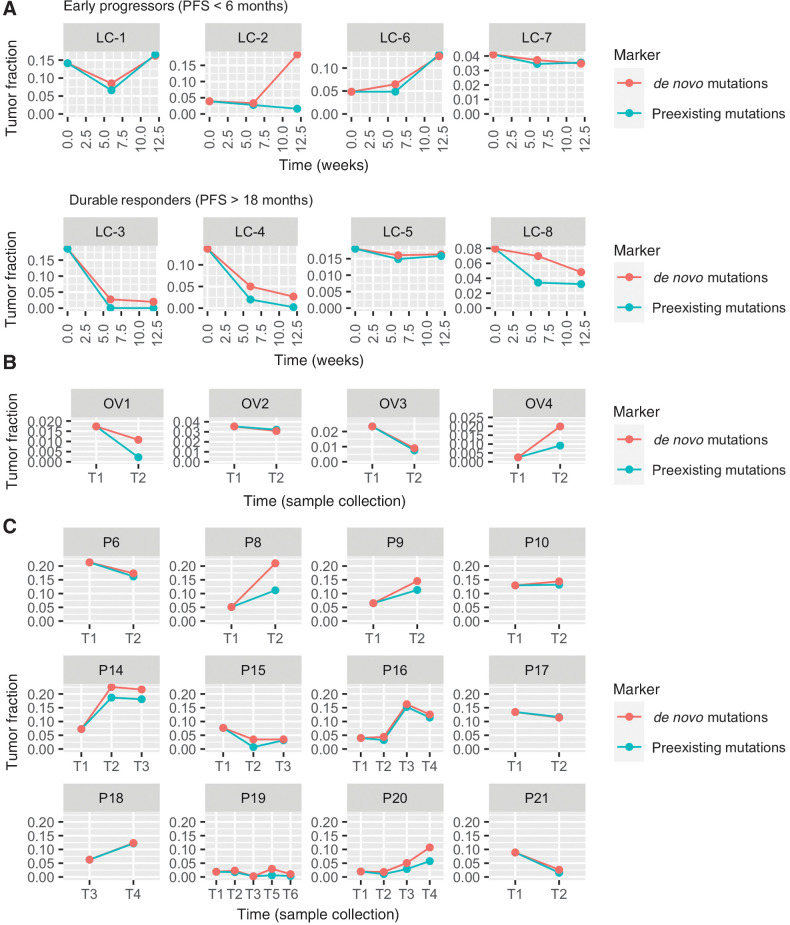
Results: We present a cfDNA-based cancer monitoring method, named cfTrack. Taking advantage of the broad genome coverage of WES data, cfTrack can sensitively detect MRD and cancer recurrence by integrating signals across known clonal tumor mutations of a patient. In addition, cfTrack detects tumor evolution and second primary cancers by de novo identifying emerging tumor mutations. A series of machine learning and statistical denoising techniques are applied to enhance the detection power. On the simulation data, cfTrack achieved an average AUC of 99% on the validation dataset and 100% on the independent dataset in detecting recurrence in samples with tumor fractions ≥0.05%. In addition, cfTrack yielded an average AUC of 88% in detecting second primary cancers in samples with tumor fractions ≥0.2%. On real data, cfTrack accurately monitors tumor evolution during treatment, which cannot be accomplished by previous methods.

Conclusions: Our results demonstrated that cfTrack can sensitively and specifically monitor the full spectrum of cancer treatment outcomes using exome-wide mutation analysis of cfDNA.


Figures

Figure 1. Cancer monitoring in plasma samples by tracking preexisting tumor mutations and newly emerging tumor mutations. A, Illustration of the sample collection for cfDNA-based cancer monitoring. Prior to surgery or therapy, a plasma or tumor sample and a WBC sample are collected to generate the preexisting tumor profile. Serial blood samples are collected to detect MRD/recurrence and monitor tumor evolution after treatment. B, Illustration of the method workflow. In the pretreatment samples, clonal tumor mutations are identified for tumor tracking in the posttreatment samples. Given a posttreatment plasma sample, the tumor fraction is calculated from the preexisting clonal tumor mutations and compared with a sample-specific background distribution. The empirical P value of the tumor fraction is used to predict MRD/recurrence. Furthermore, de novo somatic mutations are detected using cfSNV between the posttreatment plasma and WBC samples. A second primary cancer is predicted by a logistic regression model that accounts for both the amount of de novo mutations and the corresponding tumor fraction.
Figure 1.
Cancer monitoring in plasma samples by tracking preexisting tumor mutations and newly emerging tumor mutations. A, Illustration of the sample collection for cfDNA-based cancer monitoring. Prior to surgery or therapy, a plasma or tumor sample and a WBC sample are collected to generate the preexisting tumor profile. Serial blood samples are collected to detect MRD/recurrence and monitor tumor evolution after treatment. B, Illustration of the method workflow. In the pretreatment samples, clonal tumor mutations are identified for tumor tracking in the posttreatment samples. Given a posttreatment plasma sample, the tumor fraction is calculated from the preexisting clonal tumor mutations and compared with a sample-specific background distribution. The empirical P value of the tumor fraction is used to predict MRD/recurrence. Furthermore, de novo somatic mutations are detected using cfSNV between the posttreatment plasma and WBC samples. A second primary cancer is predicted by a logistic regression model that accounts for both the amount of de novo mutations and the corresponding tumor fraction.
Figure 2. Settings to generate in silico spike-in simulation data. The simulation data are generated using WES data taken from (i) 12 patients with MBC and 6 patients with CRPC and (ii) 8 patients with NSCLC. Each patient has an early plasma sample (Blood T1), a WBC sample (WBC), and a late plasma sample (Blood T2). The three WES datasets from a patient are used directly or mixed to generate the simulation samples. To simulate the scenario of monitoring a patient for MRD or cancer recurrence, each case contains three simulation samples: a pretreatment plasma sample, a pretreatment WBC sample, and a posttreatment plasma sample. The raw data from Blood T1 are used directly as the pretreatment plasma sample for all cases. WBC and Blood T2 are mixed at specified dilutions to simulate the posttreatment plasma sample. To simulate remission cases, we generate two independent random samplings from the raw WBC data to use as the pretreatment WBC sample and the posttreatment plasma sample. To simulate the emergence of second primary cancers, each case contains two simulation samples: a pretreatment WBC sample and a posttreatment plasma sample. The generation of simulation samples for second primary cancer monitoring is the same as for MRD/recurrence monitoring, except that the pretreatment plasma sample (Blood T1) is not used.
Figure 2.
Settings to generate in silico spike-in simulation data. The simulation data are generated using WES data taken from (i) 12 patients with MBC and 6 patients with CRPC and (ii) 8 patients with NSCLC. Each patient has an early plasma sample (Blood T1), a WBC sample (WBC), and a late plasma sample (Blood T2). The three WES datasets from a patient are used directly or mixed to generate the simulation samples. To simulate the scenario of monitoring a patient for MRD or cancer recurrence, each case contains three simulation samples: a pretreatment plasma sample, a pretreatment WBC sample, and a posttreatment plasma sample. The raw data from Blood T1 are used directly as the pretreatment plasma sample for all cases. WBC and Blood T2 are mixed at specified dilutions to simulate the posttreatment plasma sample. To simulate remission cases, we generate two independent random samplings from the raw WBC data to use as the pretreatment WBC sample and the posttreatment plasma sample. To simulate the emergence of second primary cancers, each case contains two simulation samples: a pretreatment WBC sample and a posttreatment plasma sample. The generation of simulation samples for second primary cancer monitoring is the same as for MRD/recurrence monitoring, except that the pretreatment plasma sample (Blood T1) is not used.
Figure 3. Performance of cancer recurrence and MRD detection using the simulation data. The area under the ROC curve (AUC) of the MRD/recurrence detection on the validation dataset (A) and the independent dataset (C) with different tumor fractions and sequencing depths. The sensitivity and specificity with different tumor fractions and sequencing depth on the validation dataset (B) and the independent dataset (D). Supplementary Figure S6A–S6D is the zoom-in of A–D at low tumor fraction ranging from 0% to 0.2%. E, AUCs of MRD/recurrence detection with and without error suppression (ES) on the validation dataset at 200× depth with different tumor fractions. F, The sensitivity and specificity of MRD/recurrence detection with and without error suppression on the validation dataset at 200× depth with different tumor fractions. In A, C, and E, the dots indicate the average AUC, and the vertical bars indicate average ± SD of the AUC (see Material and Methods). In B, D, and F, the dots show the average sensitivity using a cut-off P value = 0.05 for the background noise distribution; the vertical bars indicate average ± SD of the sensitivity; the specificity is shown in the legend in the format of [average specificity, (average − SD, average + SD)]. The solid lines show the smoothed performance fitted with logit functions.
Figure 3.
Performance of cancer recurrence and MRD detection using the simulation data. The area under the ROC curve (AUC) of the MRD/recurrence detection on the validation dataset (A) and the independent dataset (C) with different tumor fractions and sequencing depths. The sensitivity and specificity with different tumor fractions and sequencing depth on the validation dataset (B) and the independent dataset (D). Supplementary Figure S6A–S6D is the zoom-in of A–D at low tumor fraction ranging from 0% to 0.2%. E, AUCs of MRD/recurrence detection with and without error suppression (ES) on the validation dataset at 200× depth with different tumor fractions. F, The sensitivity and specificity of MRD/recurrence detection with and without error suppression on the validation dataset at 200× depth with different tumor fractions. In A, C, and E, the dots indicate the average AUC, and the vertical bars indicate average ± SD of the AUC (see Material and Methods). In B, D, and F, the dots show the average sensitivity using a cut-off P value = 0.05 for the background noise distribution; the vertical bars indicate average ± SD of the sensitivity; the specificity is shown in the legend in the format of [average specificity, (average − SD, average + SD)]. The solid lines show the smoothed performance fitted with logit functions.
Figure 4. Performance of second primary cancer detection with the simulation data. A, AUC of the in silico spike-in samples with different tumor fractions at 200× sequencing depth. The dots indicate the average AUC, and the vertical bars indicate average ± SD of the AUC (see Material and Methods). B, The sensitivity and specificity in the in silico spike-in samples with different tumor fractions at 200× sequencing depth. The dots show the average sensitivity using a cutoff of the 95th percentile of prediction scores from the remission samples in the training data; the vertical bars indicate average ± SD of the sensitivity; the specificity is shown in the text in the format of [average specificity, (average − SD, average + SD)]. The solid lines show the smoothed performance fitted with a logit function.
Figure 4.
Performance of second primary cancer detection with the simulation data. A, AUC of the in silico spike-in samples with different tumor fractions at 200× sequencing depth. The dots indicate the average AUC, and the vertical bars indicate average ± SD of the AUC (see Material and Methods). B, The sensitivity and specificity in the in silico spike-in samples with different tumor fractions at 200× sequencing depth. The dots show the average sensitivity using a cutoff of the 95th percentile of prediction scores from the remission samples in the training data; the vertical bars indicate average ± SD of the sensitivity; the specificity is shown in the text in the format of [average specificity, (average − SD, average + SD)]. The solid lines show the smoothed performance fitted with a logit function.
Figure 5. Longitudinal cfDNA monitoring in patients with cancer who received treatments. The lines show the tumor fraction in cfDNA during treatment. A, Tumor fraction in plasma samples of 8 patients with NSCLC who received anti-PD-1 immunotherapy. B, Tumor fraction in serum samples of 4 patients with ovarian cancer. C, Tumor fraction in plasma samples of 12 patients with prostate cancer.
Figure 5.
Longitudinal cfDNA monitoring in patients with cancer who received treatments. The lines show the tumor fraction in cfDNA during treatment. A, Tumor fraction in plasma samples of 8 patients with NSCLC who received anti-PD-1 immunotherapy. B, Tumor fraction in serum samples of 4 patients with ovarian cancer. C, Tumor fraction in plasma samples of 12 patients with prostate cancer.

References

    1. Mahvi DA, Liu R, Grinstaff MW, Colson YL, Raut CP. Local cancer recurrence: the realities, challenges, and opportunities for new therapies. CA Cancer J Clin 2018;68:488–505. - PMC - PubMed
    1. Chaudhuri AA, Chabon JJ, Lovejoy AF, Newman AM, Stehr H, Azad TD, et al. Early detection of molecular residual disease in localized lung cancer by circulating tumor DNA profiling. Cancer Discov 2017;7:1394–403. - PMC - PubMed
    1. Kumar SK, Rajkumar SV. The current status of minimal residual disease assessment in myeloma. Leukemia 2014;28:239–40. - PubMed
    1. Murtaza M, Dawson S-J, Pogrebniak K, Rueda OM, Provenzano E, Grant J, et al. Multifocal clonal evolution characterized using circulating tumour DNA in a case of metastatic breast cancer. Nat Commun 2015;6:8760. - PMC - PubMed
    1. Abbosh C, Birkbak NJ, Wilson GA, Jamal-Hanjani M, Constantin T, Salari R, et al. Phylogenetic ctDNA analysis depicts early-stage lung cancer evolution. Nature 2017;545:446–51. - PMC - PubMed

Publication types