. 2022 Feb 11;13(1):843.
doi: 10.1038/s41467-022-28473-8.

Single-cell RNA sequencing reveals time- and sex-specific responses of mouse spinal cord microglia to peripheral nerve injury and links ApoE to chronic pain

Affiliations

Single-cell RNA sequencing reveals time- and sex-specific responses of mouse spinal cord microglia to peripheral nerve injury and links ApoE to chronic pain

Shannon Tansley et al. Nat Commun. .

Abstract

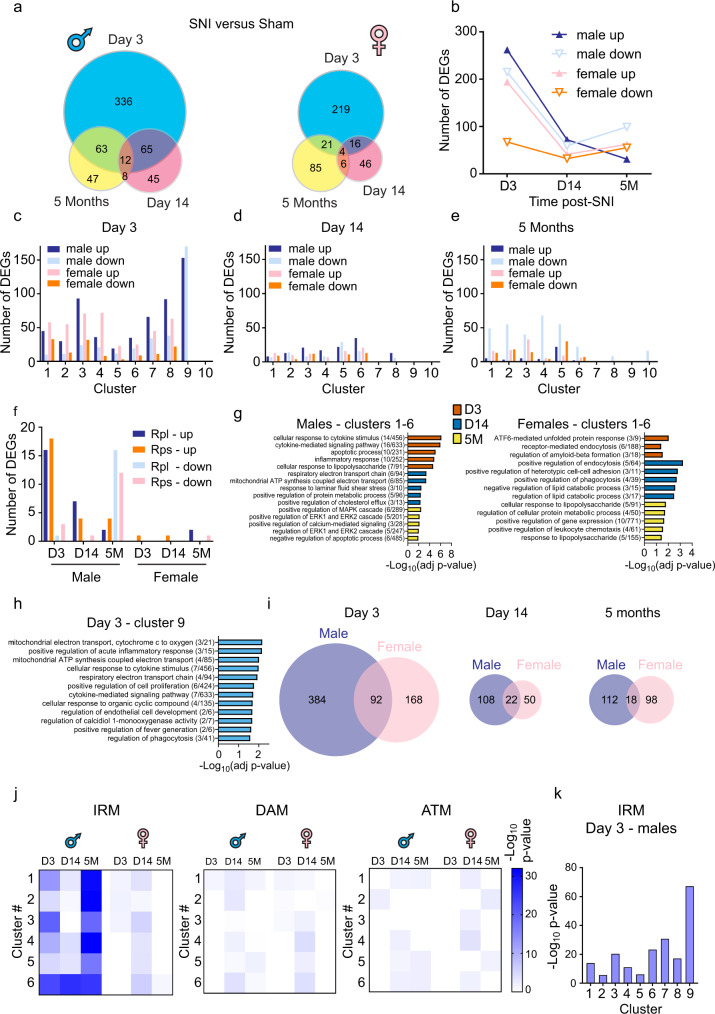
Activation of microglia in the spinal cord following peripheral nerve injury is critical for the development of long-lasting pain hypersensitivity. However, it remains unclear whether distinct microglia subpopulations or states contribute to different stages of pain development and maintenance. Using single-cell RNA-sequencing, we show that peripheral nerve injury induces the generation of a male-specific inflammatory microglia subtype, and demonstrate increased proliferation of microglia in male as compared to female mice. We also show time- and sex-specific transcriptional changes in different microglial subpopulations following peripheral nerve injury. Apolipoprotein E (Apoe) is the top upregulated gene in spinal cord microglia at chronic time points after peripheral nerve injury in mice. Furthermore, polymorphisms in the APOE gene in humans are associated with chronic pain. Single-cell RNA sequencing analysis of human spinal cord microglia reveals a subpopulation with a disease-related transcriptional signature. Our data provide a detailed analysis of transcriptional states of mouse and human spinal cord microglia, and identify a link between ApoE and chronic pain in humans.


Conflict of interest statement

The authors declare no competing interests.

Figures

Fig. 1
Fig. 1. Spinal cord microglia are present in several distinct subpopulations.
a A schematic illustration of the spared nerve injury (SNI) model of neuropathic pain. Paw-withdrawal threshold (data are presented as mean ± s.e.m.), as measured by von Frey filaments, was decreased following SNI in male (b, n = 12/group) and female (c, n = 8/group) C57BL/6 mice. d Microglia were isolated from the lumbar spinal cord of male and female mice, followed by tissue dissociation, FACS purification, and single-cell RNA sequencing (scRNA-seq). e UMAP plot reveals that microglia in the mouse spinal cord in all conditions are present in 11 distinct clusters. Inset shows proportion of cells in each cluster in naive mice. f UMAP plot showing the expression (log-normalized counts) of canonical microglial genes. g Expression of a top unique gene in the indicated cluster and its UMAP plot are shown.
Fig. 2
Fig. 2. Peripheral nerve injury induces changes in proportions of specific microglia subpopulations.
Proportion of microglia in each cluster in males (a) and females (c) is shown. Insets show the proportions of cells in clusters 7, 8, and 9. UMAPs of indicated conditions in males (b) and females (d), highlighting in color cluster 7, 8, and 9. e Proportion of microglia in clusters 7 and 8, combined, at day 3 post-SNI. Iba1 (microglia, red) and Ki67 (proliferating cells, green) immunostaining reveal proliferating microglia at day 3 post-SNI in males (f) and females (g). Similar results were obtained in two independent experiments. h Quantification of proliferating microglia (n = 4 mice/group, 3D SNI: male versus female, t(6)  = 5.342, p = 0.0018, unpaired two-tailed t-test). i Quantification of total number of microglia (n = 4 mice/group, ns (non-significant) indicates p > 0.05, unpaired two-tailed t-test). Data are plotted as mean ± s.e.m. Scale bar is 100 μm.
Fig. 3
Fig. 3. Changes in gene expression in microglia after peripheral nerve injury.
a Number of differentially expressed genes (DEGs) at day 3, day 14 and 5 months in males (left) and females (right). b Number of upregulated and downregulated DEGs in each sex/direction condition. Number of DEGs per cluster at day 3 (c), day 14 (d), and 5 months (e) post-SNI. f Number of upregulated and downregulated mRNAs encoding large (Rpl) and small (Rps) ribosomal protein subunits is shown. g Gene Ontology (GO) analysis of DEGs (after removing ribosomal mRNAs) in males and females in each time point for clusters 1-6 combined. The top 20 upregulated DEGs from each cluster were used for the analysis. h GO analysis for cluster 9 at day 3 post-SNI in males. The top 40 upregulated genes were used for the analysis. i Overlap between DEGs in male and female in each condition is shown. See Supplementary Data 3 for complete lists of DEGs per cluster per condition. j Genes in Injury-responsive microglia (IRM), Disease-associated microglia (DAM), and Axon tract-associated microglia (ATM) transcriptional signatures (lists of genes taken from, full lists are in Supplementary Data 5) were compared with DEGs in each condition for cluster 1–6 using two-sided Fisher’s exact test. Heatmap showing the enrichment for IRM, DAM, and ATM gene expression signature in each condition for cluster 1–6. White indicates no significant overlap (p > 0.05). Shades of blue (for p value < 0.05) indicate the significance of the overlap between two gene lists. k Enrichment for IRM signature in cluster 1–9 at day 3 post-SNI in males (Fisher’s exact test). See Supplementary Data 5 for numerical values of the analysis.
Fig. 4
Fig. 4. ApoE is increased in microglia in chronic phases of neuropathic pain.
a UMAPS of Apoe in different conditions in male mice. Color codes for Apoe log-normalized counts. Tables show fold change (LogFC) and rank of Apoe mRNA in the list of DEGs in males (b) and females (c). Cluster markers were identified using the FindallMakers function in Seurat (two-sided Wilcoxon rank-sum test with Bonferroni correction. Differentially expressed genes between groups were calculated using the Wilcoxon rank-sum test (two-sided) with Bonferroni correction. d Low magnification (top left) and high magnification images of the marked area showing immunostaining against Iba1, GFAP, ApoE, and NeuN in the mouse dorsal horn spinal cord section at day 14 post-SNI. Scale bar is 100 μm for low magnification and 10 μm for high magnification images. e Representative Airyscan images of Iba1, ApoE, and DAPI in the mouse dorsal horn, showing cytoplasmatic expression of ApoE. Scale bar is 10 μm for low magnification and 5 μm for high magnification images. f Representative images of immunostaining for ApoE and Iba1 in the spinal cord of male mice after SNI at day 3, day 14 and 5 months. Bottom images are magnification of area marked in corresponding upper images. Scale bar is 20 μm for low magnification and 10 μm for high magnification images. Similar results were obtained in two independent experiments. g Quantification of ApoE immunostaining signal in microglia in males and females (n = 3 males and three females per condition). ApoE was increased at day 14 and 5 months post-SNI as compared to corresponding sham groups (Day 3, sham versus SNI, q(35) = 0.917, p = 0.99; Day 14, sham versus SNI, q(35) = 11.93, p < 0.0001; 5 Months, sham versus SNI, q(35) = 20.58, p < 0.0001. Data are plotted as mean ± s.e.m., one-way ANOVA followed by Tukey’s multiple comparisons post hoc test. ****p < 0.0001; ns, not significant.
Fig. 5
Fig. 5. Polymorphisms in APOE are associated with chronic pain in humans.
a Haplotypes in the human APOE gene. The haplotypes are composed of specific alleles of SNPs rs429358 and rs7412, at distinct frequencies in the UK Biobank (UKB) cohort. ε3 is the ancestral haplotype. b A schematic diagram of human body indicating reported pain sites. c Haplotypic effects of APOE in human pain in males. For ce, the effects are depicted on the odds ratios (OR) scale, with 95% confidence intervals, for each pain sites (circles), for inverse standard-error weighted meta-analyzed results (Meta, lozenges), and for Alzheimer’s disease (AD, triangle). From left to right; effect of ε2 and ε4 in acute pain, and ε2 and ε4 in chronic pain. Insignificant P-values (P > 0.05) grayed out. d Haplotypic effects in females only. e Haplotypic effects in males and females combined. See methods section for description of analyses and statistical approaches. See Supplementary Data 6 for details of the analyses, including statistics and number of cases/controls.
Fig. 6
Fig. 6. scRNA-seq analysis of human spinal cord microglia.
a UMAP plot reveals that cells in the human spinal cord are present in 8 unique clusters (#1–8), plus two additional non-microglia clusters (#9–10). Inset shows the proportion of cells in each cluster. Expression (log-normalized counts) of canonical marker TREM2 and C1QA shown on top. b Heatmap showing expression of top 8 highly expressed genes in each cluster. Expression of genes is represented using a z-score value in which yellow indicates higher expression and purple indicates lower expression. See Supplementary Data 7 for a complete list of clusters markers. c Alluvial plot depicting the most affected biological processes for each cluster. Upregulated genes of each cluster were used for the analysis. Ribbon thickness indicates the number of genes per biological term. P value for each term is shown in brackets. d Heatmap showing the enrichment for IRM, DAM, and ATM gene expression signature in cluster markers for each cluster (two-sided Fisher’s exact test). White indicates no significant enrichment (p > 0.05). Shades of blue (for p values < 0.05) indicate the significance of the overlap between two gene lists. See Supplementary Data 8 for numerical values and a list of shared genes. e Heatmap showing correlation of transcriptomes (treated as bulk) of human microglia (H1, H2, and H3), mouse microglia (M1, M2, M3, and M4) and mouse neurons (neuron dataset taken from ref. ). Pearson correlation coefficient (r) is color coded by shades of blue. f Analysis of overlap between human and mouse microglia highly expressed transcripts for each cluster (two-sided Fisher’s exact test). The color-coded p-values indicate the significance of overlap. White indicates no significant overlap (p > 0.05).

References

    1. Echeverry S, Shi XQ, Zhang J. Characterization of cell proliferation in rat spinal cord following peripheral nerve injury and the relationship with neuropathic pain. Pain. 2008;135:37–47. - PubMed
    1. Eriksson NP, et al. A quantitative analysis of the microglial cell reaction in central primary sensory projection territories following peripheral nerve injury in the adult rat. Exp. Brain Res. 1993;96:19–27. - PubMed
    1. Chen G, Zhang YQ, Qadri YJ, Serhan CN, Ji RR. Microglia in pain: detrimental and protective roles in pathogenesis and resolution of pain. Neuron. 2018;100:1292–1311. - PMC - PubMed
    1. Jin SX, Zhuang ZY, Woolf CJ, Ji RR. p38 mitogen-activated protein kinase is activated after a spinal nerve ligation in spinal cord microglia and dorsal root ganglion neurons and contributes to the generation of neuropathic pain. J. Neurosci. 2003;23:4017–4022. - PMC - PubMed
    1. Raghavendra V, Tanga F, DeLeo JA. Inhibition of microglial activation attenuates the development but not existing hypersensitivity in a rat model of neuropathy. J. Pharm. Exp. Ther. 2003;306:624–630. - PubMed

Publication types

Substances