. 2022 Feb 11;13(1):830.
doi: 10.1038/s41467-022-28418-1.

Heterogeneous repolarization creates ventricular tachycardia circuits in healed myocardial infarction scar

Affiliations

Heterogeneous repolarization creates ventricular tachycardia circuits in healed myocardial infarction scar

Kamilla Kelemen et al. Nat Commun. .

Abstract

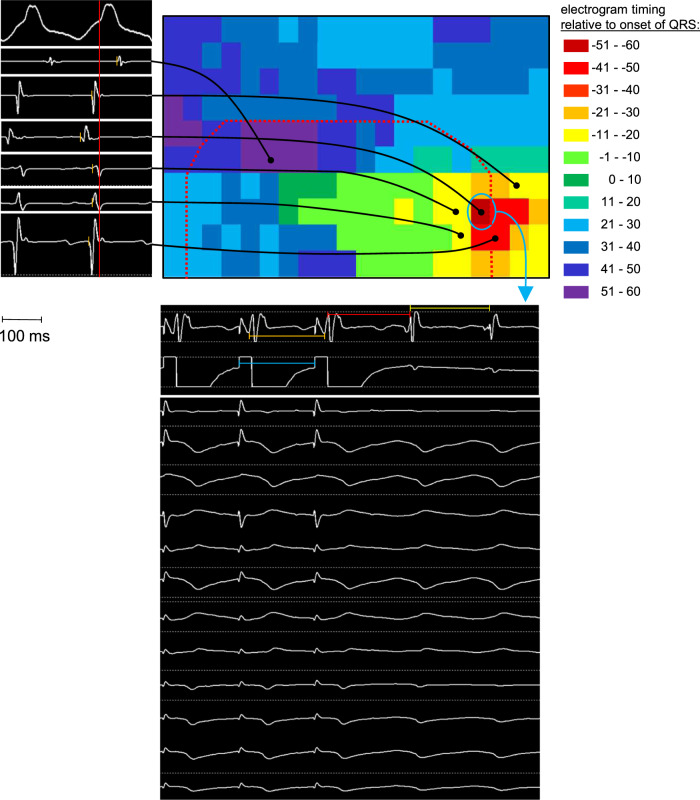
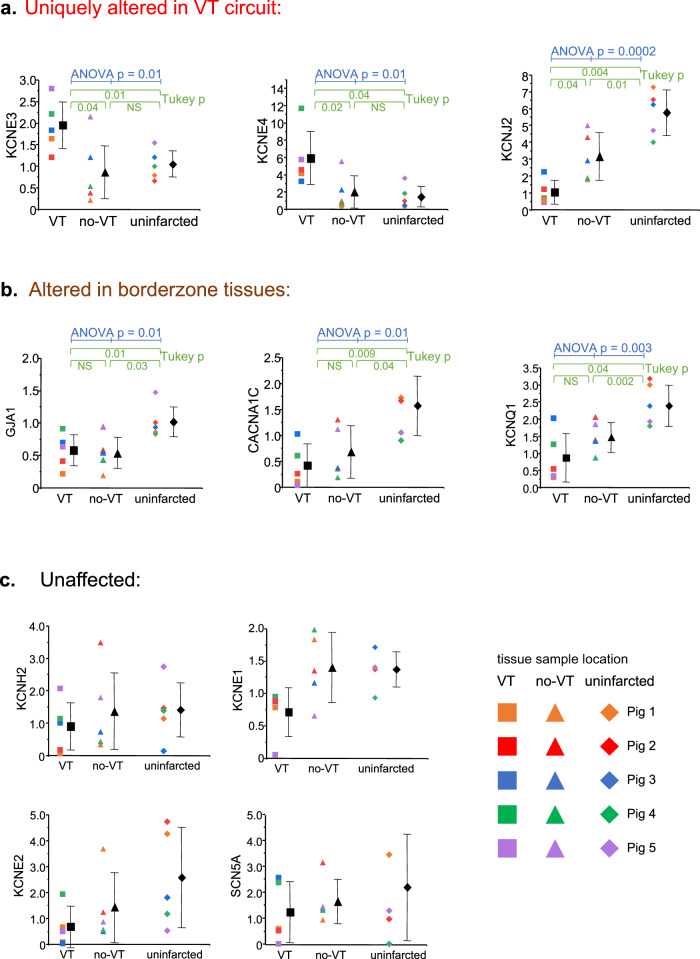
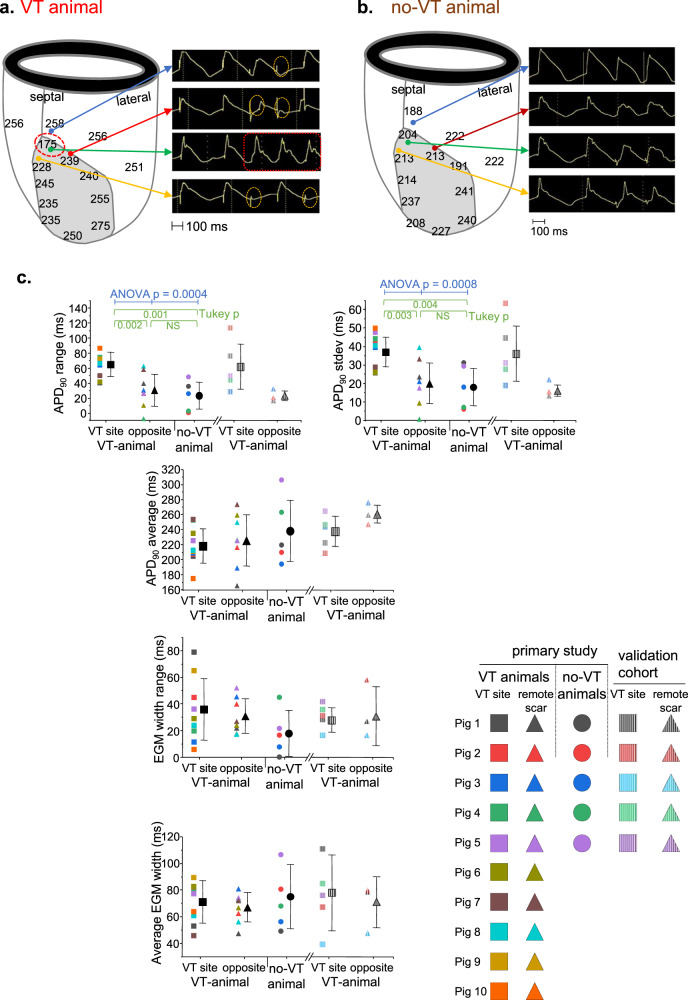
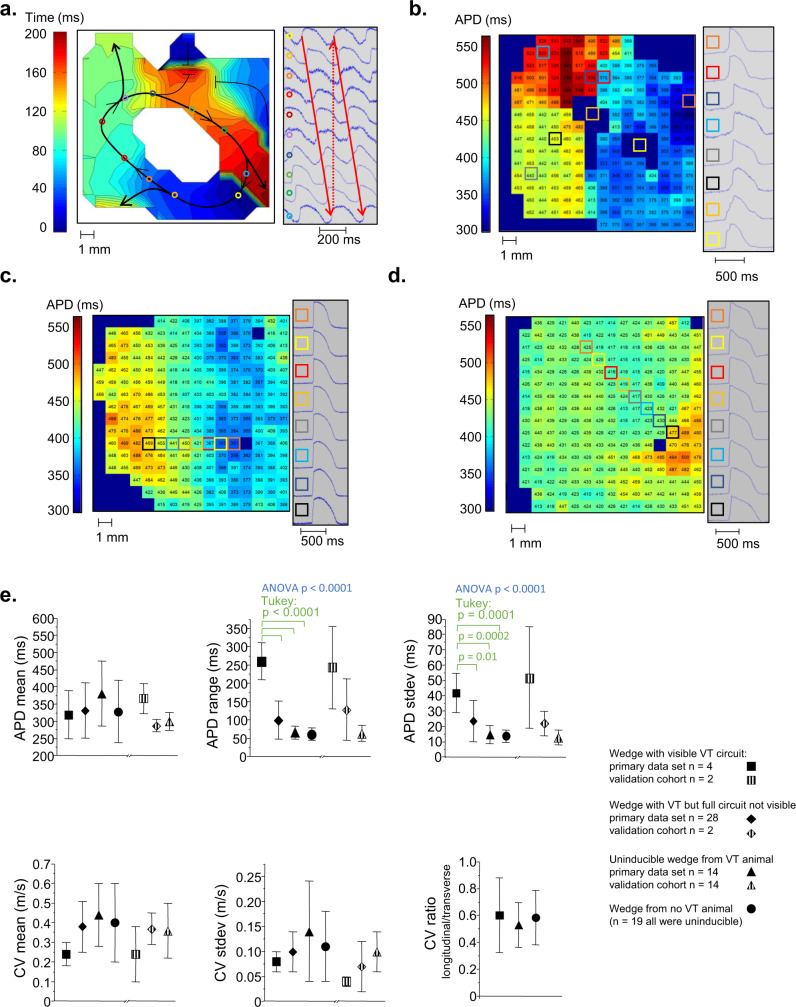
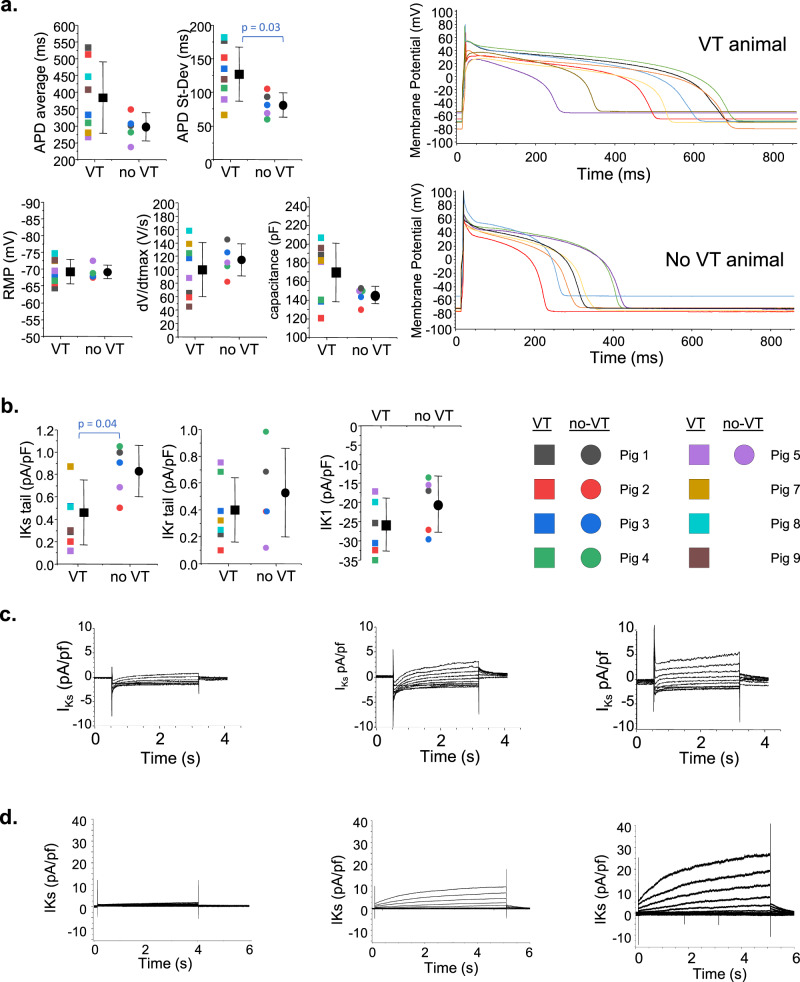
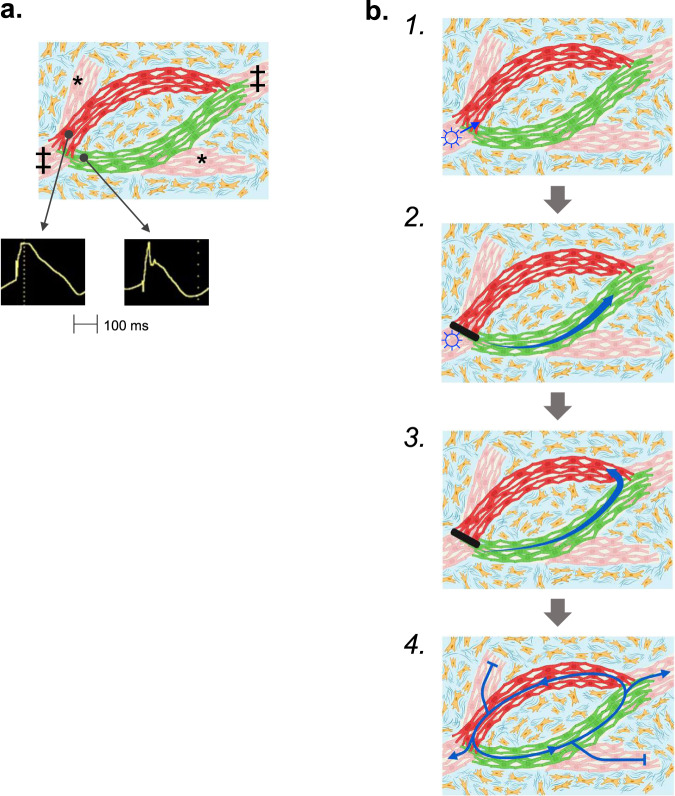
Arrhythmias originating in scarred ventricular myocardium are a major cause of death, but the underlying mechanism allowing these rhythms to exist remains unknown. This gap in knowledge critically limits identification of at-risk patients and treatment once arrhythmias become manifest. Here we show that potassium voltage-gated channel subfamily E regulatory subunits 3 and 4 (KCNE3, KCNE4) are uniquely upregulated at arrhythmia sites within scarred myocardium. Ventricular arrhythmias occur in areas with a distinctive cardiomyocyte repolarization pattern, where myocyte tracts with short repolarization times connect to myocytes tracts with long repolarization times. We found this unique pattern of repolarization heterogeneity only in ventricular arrhythmia circuits. In contrast, conduction abnormalities were ubiquitous within scar. These repolarization heterogeneities are consistent with known functional effects of KCNE3 and KCNE4 on the slow delayed-rectifier potassium current. We observed repolarization heterogeneity using conventional cardiac electrophysiologic techniques that could potentially translate to identification of at-risk patients. The neutralization of the repolarization heterogeneities could represent a potential strategy for the elimination of ventricular arrhythmia circuits.


Conflict of interest statement

The authors declare no competing interests.

Figures

Fig. 1
Fig. 1. The schematic depicts the VT mapping process, including example electrograms (top left), a graphical display of the activation time during VT (top right with markers showing the location of the example electrograms), and entrainment pacing from the site of earliest activation (local electrograms in the middle panel and 12-lead ECG at bottom).
The activation mapping process started by moving the catheter throughout the heart during VT, recording electrogram and marking catheter location at each site, and measuring the timing of each electrogram (top left panel, orange lines) against a fiduciary point in the surface ECG (red line in the top left panel). The activation time and location for each point was displayed graphically (top right). Overlaid on the activation map is the edge of the infarct scar (red dotted line) obtained from a separately performed sinus rhythm voltage map. After identifying earliest activation (blue circle in top right panel), we placed the catheter at that location and paced during VT at an output just above threshold and a cycle length 10 ms faster than the tachycardia cycle length. Local electrograms were recorded from the pacing electrodes and the closest adjacent bipole (middle panel). Local capture was confirmed by comparing the timing of the pacing stimulus (blue bar = 180 ms) to the adjacent electrogram (orange bar = 180 ms). Concealed entrainment criteria were met if the timing of the first return beat after pacing (red bar = 196 ms) was within 20 ms of the tachycardia cycle length (yellow bar = 190 ms), and if the paced QRS morphology exactly matched the VT morphology (bottom panel).
Fig. 2
Fig. 2. Comparison of mRNA expression of the principle cardiac ion channels and connexin 43 between the mapped VT site (square), a site harvested on the opposite side of the infarct scar from the VT site (triangle) and uninfarcted basal lateral myocardium (diamond).
Three patterns of expression emerged in the analysis. a Transcripts uniquely altered in the VT circuit. b Transcripts decreased generally in borderzone but not uniquely in VT circuits. c Transcripts that were not statistically different between the three tested sites. As noted in the text, for these experiments, n = 5 biologically independent animals. Mapped VT circuit sites are noted by square symbols, infarct scar tissue not involved in VT by triangle symbols, and uninfarcted myocardial sites by diamond symbols.  Data are reported as mean ± standard deviation. Data analysis included the Shapiro–Wilk test for normality followed by one-way ANOVA with the post-hoc Tukey test to assess differences. Source data are provided as a Source Data file.
Fig. 3
Fig. 3. Electrogram analysis from epicardial MAP and bipolar electrogram recordings during in vivo electrophysiology study.
a APD90 at the indicated sites is shown in the left panel for a single VT animal. The gray region is the infarct scar. The red dashed circle is the location of the mapped VT circuit. The right panel shows MAP recordings illustrating the response to abrupt shortening of the pacing cycle length. Heterogeneity in response to the faster stimulus occurs with sites having conduction delay or block (orange circles) adjacent to a site with continued conduction (red box). b A similar map from a no-VT animal shows more homogeneous APDs and uniform conduction with abrupt pacing rate change. c Summary data comparing APD and bipolar electrogram width. The analysis from the VT animals included four adjacent electrograms each from the mapped VT site (square) and a site on the opposite side of the infarct scar from the VT site (triangle). In the no-VT animals (circle), we used four adjacent electrograms from a site anatomically matched to the VT site in the VT animals. n = 10 biologically independent animals in the VT group, five biologically independent animals in the no-VT group, and five biologically independent animals in the validation cohort. Data are reported as mean ± standard deviation. Data analysis included the Shapiro–Wilk test for normality followed by one-way ANOVA with the post-hoc Tukey test to assess differences. Source data are provided as a Source Data file.
Fig. 4
Fig. 4. Optical mapping of myocardial borderzone tissues.
a The entire VT circuit was visible along a single tissue surface in four animals from the primary study and two additional animals in the validation cohort. An isochronal map of a complete VT circuit from one animal is shown. The colored circles indicate locations on the activation map where example pixels at right were located. The white central region had 2:1 activation and did not participate in the VT. b An APD map during 1000 ms fixed rate pacing of the full VT circuit tissue from (a). The colored boxes show locations on the APD map for the example electrograms at right. All observed VT circuits had tissue with short APDs in contact with long APD tissue. The area marked by the yellow and orange squares had complex, multicomponent activation so APD could not be measured. The APD map from tissue with inducible VT but not the complete circuit (c) and the APD map from a no-VT animal (d) are shown). e Summary data are reported as mean ± standard deviation. Data analysis included the Shapiro–Wilk test for normality followed by one-way ANOVA with the post-hoc Tukey test to assess differences. Source data are provided as a Source Data file.
Fig. 5
Fig. 5. Patch clamp analysis of cardiac myocytes isolated from the VT region in VT animals and from paired anatomic sites in no-VT animals.
(a) Action potentials show greater heterogeneity in APD for the VT site but no difference in average APD, RMP, or dV/dtmax. The right panel shows APDs recorded from all cells in a single VT animal compared to a single no-VT animal. b Average potassium currents are shown for the three prominent cardiac ventricular repolarizing currents. For the graphs in (a and b), n = 8 biologically independent animals in the VT group and five biologically independent animals in the no-VT group. Data are reported as mean ± standard deviation. Data analysis included the Shapiro–Wilk test for normality followed by Student’s t test to assess differences. c Variability of IKs measured from different cells taken within the VT region from a single animal is shown. Some cells had negligible current (left). Other cells had normal current values and morphologies (center), and other cells had increased IKs with a prominent instantaneous component. This variability was present in 5 of 8 VT animals and 0 of 5 no-VT animals. d IKs tracings from CHO-IKs cells transfected with KCNE4 (left), control (center), or KCNE3 (right). Source data are provided as a Source Data file.
Fig. 6
Fig. 6. Schematic illustrating the proposed mechanism for VT.
(a) Basic components of the circuit include surviving strands of myocardium (red, pink and green myocytes) interrupted by areas of fibrosis (blue areas with yellow fibroblasts). A strand of myocytes with shorter APDs (green) is adjacent to a strand of myocytes with longer APDs (red). The circuit connects to the rest of the heart (‡) and may connect to dead-end segments (*). b 1. VT starts with a premature beat (☼) that conducts through the surviving myocardial tissue strands until reaching a junction between short and long APD tissues. 2. If appropriately timed, the premature beat continues to conduct down the path with shorter APDs that has recovered excitability (green myocytes) and blocks in the path with longer APDs that is still refractory (red myocytes). 3. When the excitation wavefront reaches the distal connection between the two limbs of the circuit, it continues to conduct back up the long APD limb if that path has recovered excitability. 4. It then continues to conduct in a reentrant manner around the circuit.

References

    1. World Health Organization. World Health Organization fact sheet: the top 10 causes of death. http://origin.who.int/mediacentre/factsheets/fs310/en/ (2017). Accessed 4-October-2017.
    1. Myerburg RJ, Junttila MJ. Sudden cardiac death caused by coronary heart disease. Circulation. 2012;125:1043–1052. doi: 10.1161/CIRCULATIONAHA.111.023846. - DOI - PubMed
    1. Soo LH, Gray D, Hampton JR. Pathological features of witnessed out-of-hospital cardiac arrest presenting with ventricular fibrillation. Resuscitation. 2001;51:257–264. doi: 10.1016/S0300-9572(01)00417-8. - DOI - PubMed
    1. de Bakker J, et al. Reentry as a cause of ventricular tachycardia in patients with chronic ischemic heart disease: electrophysiologic and anatomic correlation. Circulation. 1988;77:589–606. doi: 10.1161/01.CIR.77.3.589. - DOI - PubMed
    1. Smith J, Green C, Peters N, Rothery S, Severs N. Altered patterns of gap junction distribution in ischemic heart disease. An immunohistochemical study of human myocardium using laser scanning confocal microscopy. Am. J. Pathol. 1991;139:801–821. - PMC - PubMed

Publication types