. 2022 Feb 11;13(1):836.
doi: 10.1038/s41467-022-28448-9.

Rhizosphere bacteriome structure and functions

Affiliations

Rhizosphere bacteriome structure and functions

Ning Ling et al. Nat Commun. .

Abstract

Microbial composition and functions in the rhizosphere-an important microbial hotspot-are among the most fascinating yet elusive topics in microbial ecology. We used 557 pairs of published 16S rDNA amplicon sequences from the bulk soils and rhizosphere in different ecosystems around the world to generalize bacterial characteristics with respect to community diversity, composition, and functions. The rhizosphere selects microorganisms from bulk soil to function as a seed bank, reducing microbial diversity. The rhizosphere is enriched in Bacteroidetes, Proteobacteria, and other copiotrophs. Highly modular but unstable bacterial networks in the rhizosphere (common for r-strategists) reflect the interactions and adaptations of microorganisms to dynamic conditions. Dormancy strategies in the rhizosphere are dominated by toxin-antitoxin systems, while sporulation is common in bulk soils. Functional predictions showed that genes involved in organic compound conversion, nitrogen fixation, and denitrification were strongly enriched in the rhizosphere (11-182%), while genes involved in nitrification were strongly depleted.


Conflict of interest statement

The authors declare no competing interests.

Figures
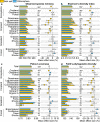
Fig. 1
Fig. 1. Diversity of bacterial communities: the rhizosphere versus bulk soil.
a observed species richness; b Shannon’s diversity index; c Pielou’s evenness; and d Faith’s phylogenetic diversity. Bar charts reflect mean value and standard errors for each category. The error bars on the columns represent the standard errors (SE). All dots represent the percentage change in effect size between rhizosphere and bulk soil bacterial diversity at 95% confidence intervals (CIs). Mean values <0 indicate greater diversity in the bulk soil bacterial community (yellow dots; depletion in the rhizosphere), while mean values >0 reflect significantly greater diversity in the rhizosphere bacterial community (blue dots). The intersection of the error bars and the zero line indicates that there is no significant difference between the bacterial communities in the rhizosphere and in the bulk soils (open dots). Sample size is showed by number of data pairs for each group. Mineral F and Organic A indicate the types of fertilization, which are mineral-only fertilization and organic amendments, respectively. Source data are provided as a Source Data file.
Fig. 2
Fig. 2. Differences in relative abundance of bacterial taxa between the rhizosphere and bulk soil.
a Difference at the amplicon sequence variants (ASV) level. Blue and yellow bubbles represent ASVs with significant enrichment (FDR < 0.05) in rhizosphere and bulk soil, respectively, based on statistical analysis with ALDEx2. Bubble sizes represent the ALDEx2 effect size between the relative abundance of ASV in the rhizosphere and in the bulk soils. The largest circles in black represent the phylum level, and the innermost circles in green represent the order level. All ASVs that can be annotated at genus level were marked next to the corresponding bubbles. b Differences at phylum level. Positive values indicate higher relative abundance of the phylum in rhizosphere, while negative values indicate higher relative abundance of the phylum in the bulk soil. The differences were statistically analyzed using ALDEx2. An asterisk (*) indicates a significant difference with FDR < 0.05 based on statistical analysis with ALDEx2. Source data are provided as a Source data file.
Fig. 3
Fig. 3. Global co-occurrence networks of bacterial amplicon sequence variants (ASVs) in the rhizosphere and in bulk soil.
a a co-occurrence in the global bulk soil; b, a co-occurrence in the global rhizosphere. Colors of nodes indicate the different major phyla. c Robustness of global bacterial networks in bulk soil (yellow dots) and the rhizosphere (blue dots) (bulk soils n = 1759 vs. rhizosphere n = 2182); d classification of nodes to identify the keystone ASVs in the networks. e Phylogenetic tree of keystone ASVs in the networks. The taxonomy of keystone ASVs is also labeled at the genus level in yellow in the global bulk soil network (a) and in blue in the global rhizosphere network (b). Source data are provided as a Source data file.
Fig. 4
Fig. 4. Dormancy potentials and heterotrophic strategies of bacterial communities in the rhizosphere and bulk soils.
a Differences in the abundances of toxin–antitoxin systems genes between communities in the rhizosphere and bulk soils; b differences in the sporulation factor abundances between communities in the rhizosphere and bulk soils; c differences in the weighted mean ribosomal operon copy numbers between communities in the rhizosphere and bulk soils. Bar charts reflect mean value and standard errors for each category. The error bars on the columns represent the standard errors (SE). Dots represent the percentage change in effect size between bacterial communities in the rhizosphere and bulk soils with 95% confidence intervals (CIs). Mean values <0 indicate a higher dormancy potential or heterotrophic strategy in bulk soil (yellow dots: depletion in the rhizosphere), while mean values >0 reflect a higher dormancy potential or heterotrophic strategy in the rhizosphere (blue dots). The intersection of the error bars and the zero line indicates that there is no significant difference between bacterial communities in the rhizosphere and bulk soils (open dots). Sample size is showed by number of data pairs for each group. Mineral F and Organic A indicate the types of fertilization, which are mineral-only fertilization and organic amendments, respectively. Source data are provided as a Source data file.
Fig. 5
Fig. 5. Functional potentials of bacterial communities in the rhizosphere and bulk soils.
The Faprotax annotated function differences related to nitrification, denitrification, methanol oxidation, nitrogen fixation, chitinolysis, ligninolysis, respiration of sulfur compounds, xylanolysis, methylotrophy, cellulolysis, ureolysis, and plant pathogens. Bar charts reflect mean value and standard errors for each category. The error bars on the columns represent the standard errors (SE). All dots represent the percentage change of the effect size between bacterial community function potentials in the rhizosphere and bulk soils with 95% confidence intervals (CIs). Mean values <0 indicate a higher function in bulk soil (yellow dots: depletion in the rhizosphere), while mean values >0 indicate a higher function in the rhizosphere (blue dots). The intersection of the error bar with the zero line indicates that there is no significant difference of the function between bacterial communities in the rhizosphere and bulk soils (open dots). Sample size is showed by number of data pairs for each group. Mineral F and Organic A indicate the types of fertilization, which are mineral-only fertilization and organic amendments, respectively. Source data are provided as a Source data file.
Fig. 6
Fig. 6. Conceptual figure showing the enrichment (red) and depletion (blue) of bacterial community taxa and functions in the rhizosphere relative to bulk soil.
The vertical arrows correspond to the intensity of the changes. The light peach-colored area around the root reflects the enrichment with available organics caused by exudates.

References

    1. Bulgarelli D, Schlaeppi K, Spaepen S, Ver Loren van Themaat E, Schulze-Lefert P. Structure and functions of the bacterial microbiota of plants. Annu. Rev. Plant Biol. 2013;64:807–838. - PubMed
    1. Leach JE, Triplett LR, Argueso CT, Trivedi P. Communication in the phytobiome. Cell. 2017;169:587–596. - PubMed
    1. Vorholt JA, Vogel C, Carlstrom CI, Muller DB. Establishing causality: opportunities of synthetic communities for plant microbiome research. Cell Host Microbe. 2017;22:142–155. - PubMed
    1. Jiang Y, et al. Plant cultivars imprint the rhizosphere bacterial community composition and association networks. Soil Biol. Biochem. 2017;109:145–155.
    1. Garbeva P, van Elsas JD, van Veen JA. Rhizosphere microbial community and its response to plant species and soil history. Plant Soil. 2008;302:19–32.

Publication types