. 2022 Feb 11;12(1):2341.
doi: 10.1038/s41598-022-06248-x.

ASCL1 phosphorylation and ID2 upregulation are roadblocks to glioblastoma stem cell differentiation

Affiliations

ASCL1 phosphorylation and ID2 upregulation are roadblocks to glioblastoma stem cell differentiation

Roberta Azzarelli et al. Sci Rep. .

Abstract

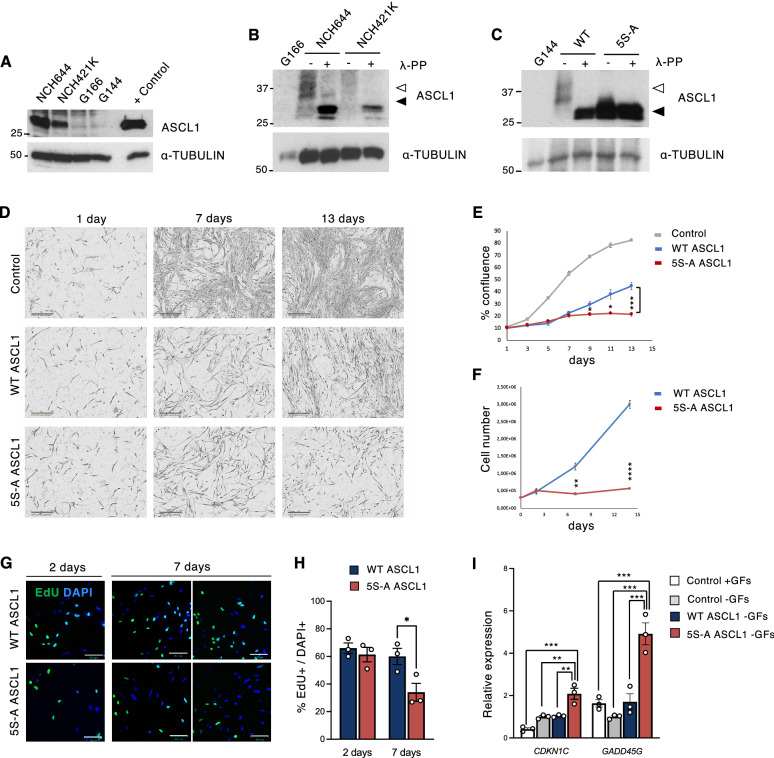
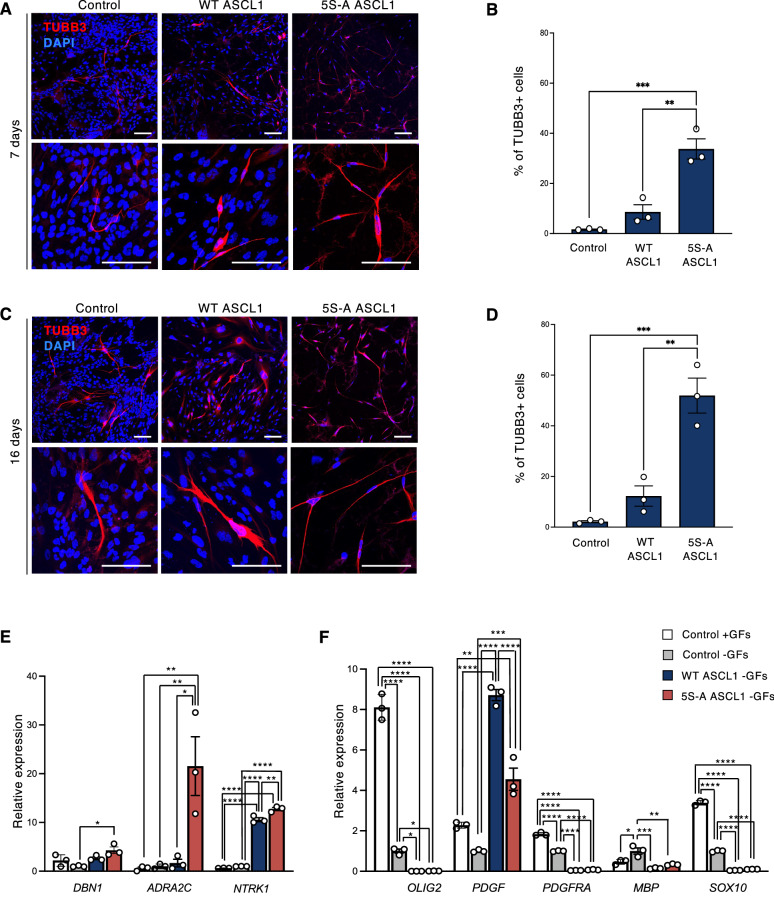
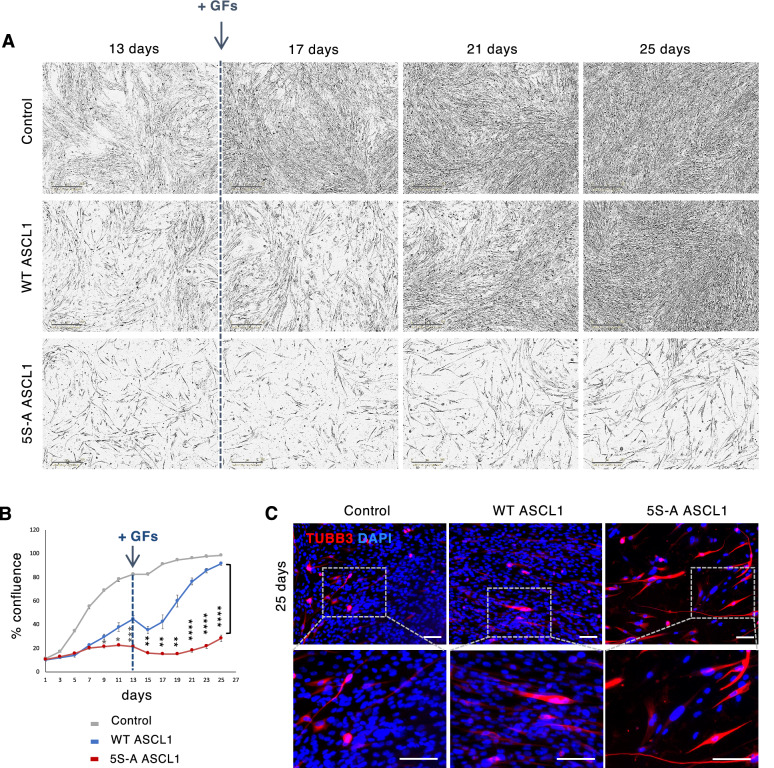
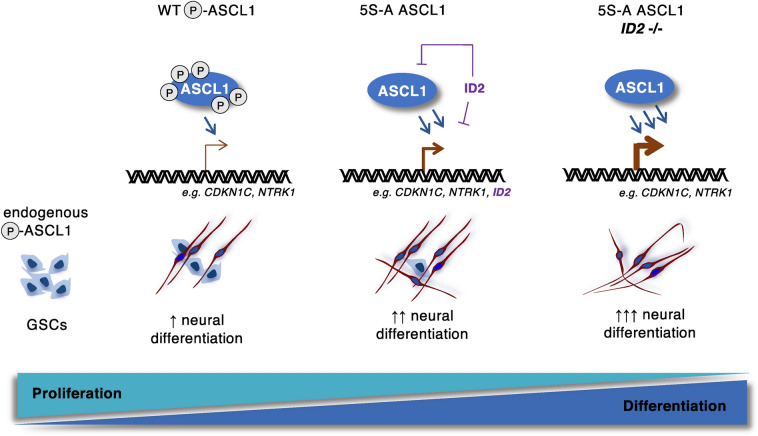
The growth of glioblastoma (GBM), one of the deadliest adult cancers, is fuelled by a subpopulation of stem/progenitor cells, which are thought to be the source of resistance and relapse after treatment. Re-engagement of a latent capacity of these cells to re-enter a trajectory resulting in cell differentiation is a potential new therapeutic approach for this devastating disease. ASCL1, a proneural transcription factor, plays a key role in normal brain development and is also expressed in a subset of GBM cells, but fails to engage a full differentiation programme in this context. Here, we investigated the barriers to ASCL1-driven differentiation in GBM stem cells. We see that ASCL1 is highly phosphorylated in GBM stem cells where its expression is compatible with cell proliferation. However, overexpression of a form of ASCL1 that cannot be phosphorylated on Serine-Proline sites drives GBM cells down a neuronal lineage and out of cell cycle more efficiently than its wild-type counterpart, an effect further enhanced by deletion of the inhibitor of differentiation ID2, indicating mechanisms to reverse the block to GBM cell differentiation.


Conflict of interest statement

The authors declare no competing interests.

Figures

Figure 1
Figure 1
ASCL1 phosphorylation regulates proliferation of human GSCs. (A) ASCL1 protein expression in GBM cell lines; positive control is after ASCL1 overexpression. (B) Western blot showing endogenous ASCL1 phosphorylation in GBM cells, with and without phosphatase (λ-PP) treatment. (C) Overexpression of WT and 5S-A ASCL1 in G144 cells, with and without λ-phosphatase treatment. White arrowheads in B and C indicate phosphorylated ASCL1, while black arrowheads indicate unphosphorylated ASCL1. (D) Representative images of G144 cells after growth factor withdrawal and dox-induced WT and 5S-A ASCL1 expression. Scale bars: 300 μm. (E) Quantification of cell confluence. Each data point is mean ± SEM. n = 3 independent experiments; one-way ANOVA followed by the Bonferroni post-hoc test; *p < 0.05; ***p < 0.001. All data points from day 3 onwards statistically differ between control and WT ASCL1 and between control and 5S-A ASCL1 (p < 0.05; not shown). (F) Quantification of cell number at 2, 7 and 14 days of ASCL1 induction. Data: mean ± SEM n = 3 independent experiments, t-test; **p < 0.01; ****p < 0.0001 (G) Immunofluorescence showing EdU incorporation. Scale bars: 100 μm. (H) Quantification of the % of EdU-positive cells. Data: mean ± SEM n = 3 independent experiments, t-test; *p < 0.05. (I) Expression of negative cell cycle regulators in G144 cells after 7 days of ASCL1 induction. Data: mean ± SEM, normalized to TBP. n = 3 independent experiments; one-way ANOVA followed by the Bonferroni post-hoc test; **p < 0.01; ***p < 0.001. Full length western blots are provided in Supplementary Fig. S1A, B and C.
Figure 2
Figure 2
Dephosphorylated ASCL1 promotes neuronal differentiation. (AC) Immunostaining for the neuronal marker TUBB3 (red) and quantification of the % of TUBB3+ cells over the total DAPI+ cells cultured for 7 (A,B) or 16 days (C,D) without growth factors and in the presence of dox to induce ASCL1 expression. Scale bars: 100 μm. Data: mean ± SEM n = 3 independent experiments; one-way ANOVA followed by the Bonferroni post-hoc test; **p < 0.01; ***p < 0.001. (E,F) Relative mRNA expression of different neuronal (E) and oligodendrocyte (F) markers at 7 days. Data: mean ± SEM, normalized to TBP. n = 3 independent experiments; one-way ANOVA followed by the Bonferroni post-hoc test; *p < 0.05; **p < 0.01; ***p < 0.001; ****p < 0.0001.
Figure 3
Figure 3
Dephosphorylated ASCL1 promotes stable mitotic exit and differentiation. (A) Representative images of G144 cells after removing ASCL1 induction and re-addition of growth factors. Scale bars: 300 μm. (B) Quantification of cell confluence. Data: mean ± SEM n = 2 independent experiments for Control + GFs and n = 3 independent experiments for the other conditions; one-way ANOVA followed by the Bonferroni post-hoc test; *p < 0.05; **p < 0.01; ***p < 0.001; ****p < 0.0001. All data points from day 3 onwards are statistically different between control and WT ASCL1 and between control and 5S-A ASCL1 (p < 0.05; not shown). (C) Immunostaining showing persistent expression of the neuronal marker TUBB3 (red) at 25 days of culture. Scale bars: 50 μm.
Figure 4
Figure 4
ID2 restrains differentiation induced by dephosphorylated ASCL1. (A) Relative mRNA expression of different members of the ID family at 7 days after WT and 5S-A ASCL1 expression. Data: mean ± SEM, normalized to TBP. n = 3 independent experiments; one-way ANOVA followed by the Bonferroni post-hoc test; ***p < 0.001; **** p < 0.0001. (B) Quantification of cell confluence. Each data point is mean ± SEM n = 3 independent experiments; one-way ANOVA followed by the Bonferroni post-hoc test; *p ≤ 0.05 between ID2−/− and 5SA-ASCL1; #p ≤ 0.05 between ID2−/− and ID2+/+. (C,D) Representative images of unedited control cells, ID2 wild type cells and ID2 homozygous knock-out cells, without (C) or with (D) dox-induced ASCL1 expression at increasing time points, as labelled. Scale bars: 100 μm. (E) Immunostaining for neuronal marker TUBB3 (green) at 14 days of culture in differentiation conditions. Scale bars: 100 μm. (F) Quantification of the % of TUBB3+ cells over the total DAPI+ cells at day 14. Data: mean ± SEM n = 3 independent experiments; one-way ANOVA followed by the Bonferroni post-hoc test; *p < 0.05. (H) Quantification of the total neurite length per cell. Data: mean ± SEM n = 3 independent experiments; one-way ANOVA followed by the Bonferroni post-hoc test; ****p < 0.0001.
Figure 5
Figure 5
Model showing that ASCL1 dephosphorylation and reduction of ID2 levels can enhance neuronal differentiation of glioblastoma stem cells.

Similar articles

Cited by

References

    1. Tamimi AF, Juweid M. Glioblastoma (ed S. De Vleeschouwer) Codon Publications; 2017. - PubMed
    1. Aldape K, et al. Challenges to curing primary brain tumours. Nat. Rev. Clin. Oncol. 2019;16:509–520. doi: 10.1038/s41571-019-0177-5. - DOI - PMC - PubMed
    1. Louis DN, et al. The 2016 World Health Organization classification of tumors of the central nervous system: A summary. Acta Neuropathol. 2016;131:803–820. doi: 10.1007/s00401-016-1545-1. - DOI - PubMed
    1. Singh SK, et al. Identification of human brain tumour initiating cells. Nature. 2004;432:396–401. doi: 10.1038/nature03128. - DOI - PubMed
    1. Galli R, et al. Isolation and characterization of tumorigenic, stem-like neural precursors from human glioblastoma. Cancer Res. 2004;64:7011–7021. doi: 10.1158/0008-5472.CAN-04-1364. - DOI - PubMed

Publication types

MeSH terms

Substances