. 2022 Feb 11;7(1):15.
doi: 10.1038/s41536-022-00212-z.

Telomerase is required for glomerular renewal in kidneys of adult mice

Affiliations

Telomerase is required for glomerular renewal in kidneys of adult mice

Margo Montandon et al. NPJ Regen Med. .

Abstract

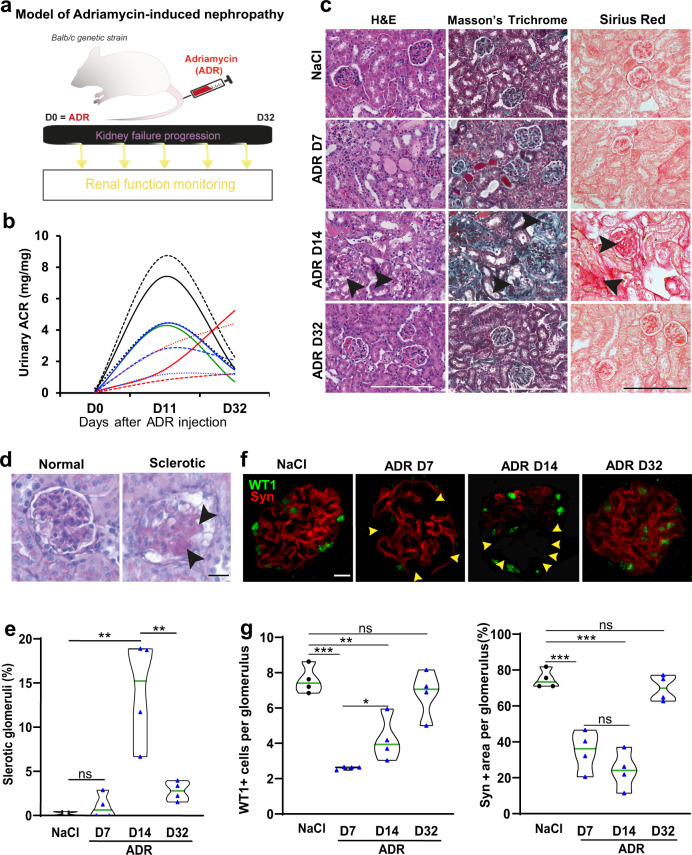
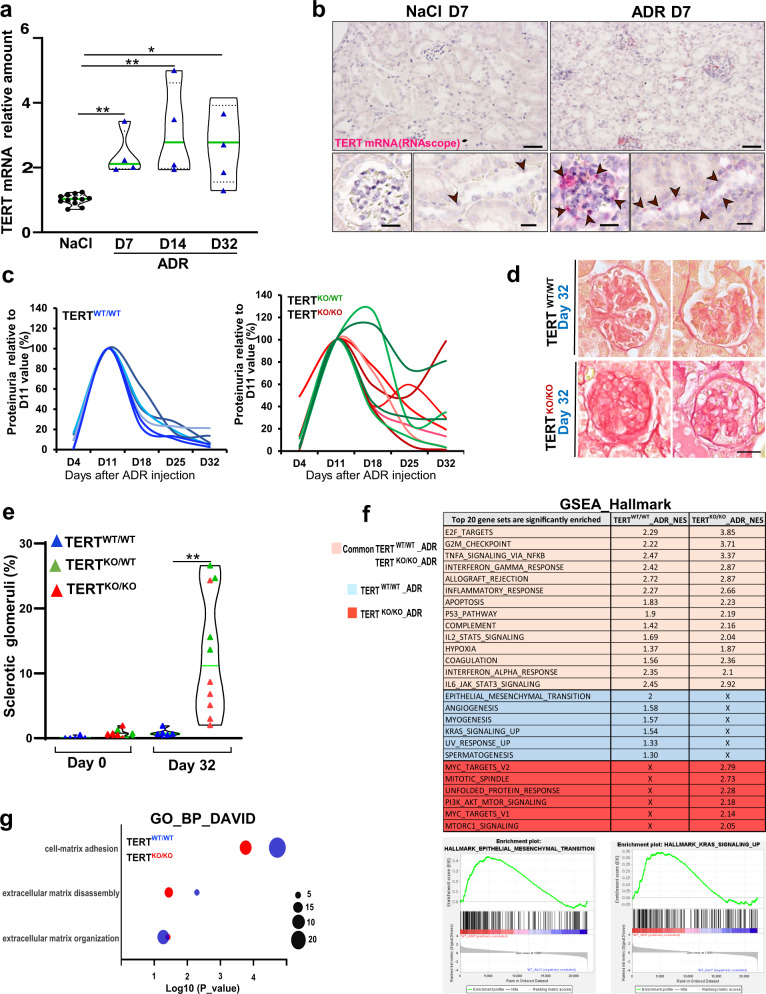
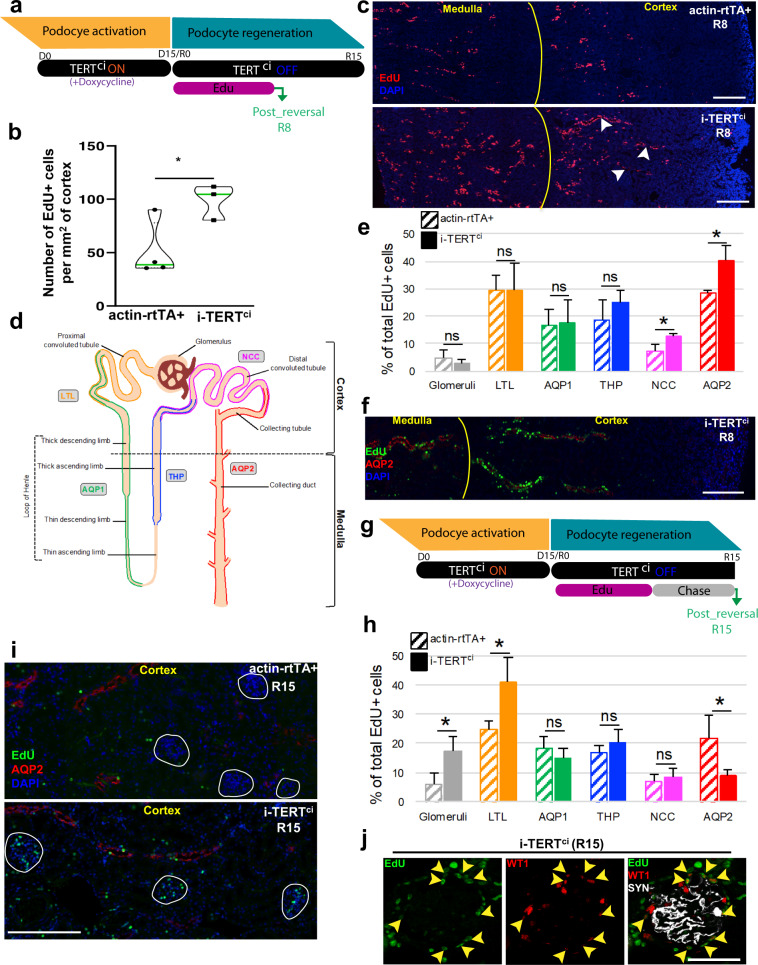
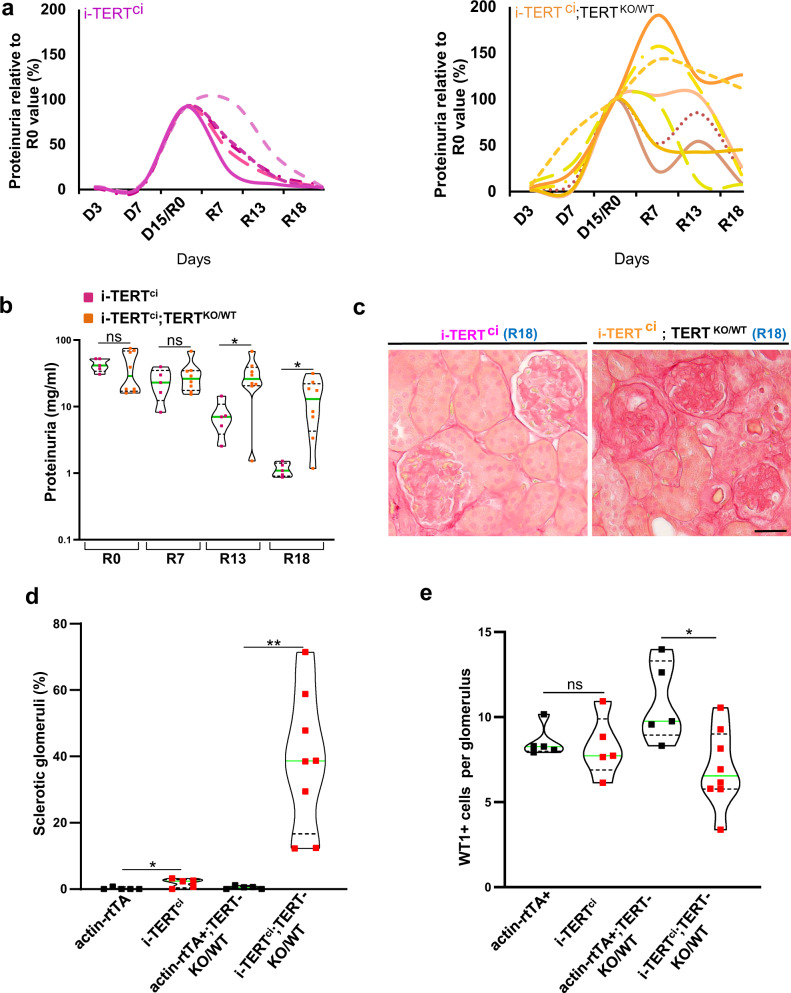
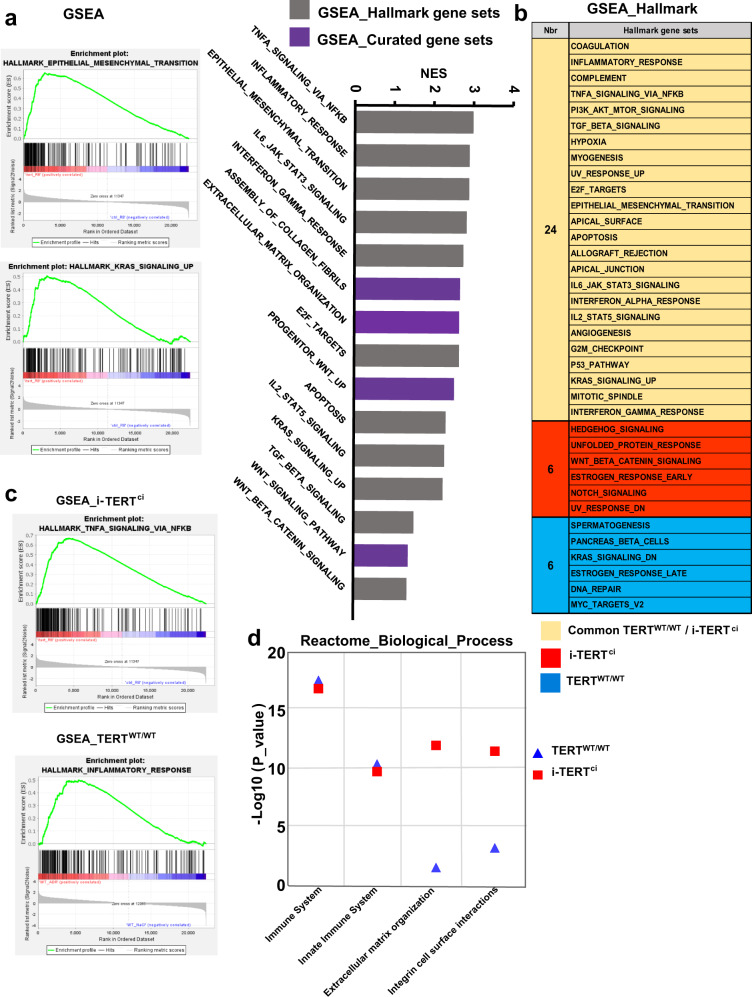
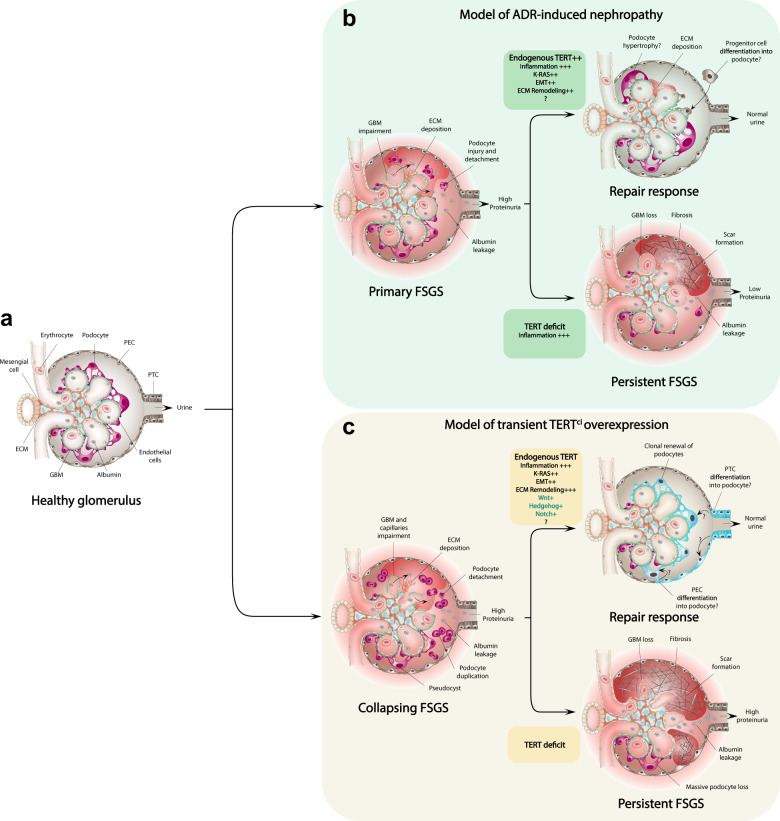
Homeostatic renal filtration relies on the integrity of podocytes, which function in glomerular filtration. These highly specialized cells are damaged in 90% of chronic kidney disease, representing the leading cause of end-stage renal failure. Although modest podocyte renewal has been documented in adult mice, the mechanisms regulating this process remain largely unknown and controversial. Using a mouse model of Adriamycin-induced nephropathy, we find that the recovery of filtration function requires up-regulation of the endogenous telomerase component TERT. Previous work has shown that transient overexpression of catalytically inactive TERT (i-TERTci mouse model) has an unexpected role in triggering dramatic podocyte proliferation and renewal. We therefore used this model to conduct specific and stochastic lineage-tracing strategies in combination with high throughput sequencing methods. These experiments provide evidence that TERT drives the activation and clonal expansion of podocyte progenitor cells. Our findings demonstrate that the adult kidney bears intrinsic regenerative capabilities involving the protein component of telomerase, paving the way for innovative research toward the development of chronic kidney disease therapeutics.


Conflict of interest statement

The authors declare no competing interests.

Figures

Fig. 1
Fig. 1. Renal filtration recovery in Adriamycin-induced nephropathy involves glomerular repair.
a Schematic representation of the Adriamycin-induced nephropathy model. BALB/c mice were injected with a single dose of 12 mg/kg of Adriamycin (ADR) or saline (NaCl 0.9%) (day 0, D0), then euthanized 7 (D7), 14 (D14), or 32 days (D32) after injection. Proteinuria was monitored in the time course of the experiment for each individual mouse. b Kinetic analysis of kidney filtration function assessed by [albumin/creatinine ratio (ACR)] measurement in urine samples of ADR-injected female BALB/c mice (n = 10), before injection (D0), 11 (D11), and 32 (D32) days after injection. Data are represented for each animal in (mg/mg). c H&E (left panels), Masson Trichrome (middle panels), and Sirius Red (right panels) stained kidney sections of BALB/c mice injected with saline (NaCl) or collected 7 (D7), 14 (D14), and 32 (D32) days after ADR injection. Scale bar = 200 µm. d Glomerular histology by PAS (Periodic Acid Schiff) from saline (Normal) or ADR-injected (Sclerotic) BALB/c mice. Scale bar = 30 µm. Arrowheads: sclerotic area. e Quantification of glomeruli with abnormal morphology (such as displayed in (d)) in kidney sections of BALB/c mice injected with saline (NaCl) or collected 7 (D7), 14 (D14), and 32 (D32) days after ADR injection (n = 4 for each group). For each animal, all glomeruli (about 150) on the whole kidney section were analyzed. Data are shown for each animal and the mean value for each group is shown as a green line. **p = 0.0035, and **p = 0.0098 by t-test for ADR-D14 versus saline and for ADR-D32 versus ADR-D14, respectively. f Double immunostaining for the podocyte-restricted markers Synaptopodin (Syn, red) and Wilms tumor protein 1 (WT1, green), in kidney section from saline or ADR-injected mice, 7 (D7), 14 (D14), and 32 days (D32) after ADR injection showing effacement of podocytes starting from 7 days post-ADR treatment (arrowheads) followed by marked normalization of podocytes at day 32. Scale bar = 15 µm. g Left panel: Quantification of the mean number of WT1 positive cells per glomerular cross section. ***p = 0.0001, and **p = 0.0037 by t-test for ADR-D7 and ADR-D14 versus saline respectively. *p = 0.0415 by t-test for ADR-D14 versus ADR-D7. Right panel: Quantification of the percentage of Synaptopodin positive area per glomerulus. ***p = 0.0006, and ***p = 0.0001 by t-test for ADR-D7 and ADR-D14 versus saline respectively. For each animal (n = 4 for each group), all glomeruli (about 150) on the whole kidney section were analyzed.
Fig. 2
Fig. 2. Endogenous TERT is required for glomerular repair following ADR-induced nephropathy.
a TERT mRNA levels by RT-qPCR in whole kidneys from saline (NaCl, n = 12) and ADR-injected mice (ADR, n = 4 for each group) collected 7 (D7), 14 (D14), and 32 (D32) days after injection. Data are shown for each animal and the mean value for each group is shown as a green line. **p = 0.006 by t-test for ADR-D7 versus saline. **p = 0.005 by t-test for ADR-D14 versus saline. *p = 0.014 by t-test for ADR-D32 versus saline. b In situ hybridization for TERT mRNA using RNAscope on kidney sections from saline and ADR-injected mice sacrificed 7 days after injection. Upper panels, scale bar = 50 µm. Lower panels, scale bar = 20 µm. Arrowheads: cells expressing detectable amounts of TERT mRNA. c Kinetic analysis by Bradford assay of proteinuria after ADR injection of female BALB/c N10 control mice (TERTWT/WT, blue) (left panel) and female BALB/c N10 mice carrying a full invalidation (TERTKO/KO, red) or heterozygous invalidation (TERTKO/WT, green) (right panel) of TERT. d Glomerular histology by Sirius Red from ADR-injected TERTWT/WT and TERTKO/KO mice 32 days after ADR injection. Scale bar = 20 µm. e Quantification of glomeruli with abnormal morphology (such as displayed for TERTKO/KO mice in (d)), in kidney sections from TERTWT/WT (n = 6, blue triangles), TERTKO/WT (n = 4, green triangles) and TERTKO/KO (n = 6, red triangles) mice collected before ADR injection (Day 0), and 32 days after ADR injection (Day 32). For each animal, all glomeruli (about 150) on the whole kidney section were analyzed. Data are shown for each animal and mean value for each group is shown as a green line. **p = 0.0071 by t-test for TERT knockout versus control mice at day 32. f Comparison of the top 20 enriched gene signatures found by Gene Set Enrichment Analysis (GSEA) Hallmark in TERTWT/WT and TERTKO/KO mice 18 days after ADR injection. Common gene signatures between TERTWT/WT and TERTKO/KO mice are highlighted in tan, gene signatures only enriched in TERTWT/WT mice are highlighted in blue, and gene signatures only enriched in TERTKO/KO mice are highlighted in red. NES stands for normalized enrichment score. Enrichment profiles of Epithelial-to-Mesenchymal transition and KRAS signaling UP are shown. g Database for Annotation, Visualization and Integrated Discovery (DAVID) analysis showing the status of GO-term (Biological Process) related to the extracellular matrix (ECM) in TERTWT/WT (blue) and TERTKO/KO (red) mice 18 days after ADR injury. The size of the circles is proportional to the number of genes attributed to each GO-term.
Fig. 3
Fig. 3. Catalytically-inactive TERT overexpression triggers podocyte renewal from a non-podocyte source.
a Schematic of the inducible-TERTci (i-TERTci) bi-transgenic system. The actin-rtTA+ transgene encodes the reverse tetracycline repressor (rTetR) fused to the transcription activation C-terminal domain of virion protein 16 (VP16) of herpes simplex virus (HSV). The resulting hybrid transactivator, called reverse tetracycline-controlled transactivator (rtTA), stimulates promoters fused to tetracycline operator (tetO) sequences in the presence of the inducer doxycycline (Dox). A CAG (cytomegalovirus (CMV) early enhancer/chicken beta-actin) promoter drives widespread expression of rtTA in the mouse. On the second tetop-TERTci + transgene, the sequence encoding TERTci is under the control of a tetracycline-responsive promoter element (TRE), composed of seven tetO sequences, that is linked to the CMV early enhancer element. In the presence of the tetracycline analog doxycycline, provided into the drinking water of the animals, high expression of TERTci is induced in i-TERTci mice. b Kinetic analysis of kidney filtration function assessed by [albumin/creatinine ratio (ACR)] measurement from single transgenic actin-rtTA + (n = 3, black) and i-TERTci (n = 3, pink) mice. Data are shown for each animal. c Schematic representation of the experimental design. Tamoxifen was injected 5 days prior to doxycycline treatment to induce permanent EGFP tagging of mature podocytes. Transient TERTci overexpression (TERTci ON) in i-TERTci mice was then induced for 15 days (D15) by the mean of doxycycline treatment, then the mice were subsequently submitted to a reversal period (TERTci OFF) for 20 days (R20) during which proteinuria gradually regressed. d Double immunostaining for Synaptopodin (SYN, red) and EGFP (green) in kidney sections from WT1CreERt2;R26mTmG;actin-rtTA+ control (Upper panels) and WT1CreERt2;R26mTmG;i-TERTci experimental mice (lower panels) euthanized 20 days after the reversal period. Scale bars = 20 µm. Arrow heads show differentiated podocytes (SYN + ) devoid of EGFP signal. e Quantification of data in (d). Percentage of SYN + area that do (EGFP + ) and do not (EGFP-) overlap with EGFP signal in glomeruli of WT1CreERt2;R26mTmG;actin-rtTA+ control mice (n = 4) and WT1CreERt2;R26mTmG;i-TERTci experimental mice (n = 4) sacrificed 20 days after the stop of doxycycline treatment (R20). Data are shown for each animal and the mean value for each group is shown as a grey line. For each animal, all glomeruli (about 150) on the whole kidney section were analyzed. **p = 0.0019 by t-test for WT1CreERt2;R26mTmG;i-TERTci vs. WT1CreERt2;R26mTmG;actin-rtTA+ mice. f Double immunostaining for EGFP (green) and the nuclear podocyte-restricted marker Wilms’ Tumor Protein 1 (WT1, magenta), in kidney sections from WT1CreERt2;R26mTmG;actin-rtTA+ control (Upper panels), and WT1CreERt2;R26mTmG;i-TERTci experimental mice (Lower panels) sacrificed 20 days after the stop of doxycycline treatment. Scale bar = 20 µm. Arrowheads show differentiated podocytes (WT1 + ) devoid of EGFP signal.
Fig. 4
Fig. 4. Tubular epithelial cells proliferate following a TERTci pulse.
a Schematic representation of TERTci-induced podocyte renewal experiment with EdU treatment upon the early phase of reversal (R0-R8). i-TERTci and actin-rtTA+ control mice were treated for 15 days (D15) with doxycycline to induce transient TERTci overexpression (TERTci ON) in i-TERTci mice. The thymidine analogue EdU was administrated in the drinking water of the animals from R0 to R8, and kidneys were collected at R8. b Number of EdU positive cells per millimeter square of cortical area in actin-rtTA+ control (n = 4) and i-TERTci mice (n = 3), in kidneys collected 8 days after stopping doxycycline treatment. Data are shown for each animal and mean value for each group is shown as a green line. *p = 0.020 by t-test for i-TERTci vs. actin-rtTA+ control mice. c Immunostaining for the thymidine analogue EdU (red) in kidney sections from actin-rtTA+ control (upper panel), and i-TERTci (lower panel) mice showing the emergence of arrays of EdU+ cells within the kidney inner cortex of i-TERTci mice (arrowheads). Scale bar = 300 µm. d Schematic representation of the adult mammalian nephron showing markers of its different sections that were used to locate EdU+ cells. e Quantification of EdU+ cells distribution within the different sections of the nephron in kidneys collected at the end of the EdU treatment (R8). Percentage of EdU+ cells located within the glomeruli or within the sections of the nephron expressing the Lotus Tetragonolobus Lectin (LTL), the water channel aquaporin 1 (AQP1), the Tamm-Horsfall glycoprotein (THP), the sodium-chloride symporter (NCC) or the water channel aquaporin 2 (AQP2) in actin-rtTA+ control (n = 4) and i-TERTci (n = 3) mice. Data are represented as mean ± SEM. *p = 0.015, and *p = 0.026 by t-test for i-TERTci versus control mice in NCC and AQP2 sections respectively. f Double immunostaining for EdU (green), and the water channel aquaporin 2 (AQP2, red), in a kidney section from an i-TERTci mouse euthanized 8 days after switching-off transgenic TERTci expression and treated with EdU drinking water for 8 days preceding euthanasia. Scale bar = 250 µm. g Schematic representation of EdU chase experiment upon TERTci-induced regeneration. i-TERTci and actin-rtTA+ control mice were treated for 15 days (D15) with doxycycline to induce transient TERTci overexpression (TERTci ON) in i-TERTci mice. EdU was administrated in mice drinking water upon the first 8 days of reversal, and the mice were then switched to normal drinking water for 7 days until kidney collection (R15). h Quantification of EdU+ cells distribution within the different sections of the nephron after 7 days of EdU chase. Percentage of EdU+ cells located within the glomeruli or within LTL, AQP1, THP, NCC or AQP2 sections of the nephron in actin-rtTA+ control (n = 4) and i-TERTci (n = 3) mice. Data are represented as mean ± SEM. *p = 0.034, *p = 0.041, and *p = 0.050 by t-test for i-TERTci vs. actin-rtTA+ control mice in glomeruli, and in LTL and AQP2 sections respectively. i Double immunostaining for EdU (green), and the water channel aquaporin 2 (AQP2, red), in kidney sections from actin-rtTA+ control and i-TERTci mice sacrificed 15 days after switching-off transgenic TERTci expression and treated with EdU drinking water during the early phase of reversal (R0-R8). Glomeruli are lined by white circles. Scale bar = 200 µm. j Triple immunostaining for EdU (green), the nuclear podocyte-restricted marker Wilms’ Tumor Protein 1 (WT1, red) and the podocyte-restricted actin-associated protein synaptopodin (SYN, white) in a kidney section from an i-TERTci mouse euthanized after 7 days of EdU chase (R15) showing differentiated podocytes that incorporated EdU (arrowheads).
Fig. 5
Fig. 5. Clonal expansion of mono-colored cells invade the glomerulus compartment following a TERTci pulse in the adult kidney.
In this figure, spectral confocal microscopy images depicting the overlay of the 4 Fluorescent Proteins (FP) are indicated by “Confetti”. a Schematic of unbiased approach used to track progenitor cells in i-TERTci mice. Adult UBCCreERt2;R26Confetti;i-TERTci mice were treated with sub-optimal doses of tamoxifen to tag part of the cells within the kidney with a fluorescent protein in a random manner. Podocyte renewal was then induced by the mean of transient TERTci overexpression. Examination of glomeruli at the end of the experiment allows to discriminate two potential cellular mechanisms supporting podocyte renewal: 1) activation of multiple podocyte progenitor cells, or 2) clonal expansion of a single progenitor cell. b Semi-thick (150–200 µm) kidney sections from UBCCreERt2;R26Confetti;actin-rtTA+ control mice collected 30 days (R30) after removing doxycycline. Scale bar = 100 µm. c Semi-thick kidney sections from UBCCreERt2;R26Confetti;i-TERTci mice collected 30 days (R30) after removing doxycycline, showing the invasion of single-colored clones (Cyan, left panel and Yellow, right panel), from the urinary pole (arrowheads) up to the glomerulus. Scale bars = 100 µm. d Semi-thick kidney section from an UBCCreERt2;R26Confetti;i-TERTci mouse collected 30 days (R30) after removing doxycycline, showing a clonal cell expansion that spreads from the proximal convoluted tubule (arrowhead) to the glomeruli. Scale bar = 50 µm. e Imaging of semi-thick kidney sections from UBCCreERt2;R26Confetti;i-TERTci mice collected 30 days (R30) after removing doxycycline, showing the emergence of single-colored glomeruli (from left to right, Yellow, Red, Green and Cyan). Scale bars = 50 µm. f Quantification of glomeruli and proximal tubules showing clonal expansions similar to panel (c), (d) and (e), in kidneys from UBCCreERt2;R26Confetti;actin-rtTA+ control (actin-rtTA + , n = 3), and UBCCreERt2;R26Confetti;i-TERTci mice (i-TERTci, n = 3), 30 days after removing doxycycline. Data are shown for each animal and the mean value for each group is represented as a green line. For each animal, the total number of glomeruli (about 60) per kidney mosaic tiles were quantified. ***p = 0.0005 by t-test for i-TERTci versus control mice. g Whole-mount immunostaining for the nuclear marker of terminally differentiated podocyte WT1 (magenta) on semi-thick kidney sections from a UBCCreERt2;R26Confetti;i-TERTci mouse with nuclear GFP clonal glomeruli showing co-localization of the GFP + cells with WT1 (arrowheads).
Fig. 6
Fig. 6. Endogenous TERT is required for glomerular renewal following a TERTci pulse.
a Kinetic analysis by Bradford assay of proteinuria in urine samples of i-TERTci (pink, n = 5) and i-TERTci;TERTKO/WT (orange, n = 8) mice in the time course of transient TERTci overexpression experiment. Data are represented for each individual mouse as proteinuria level relative to R0 value in the time course of the experiment. b Proteinuria values (mg/ml) in i-TERTci (pink, n = 5) and i-TERTci;TERTKO/WT (orange, n = 8) mice during the reversal period. Data are shown for each animal and mean value for each group is shown as a green line. *p = 0.028 and *p = 0.023 by t-test for i-TERTci;TERTKO/WT versus i-TERTci at R13 and R18, respectively. c Sirius Red staining on kidney sections from i-TERTci and i-TERTci;TERTKO/WT mice collected 18 days after doxycycline withdrawal (R18). Scale bar = 50 µm. d Quantification of glomeruli with abnormal morphology (such as displayed for i-TERTci;TERTKO/WT mice in (c)), in kidney sections from actin-rtTA+ (n = 5), i-TERTci (n = 5), actin-rtTA+;TERTKO/WT (n = 5) and i-TERTci;TERTKO/WT (n = 8) mice at 18 days of reversal (R18). Data are shown for each animal and the mean value for each group is shown as a green line. For each animal, all glomeruli (about 150) on the whole kidney section were analyzed. *p = 0.0306 and **p = 0.002 by t-test for i-TERTci versus actin-rtTA+ and for i-TERTci;TERTKO/WT versus actin-rtTA+;TERTKO/WT respectively. e Quantification of the mean number of Wilms tumor protein (WT1) positive cells per glomerulus. Data are shown for each animal and the mean value for each group is shown as a green line. For each animal, all glomeruli (about 150) on the whole kidney section were analyzed. *p = 0.0136 by t-test for i-TERTci;TERTKO/WT versus actin-rtTA+;TERTKO/WT.
Fig. 7
Fig. 7. TERT-induced podocyte renewal triggers modulation of genes involved in EMT, ECM remodeling and KRAS signaling.
a Top enriched gene signatures found by Gene Set Enrichment Analysis (GSEA) using Hallmark (grey histograms) and Curated (purple histograms) gene sets in kidneys of i-TERTci mice upon the recovery period (reversal day 8, R8). Enrichment profiles of Epithelial-to-Mesenchymal transition (EMT) and KRAS_UP signaling are shown on the left. b Comparison of the top 30 enriched gene signatures found by GSEA Hallmark upon podocyte renewal in TERTWT/WT mice following ADR-induced injury (D18) and in i-TERTci mice (reversal day 8, R8). Common gene signatures between TERTWT/WT and i-TERTci mice are highlighted in Yellow, gene signatures only enriched in i-TERTci mice are highlighted in red, and gene signatures only enriched in TERTWT/WT mice are highlighted in blue. c GSEA enrichment profiles related to immune response in i-TERTci mice upon the recovery period (reversal day 8, R8) and in TERTWT/WT following ADR-induced injury (D18). d Analysis of GO terms biological process using Reactome. The top 4 processes upregulated in i-TERTci mice upon the recovery period are shown (red squares), and further compared to the same processes in TERTWT/WT mice (blue triangles).
Fig. 8
Fig. 8. TERT exhibits non-canonical functions in glomerular repair and podocyte renewal in the adult mouse kidney.
Model to illustrate the non-canonical functions of endogenous TERT and TERTci pulse in glomerular regeneration. a Healthy glomerulus showing terminally differentiated podocytes and intact glomerular basement membrane (GBM). b Following ADR-induced injury, podocytes insult conducts to their detachment from the glomerular capillaries and destabilization of the GBM. Albumin leakage in the urine leads to an increase of proteinuria. Two physiological responses can occur, a repair response that may involve putative podocyte hypertrophy and/or progenitor cell differentiation, or a scar formation that leads to persistent FSGS. Our results suggest that endogenous TERT could mediate the physiological repair via the activation of pro-EMT, ECM-remodeling and KRAS genes, while its deficit conducts to its failure. c In a model of ubiquitous and transient transgenic TERTci overexpression, the dramatic dedifferentiation and proliferation of podocytes conducts to a collapsing FSGS, characterized by the impairment of the GBM and capillary tuft collapse. Our results reveal two scenarios following TERTci reversal. The repair response is characterized by the expansion of podocyte progenitors that clonally invade the glomerulus to repopulate the PTC, PEC, and podocyte layers which is associated to the modulation of Wnt, Hedgehog, and Notch signaling. This functional repair that conducts to normalization of the proteinuria requires the bi-allelic expression of endogenous TERT. If endogenous TERT is deficient, the glomerular repair is not operating, leading to scar formation and persistent FSGS. Focal and segmental glomerulosclerosis (FSGS), Extracellular matrix (ECM), Parietal epithelial cells (PEC), Proximal tubule cell (PTC), Glomerular basement membrane (GBM), Epithelial-to-mesenchymal transition (EMT).

Similar articles

Cited by

References

    1. Go AS, Chertow GM, Fan D, McCulloch CE, Hsu CY. Chronic kidney disease and the risks of death, cardiovascular events, and hospitalization. N. Engl. J. Med. 2004;351:1296–1305. - PubMed
    1. Wiggins RC. The spectrum of podocytopathies: a unifying view of glomerular diseases. Kidney Int. 2007;71:1205–1214. - PubMed
    1. Nagata M. Podocyte injury and its consequences. Kidney Int. 2016;89:1221–1230. - PubMed
    1. Shankland SJ, Freedman BS, Pippin JW. Can podocytes be regenerated in adults? Curr. Opin. Nephrol. Hypertens. 2017;26:154–164. - PMC - PubMed
    1. Appel D, et al. Recruitment of podocytes from glomerular parietal epithelial cells. J. Am. Soc. Nephrol. 2009;20:333–343. - PMC - PubMed