. 2022 Feb 11;12(1):2354.
doi: 10.1038/s41598-022-06279-4.

Relationship between oxidative stress and lifespan in Daphnia pulex

Affiliations

Relationship between oxidative stress and lifespan in Daphnia pulex

Benedicth Ukhueduan et al. Sci Rep. .

Abstract

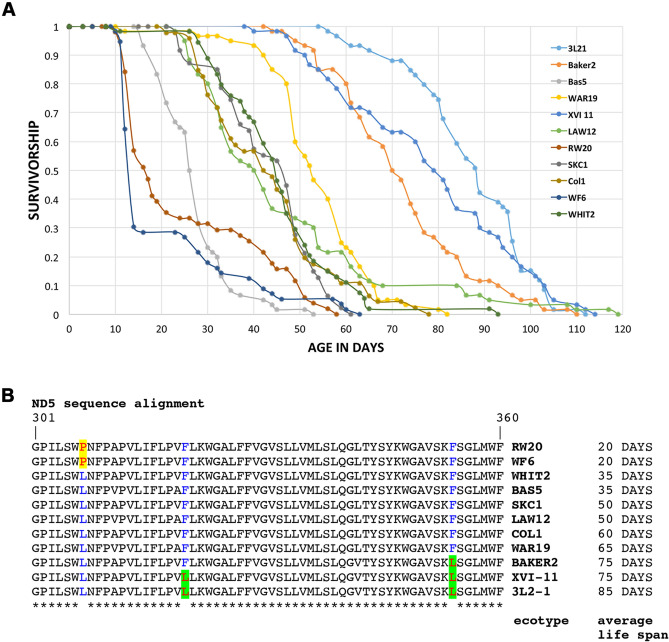
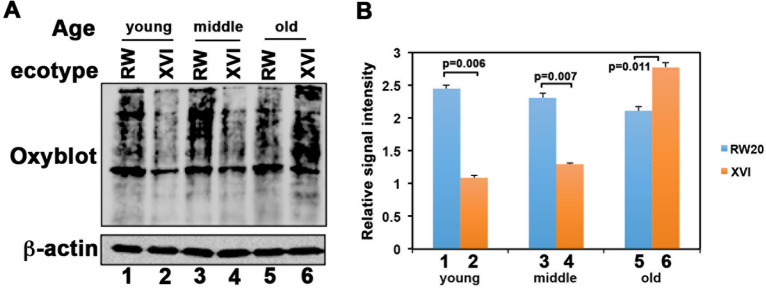
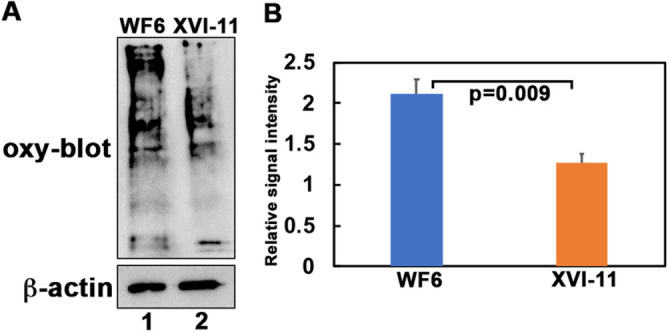
Macromolecular damage leading to cell, tissue and ultimately organ dysfunction is a major contributor to aging. Intracellular reactive oxygen species (ROS) resulting from normal metabolism cause most damage to macromolecules and the mitochondria play a central role in this process as they are the principle source of ROS. The relationship between naturally occurring variations in the mitochondrial (MT) genomes leading to correspondingly less or more ROS and macromolecular damage that changes the rate of aging associated organismal decline remains relatively unexplored. MT complex I, a component of the electron transport chain (ETC), is a key source of ROS and the NADH dehydrogenase subunit 5 (ND5) is a highly conserved core protein of the subunits that constitute the backbone of complex I. Using Daphnia as a model organism, we explored if the naturally occurring sequence variations in ND5 correlate with a short or long lifespan. Our results indicate that the short-lived clones have ND5 variants that correlate with reduced complex I activity, increased oxidative damage, and heightened expression of ROS scavenger enzymes. Daphnia offers a unique opportunity to investigate the association between inherited variations in components of complex I and ROS generation which affects the rate of aging and lifespan.


Conflict of interest statement

The authors declare no competing interests.

Figures

Figure 1
Figure 1
Adult survivorship curves and ND5 sequence alignments. (A) Genetic differences of adult survivorship among populations of D. pulex. Each line represents a specific clone. Pond clones: RW20, WF6, WHIT2, SKC1, and Col1. Lake clones: Bas5, LAW12, WAR19, Baker, XVI-11, and 3L21. (B) ND5 sequence alignments in the order of increasing life spans. Only a short relevant region of the sequence alignments is shown. Red font with yellow highlighting: amino acids specific to the short-lived clones, red font with green highlighting: amino acids specific to the long-lived clones, blue font: positions where amino acid changes are present.
Figure 2
Figure 2
Complex I activity from clones WF6 and XVI-11. (A) Blue Native gels and in-gel activity assay for complex I. Extracts made from short-lived WF6 and long-lived XVI-11 clones were run on Blue Native gel for total amount of complex I and a duplicate gel was stained for measuring complex I activity. Lanes 1–3: 15 μg, 30 μg, and 45 μg of total extract prepared from XVI-11 mitochondria and lane 4–6: 15 μg, 30 μg, and 45 μg of total extract prepared from WF6 mitochondria. (B) Quantification of relative activity of complex I. The band intensities of total complex I and in-gel activity were measured in 4 separate experiments and the complex I activity relative to total amount of complex I was calculated. Blue bars indicate short-lived WF6 samples and the orange bars indicate long-lived XVI-11 samples. The p-values are as indicated.
Figure 3
Figure 3
Oxidative damage to cellular proteins. (A) Protein carbonyl levels were measured with the Oxyblot kit (Millipore). Using total cellular extracts, the carbonyl groups in the protein side chains were derivatized to 2,4-dinitrophenyl hydrazine (DNP). Western blot analysis was performed with an antibody against DNP. Equal loading was assessed using an anti-β actin antibody (Sigma). Y: young (1 wk for both clones), M: middle aged (2 wk for short-lived RW20 and 4 wk for long-lived XVI-11) and O: old age (3 wk for short-lived RW20 and 8 wk for long-lived XVI-11). (B) Bar graph represents the signals obtained from the analysis of the average of 3 blots from various samples after normalization to the β-actin bands. Blue corresponds to short-lived RW20 and orange corresponds to the long-lived XVI-11.
Figure 4
Figure 4
Oxidative damage to MT proteins. (A) Protein carbonyl levels were measured with the Oxyblot kit (Millipore). Using mitochondrial protein extracts, the carbonyl groups in the protein side chains were derivatized to 2,4-dinitrophenyl hydrazine (DNP). Western blot analysis was performed with an antibody against DNP. Equal loading was assessed using an anti-β actin antibody (Sigma). Lane 1: MT extract from mixed age populations of WF6 with about equal individuals from ages 1 wk-3 wk of the short-lived WF6 and lane 2: MT extract from mixed age populations of XVI-11 with about equal individuals from ages 1 wk-3 wk of the long-lived XVI-11. (B) Bar graph represents the signals obtained from the analysis of the average of 3 blots after normalization to the β-actin bands. Blue corresponds to short-lived WF6 and orange corresponds to the long-lived XVI-11.
Figure 5
Figure 5
Comparison of SOD activity levels in short-lived RW20 and long-lived XVI-11. SOD activity was determined using a colorimetric assay kit (Sigma). The kit was first standardized for use with Daphnia samples. All reactions were performed in a 96 well plate and the activity was read on a BioTek Plate reader at a wavelength of 450 nm using the Gen5 software that was included as part of the Bio-Tek plate reader. Note that commercially available SOD was used in the assay to develop a standard curve for SOD activity. Blue bars: SOD activity at indicated ages for short-lived RW20 and orange bars: SOD activity at indicated ages for long-lived XVI-11. Error bars indicate the standard error of the mean from 4 experiments. Student T-tests were performed and the p values are as indicated.
Figure 6
Figure 6
Comparison of hydrogen peroxide levels in short-lived RW20 and long-lived XVI-11. Hydrogen peroxide levels were determined at the indicated ages for short-lived RW20 and using a kit available through Pierce. Before the kit, which uses a colorimetric assay, was used with samples from aged Daphnia, the kit was standardized for use with Daphnia samples (Data not shown). All reactions were performed in a 96 well plate that was read on a BioTek Plate reader at a wavelength of 560 nm using the Gen5 software that was included as part of the Bio-Tek plate reader. Blue corresponds to short-lived RW20 and orange corresponds to the long-lived XVI-11. Error bars indicate the standard error of the mean from 3 experiments. Student T-tests were performed and the p values are as indicated, ns means not significant.
Figure 7
Figure 7
Comparison of catalase activity in RW20 and XVI-11. Catalase activity was determined using a previously published protocol based upon the extinction of hydrogen peroxide over a period of time. All reactions were performed in a 96 well plate that was read on a BioTek Plate reader at a wavelength of 240 nm using the Gen5 software that was included as part of the Bio-Tek plate reader. Plates were read every 47 s for a duration of 5 min and the extinction of hydrogen peroxide was calculated. The activity of catalase was then calculated based upon the slope of the line representing the disappearance of hydrogen peroxide. Blue corresponds to short-lived RW20 and orange corresponds to the long-lived XVI-11. Error bars indicate the standard error of the mean from 3 experiments and the p-values are as indicated.

Similar articles

Cited by

References

    1. Lopez-Otin C, Blasco MA, Partridge L, Serrano M, Kroemer G. The hallmarks of aging. Cell. 2013;153:1194–1217. doi: 10.1016/j.cell.2013.05.039. - DOI - PMC - PubMed
    1. Richardson AG, Schadt EE. The role of macromolecular damage in aging and age-related disease. J. Gerontol. A. 2014;69(Suppl 1):S28–32. doi: 10.1093/gerona/glu056. - DOI - PubMed
    1. Fischer F, Hamann A, Osiewacz HD. Mitochondrial quality control: An integrated network of pathways. Trends Biochem. Sci. 2012;37:284–292. doi: 10.1016/j.tibs.2012.02.004. - DOI - PubMed
    1. Luce K, Weil AC, Osiewacz HD. Mitochondrial protein quality control systems in aging and disease. Adv. Exp. Med. Biol. 2010;694:108–125. doi: 10.1007/978-1-4419-7002-2_9. - DOI - PubMed
    1. Page MM, Robb EL, Salway KD, Stuart JA. Mitochondrial redox metabolism: Aging, longevity and dietary effects. Mech. Ageing Dev. 2010;131:242–252. doi: 10.1016/j.mad.2010.02.005. - DOI - PubMed

Publication types

Substances