. 2022 Feb 11;12(1):2373.
doi: 10.1038/s41598-022-06340-2.

Providing early indication of regional anomalies in COVID-19 case counts in England using search engine queries

Affiliations

Providing early indication of regional anomalies in COVID-19 case counts in England using search engine queries

Elad Yom-Tov et al. Sci Rep. .

Abstract

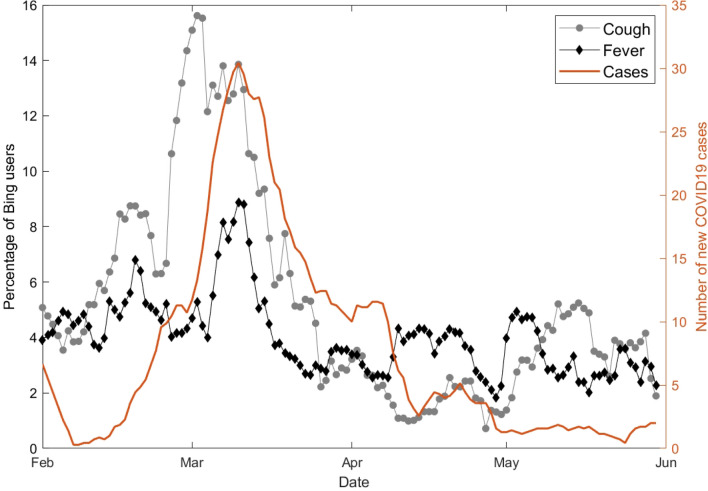
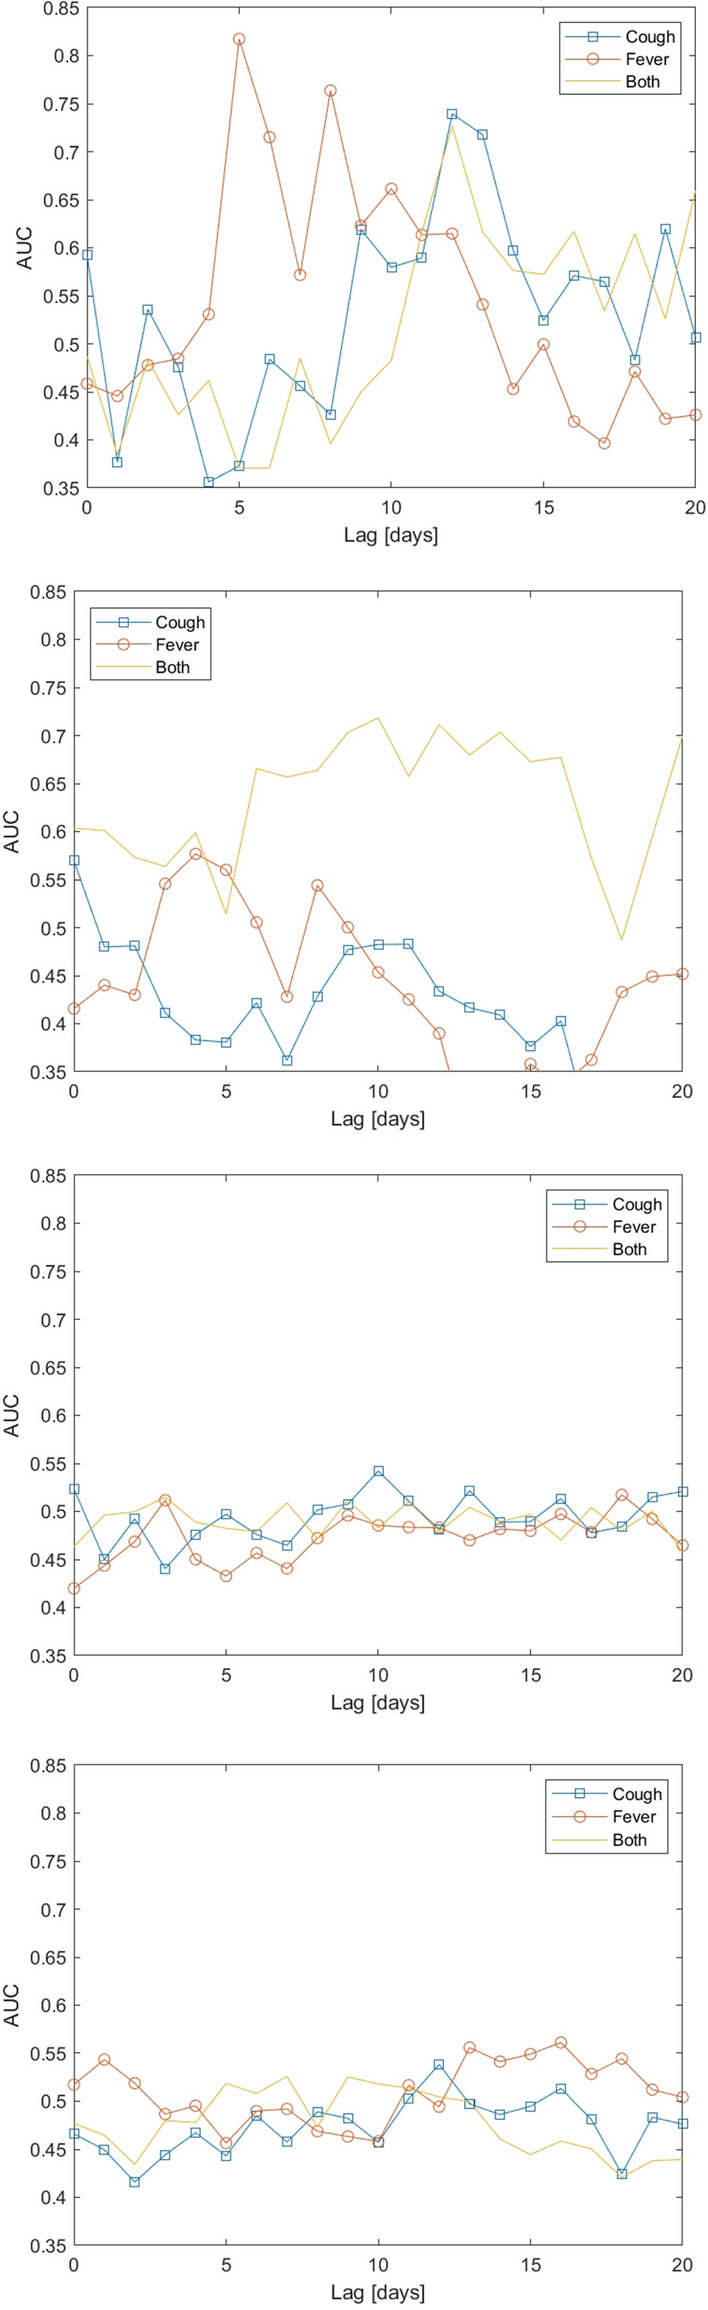
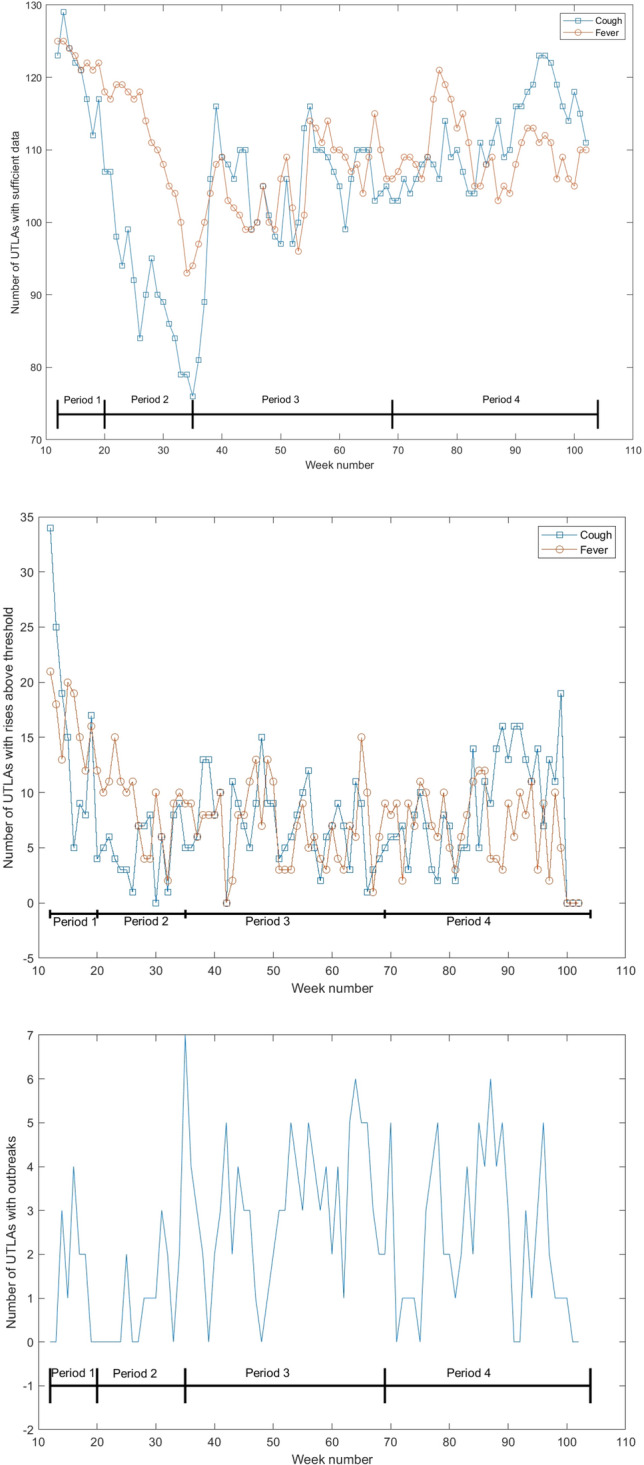
Prior work has shown the utility of using Internet searches to track the incidence of different respiratory illnesses. Similarly, people who suffer from COVID-19 may query for their symptoms prior to accessing the medical system (or in lieu of it). To assist in the UK government's response to the COVID-19 pandemic we analyzed searches for relevant symptoms on the Bing web search engine from users in England to identify areas of the country where unexpected rises in relevant symptom searches occurred. These were reported weekly to the UK Health Security Agency to assist in their monitoring of the pandemic. Our analysis shows that searches for "fever" and "cough" were the most correlated with future case counts during the initial stages of the pandemic, with searches preceding case counts by up to 21 days. Unexpected rises in search patterns were predictive of anomalous rises in future case counts within a week, reaching an Area Under Curve of 0.82 during the initial phase of the pandemic, and later reducing due to changes in symptom presentation. Thus, analysis of regional searches for symptoms can provide an early indicator (of more than one week) of increases in COVID-19 case counts.


Conflict of interest statement

EYT is an employee of Microsoft, owner of Bing. ME and TI were employees of UKHSA. All other authors have no conflict of interest.

Figures

Figure 1
Figure 1
Number of COVID-19 cases (brown) and percentage of Bing users who queried for “cough” in a sample UTLA (gray circles) and for “fever” (black deltoids). Curves are smoothed using a moving average filter of length 7.
Figure 2
Figure 2
Area Under Curve (AUC) of the UTLA outlier measure for detecting unusually large rises in COVID-19 cases per UTLA, as a function of the lag between case counts and Bing data. The four figures refer to the four time periods: First wave (top) to fourth wave (bottom). Dates of the 4 periods are: (1) March 1st to May 31st. 2020, (2) June 1st to August 31st, 2020, (3) September 1st, 2020 to April 30th, 2021, and (4) May 1st, 2021 to December 13th, 2021. Curves are computed for all weeks and all UTLAs at each time period.
Figure 3
Figure 3
Number of UTLAs with sufficient Bing data over time (top), number of UTLAs with values over the threshold over time (middle) and number of UTLAs with an anomaly (as defined in the “Methods” section) (bottom). Week numbers correspond to the weeks since the beginning of 2020. The periods marked are: (1) March 1st to May 31st. 2020, (2) June 1st to August 31st, 2020, (3) September 1st, 2020 to April 30th, 2021, and (4) May 1st, 2021 to December 13th, 2021.

References

    1. Moss P, Barlow G, Easom N, Lillie P, Samson A. Lessons for managing high-consequence infections from first covid-19 cases in the uk. Lancet. 2020;395:e46. doi: 10.1016/S0140-6736(20)30463-3. - DOI - PMC - PubMed
    1. Lampos V, Miller AC, Crossan S, Stefansen C. Advances in nowcasting influenza-like illness rates using search query logs. Sci. Rep. 2015;5:1. doi: 10.1038/srep12760. - DOI - PMC - PubMed
    1. Yang S, Santillana M, Kou SC. Accurate estimation of influenza epidemics using google search data via ARGO. PNAS. 2015;112:14473–14478. doi: 10.1073/pnas.1515373112. - DOI - PMC - PubMed
    1. Wagner M, Lampos V, Cox IJ, Pebody R. The added value of online user-generated content in traditional methods for influenza surveillance. Sci. Rep. 2018;8:1–9. - PMC - PubMed
    1. Edelstein M, Wallensten A, Zetterqvist I, Hulth A. Detecting the norovirus season in sweden using search engine data-meeting the needs of hospital infection control teams. PloS ONE. 2014;9:e100309. doi: 10.1371/journal.pone.0100309. - DOI - PMC - PubMed

Publication types